www.nat-hazards-earth-syst-sci.net/9/673/2009/ © Author(s) 2009. This work is distributed under the Creative Commons Attribution 3.0 License.
and Earth
System Sciences
Evaluation of a preliminary satellite-based landslide hazard
algorithm using global landslide inventories
D. B. Kirschbaum1,2, R. Adler2,3, Y. Hong4, and A. Lerner-Lam1
1Lamont-Doherty Earth Observatory and Department of Earth and Environmental Sciences, Columbia University, Palisades, New York, USA
2Laboratory for Atmospheres, NASA Goddard Space Flight Center, Greenbelt, Maryland, USA 3ESSIC, University of Maryland College Park, College Park, Maryland, USA
4School of Civil Engineering and Environmental Sciences, University of Oklahoma, National Weather Center, Norman, Oklahoma, USA
Received: 25 June 2008 – Revised: 15 January 2009 – Accepted: 15 April 2009 – Published: 6 May 2009
Abstract. Most landslide hazard assessment algorithms in common use are applied to small regions, where high-resolution, in situ, observables are available. A prelimi-nary global landslide hazard algorithm has been developed to estimate areas of potential landslide occurrence in near real-time by combining a calculation of landslide suscepti-bility with satellite derived rainfall estimates to forecast areas with increased potential for landslide conditions. This paper presents a stochastic methodology to compare this new, land-slide hazard algorithm for rainfall-triggered landland-slides with a newly available inventory of global landslide events, in or-der to determine the predictive skill and limitations of such a global estimation technique. Additionally, we test the sensi-tivity of the global algorithm to its input observables, includ-ing precipitation, topography, land cover and soil variables. Our analysis indicates that the current algorithm is limited by issues related to both the surface-based susceptibility map and the temporal resolution of rainfall information, but shows skill in determining general geographic and seasonal distri-butions of landslides. We find that the global susceptibility model has inadequate performance in certain locations, due to improper weighting of surface observables in the suscepti-bility map. This suggests that the relative contributions of to-pographic slope and soil conditions to landslide susceptibil-ity must be considered regionally. The current, initial fore-cast system, although showing some overall skill, must be improved considerably if it is to be used for hazard warning
Correspondence to: D. B. Kirschbaum
or detailed studies. Surface and remote sensing observations at higher spatial resolution, together with improved landslide event catalogues, are required if global landslide hazard fore-casts are to become an operational reality.
1 Introduction
Landslides rank as one of the most pervasive hazards glob-ally, yet estimates of landslide susceptibility and hazard as-sessment are limited primarily to small spatial scales and are constrained by data availability and spatial resolution (Crozier and Glade, 2006). Methodologies developed for high spatial and temporal resolutions, time-dependent or dy-namic landslide hazard assessments are designed for regions with adequate surface data, near real-time precipitation mon-itoring networks, and high-quality event catalogues for cal-ibration and validation. As a result, these methods do not scale up easily for regional or global assessments of time-dependent landslide hazard. Dilley et al. (2005) and Nadim et al. (2006) develop landslide susceptibility and risk maps at the global scale to represent hazard and population exposure, but these assessments are static. While these studies estimate spatial exposure, they do not provide a dynamic picture of landslide hazard.
160oW 120oW 80oW 40oW 0o 40oE 80oE 120oE 160oE
160oW 120oW 80oW 40oW 0o 40oE 80oE 120oE 160oE
70
oS 30 oS 10 oS 10 oN 30 oN 70 oN
70
o
N 30
o
N 10
o
N 10
o
S 30
o
S 70
o
S
Susceptibility Index
2003 Landslides 2007 Landslides
3 4 5 0
1 2
Fig. 1. Global landslide susceptibility index data from Hong et al. (2007a), plotted with the 2003 and 2007 landslide inventory data. Susceptibility Index values 4 and 5 (yellow and red) denote areas that are considered as high susceptibility in the algorithm. The exact definition of the susceptibility index values is presented in Hong et al. (2007a).
necessarily predict individual landslide events, but to identify locations that exhibit a high probability for landslide initia-tion, dynamically. The approach taken by Hong et al. (2006, 2007) is very challenging due to limitations in surface and precipitation data as well as the global scope at which dy-namic landslide hazard assessment is evaluated. As a result, this landslide hazard algorithm remains an experimental first step and requires calibration, validation and improvement be-fore it can be used for hazard warning. This paper evaluates the predictive capacity and accuracy of algorithm forecasts against a new database of global landslide occurrences con-sidered over the same time period. We introduce a methodol-ogy for evaluating dynamic forecasts using global landslide inventories, and discuss the data limitations inherent in the inventories and forecast algorithm. We evaluate components of the algorithm to determine both relative and absolute pre-dictive skill, and estimate the sensitivity of input and valida-tion parameters. Potential improvements are discussed.
2 Summary of current products 2.1 Algorithm description
The satellite-based global landslide hazard algorithm draws on several remote sensing observables to derive a land-slide susceptibility map and rainfall intensity-duration rela-tionship. All of the datasets, ranging in spatial resolution from 90-m to 1 degree, were aggregated or interpolated to 0.25◦×0.25◦resolution for the susceptibility map using the median value within each grouping of pixels. Topography, slope, drainage density and other quantities were derived from a global digital elevation model from the Shuttle Radar Topography Mission (SRTM) (Rabus et al., 2003). Moderate Resolution Imaging Spectroradiometer (MODIS) land cover
products were used to delineate land cover types using the algorithm outlined by Friedl et al. (2002) and were parti-tioned into general land cover classes according to Larsen and Torres-S´anchez (1998). Landslide susceptibility values were assigned to each cover type on a scale of increasing susceptibility to shallow landslides. Soil characteristics were obtained from (FAO/UNESCO, 2003) and (Batjes, 2000).
Six parameters were chosen to estimate susceptibility: slope, soil type, soil texture, elevation, land cover, and drainage density. The parameters were normalized glob-ally and integrated using a weighted linear combination of variables. The weight for each variable was qualitatively assigned using information from previous landslide suscep-tibility studies, which specifies the relative importance of each variable (Coe et al., 2004; Dai and Lee, 2002; Lee and Min, 2001; Sarkar and Kanungo, 2004; Larsen and Torres-Sanchez, 1998). The following weights were assigned: slope – 0.3, soil type – 0.2, soil texture – 0.2, elevation – 0.1, land cover – 0.1, and drainage density – 0.1. Weighted, normal-ized variables were combined to develop a global susceptibil-ity map with a numerical index varying from 0 (water bodies and ice) to 5 (highest susceptibility) (Fig. 1). Since no global landslide validation data were available, Hong et al. (2007a) compared the susceptibility results with a North American study (Godt, 1997) and found there to be a reasonable, qual-itative, fit. Details are presented in Hong et al. (2007a).
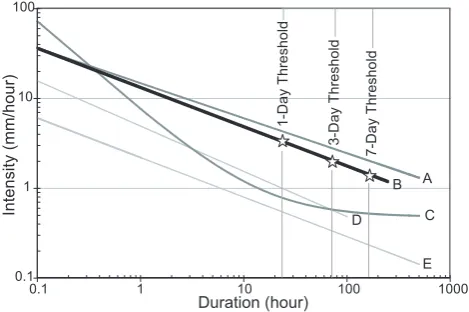
Multi-Satellite Precipitation Analysis (TMPA) Version 6 rainfall estimates (Huffman et al., 2007) for 74 landslide oc-currences globally, most of which were shallow landsliding events. The curve used in the algorithm falls slightly below the curve defined by Caine (1980) and above the quasi-global curves outlined by Innes (1983), Crosta and Frattini (2001), and Guzzetti et al. (2008), all of whom consider shallow landslides and debris flows (Fig. 2). The TMPA rainfall pro-vides 3-hourly coverage from 50◦N to 50◦S at 0.25◦×0.25◦ resolution from 1998 to the present. These values are con-sidered at each pixel globally and rainfall accumulations are summed over 1, 3, and 7-day durations, updating every 3 h. The average rainfall intensity is calculated as a continuous variable over the specified durations, rather than defining specific rainfall events in time. The cumulative rainfall es-timates are divided by the specified duration to obtain aver-age rainfall intensity values, for a more direct comparison to previous studies.
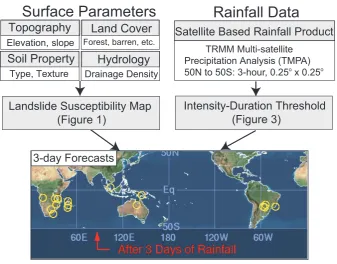
To determine areas of landslide potential globally, the susceptibility map and rainfall accumulations are consid-ered on the pixel scale at 3-h intervals. If the susceptibil-ity index for a given pixel has a high Susceptibilsusceptibil-ity Index (SI) value of Category 4 or 5 and the rainfall accumula-tion at the specified duraaccumula-tion exceeds the corresponding I-D threshold value, the pixel is identified as having high land-slide potential and a forecast is issued. There is no speci-fication for landslide forecast magnitude or size due to the coarse resolution and global scale of this model and the limited number of surface and precipitation inputs used to define potentially susceptible landslide conditions globally. The flow chart for this algorithm framework is illustrated in Fig. 3. The method is operating in near real-time, with re-sults updated every three hours at http://trmm.gsfc.nasa.gov/ publications dir/potential landslide.html.
2.2 Landslide inventory data 2.2.1 Data description
One of the main factors limiting landslide hazard assess-ments on regional (country-level) or global scales is the lack of landslide inventories that can be used to validate landslide hazard models. A few studies have catalogued landslide oc-currences at the national or global scale (Guzzetti et al., 1994; Petley et al., 2005). While they provide valuable insight into landslide distribution, the studies constrain the search criteria for cataloguing landslide occurrences spatially or by event impact. In order to evaluate the global landslide haz-ard algorithm, a global landslide inventory has been prepared for rainfall-triggered landslides reported in the media. Each landslide entry attempts to describe a landslide occurrence, which can be a single landslide or grouping of events trig-gered by the same extreme rainfall. In this paper, we refer to an individual landslide entry in the catalogue as a landslide event. The entry includes the date of occurrence, nominal
0.1 1 10 100
0.1 1 10 100 1000
Duration (hour)
Intensity (mm/hour)
A B
C D
E
1-Day Threshold
3-Day Threshold
7-Day Threshold
Fig. 2. Global rainfall intensity-duration thresholds: (A)
Caine (1980), (B) Hong et al. (2006), (C) Crosta and Frattini (2001), (D) Innes (1983), (E) Guzzetti et al. (2008). The 1, 3, and 7-day du-rations considered by the algorithm are shown on the graph.
location and geographic coordinates, type of trigger, land-slide impacts, and qualitative descriptions of the relative size and location accuracy of the landslide.
The reports were extracted from journal articles, existing databases and online news media as well as government and relief aid organization reports. The study includes all types of rapidly-occurring landslides, most of which are relatively shallow landslides or debris flows occurring within 10 m of the surface, although the actual depth of the landslide or type of movement is rarely given. The inventory has been pre-pared for the years 2003 and 2007 and is currently being prepared for 2008 and 2009. The resulting landslide inven-tories have 205 landslide reports for 2003 and 350 reports for 2007. The spatial distribution of the landslide inventories is illustrated in Fig. 1. A detailed analysis of the landslide inventory is given by Kirschbaum et al. (2009).
2.2.2 Inventory data limitations
The inventory is influenced by reporting biases, which af-fect the availability, reliability, and completeness of land-slide reports. The landland-slide inventory reports are particularly limited when landslide events are associated with contem-poraneous hazards such as tropical cyclones, or when land-slides occur in remote areas where they are typically under-reported. These issues are emphasized by studies that em-ploy similar methodologies (Guzzetti et al., 1994; Petley et al., 2005, 2007; Castellanos Abella and van Westen, 2007; Chau et al., 2004). Due to reporting issues, the landslide in-ventory does not provide a comprehensive list of landslide occurrences globally nor does it assume that deficiencies in landslide reporting are distributed randomly.
Elevation, slope
Topography
Surface Parameters
Satellite Based Rainfall Product
Landslide Susceptibility Map
(Figure 1)
Type, Texture
Soil Property
Forest, barren, etc.
Land Cover
Drainage Density
Hydrology
TRMM Multi-satellite Precipitation Analysis (TMPA)
50N to 50S: 3-hour, 0.25o
x 0.25o
Rainfall Data
Intensity-Duration Threshold
(Figure 3)
3-day Forecasts
Fig. 3. Schematic of the Global Landslide Hazard Algorithm. The algorithm is composed of two components: a landslide susceptibility map composed of the listed surface parameters, and an intensity-duration rainfall threshold with TMPA satellite rainfall data. When a pixel on the Susceptibility Map has a value of 4 or 5 and the rainfall accumulation exceeds the intensity-duration threshold value, the pixel is denoted as having high landslide potential and a forecast is issued. The map on the bottom illustrates how the global forecasts are represented on the algorithm website (http://trmm.gsfc.nasa.gov/publications dir/potential landslide.html). Yellow circles denote areas where forecasts have been issued in one time slice. Each area can be zoomed in to observe individual highlighted pixels. This example shows the 3-day duration threshold.
0 5 10 15 20 25 30
0-10 10-25 25-50 50-100 100-250 250-500 500-1,0001,000-5,0005,000-10,00010,000+
Population Density, [People km-2]
Proportion of Events and Forecasts, [%]
2003 Forecasts 2007 Forecasts 2003 Landslide Events 2007 Landslide Events
Fig. 4. Frequency of population density from (CIESIN, 2005) be-tween 3-day algorithm forecasts and landslide events for 2003 and 2007. The distribution of population density values for landslide locations are skewed towards higher values compared to algorithm forecasts.
To develop a general sense of the size and location ac-curacy of each landslide occurrence, two qualitative indices were developed. We assign a “confidence radius” to each catalogue entry, with the highest confidence assigned to land-slides whose locations are known to within 5 km. A relative measure of the size or extent of each landslide occurrence was also defined using a similar ranking scale to differenti-ate very small events (one small hillslope) from landslides with large volumes and aerial extents. In our analysis, we remove landslide entries with either a low location accuracy (location not known within 75 km) or a small size classifi-cation in an attempt to remove some of the reporting biases that may exist between regions. While these specifications do not greatly improve the landslide inventory, they are help-ful in providing a consistent set of criteria that can be used to better express inventory limitations in the context of the algorithm evaluation.
3 Methodology for algorithm evaluation
The algorithm was run retrospectively for 2003 and 2007 us-ing 1, 3 and 7-day temporal windows to obtain the number and location of algorithm forecasts for each year. Pixels oc-curring within a 1◦radius and within one day of each other
were grouped to represent a single forecast, providing a more realistic representation of the number of forecasts for each year. We assume that forecasted landslides represent all ty-pologies, although shallow landslide events are more likely to be forecast because they were used to calibrate the rainfall I-D threshold relationship.
3.1 Forecast evaluation techniques
This analysis compares the spatial and temporal distributions of algorithm forecasts and landslide catalogued events to de-termine the general accuracy and the potential limitations of this preliminary landslide forecast approach. Our compari-son is constrained by the incompleteness of the landslide in-ventory and the relatively low spatial resolution of the algo-rithm forecasts. Nevertheless, the inter-comparison approach provides a useful framework for assessing the algorithm’s operational potential and limitations in the landslide inven-tory data.
We evaluate the susceptibility map and rainfall intensity-duration threshold separately, comparing them with the land-slide inventory spatially and temporally. The size of the algo-rithm forecast catalogues is approximately an order of mag-nitude larger than the corresponding landslide inventories, since there are many more areas that exhibit landslide poten-tial conditions with no landslides than actual events, and the landslide inventories are incomplete. Since the ratio of algo-rithm forecasts to landslides is overly large, we must develop both absolute and relative skill indicators. This allows us to
identify geographic areas which may not be well-represented by the current susceptibility and rainfall information.
Geographic Information System (GIS) software was used to determine where and when the forecasts successfully re-solve landslide occurrences. To account for uncertainty in the landslide inventory locations, each landslide occurrence was defined as a circle equal to its assigned confidence ra-dius. We consider a landslide to be successfully resolved if the algorithm forecast intersects the landslide occurrence 1 day prior or subsequent to the landslide date, correspond-ing to our estimate of the temporal precision of the landslide inventory.
To evaluate the algorithm’s relative skill, we calculated the number of algorithm forecasts and landslide inventories within 2◦×2◦ cells globally. The 2◦resolution was chosen to clearly discriminate between algorithm forecast events, since forecast pixels within 1◦could be considered originat-ing from the same event. We present the results for the 3-day temporal threshold. Forecast and landslide databases were normalized by the total database size. A Skill Ratio (SR) is defined as the normalized forecast density over the landslide inventory density at each pixel, written as:
For pixelj, whereNF andNL>0,
letNˆjF = N
F j P
j
NjF (1)
letNˆjL= N
L j P
j
NjL
SRj = X
j
ˆ
NjF
ˆ
NjL
wherej represents the pixel indices,NF is the number of forecasts andNLis the number of landslides globally. The skill ratio indicates that a pixel with SR>1 has more forecasts than landslides, SR<1 has fewer forecasts compared to the density of landslides, and SR≈1 has a comparable number of forecast and landslides.
Areas with no reported landslides but a high density of algorithm forecasts (Type I Errors) are considered Over-forecasts, written as:
IfNjL=0 then Over−forecastsj =
NjF
max(NF) (2)
Areas with landslide occurrences and no forecasts (Type II Errors) are labeled as Missed Landslides, written as:
IfNjF =0 then Missed Landslidesj =
NjL
0 10 20 30 40 50
0 1 2 3 4 5
Susceptibility Index
Proportion of Total Event, [%]
2007 Susceptibility 2003 Susceptibility
Fig. 5. Frequency of 2003 and 2007 landslide inventory events for each susceptibility index category. The susceptibility index cate-gories are shown in Fig. 1 and described in Hong et al. (2007a).
were plotted on a global map for comparison. The precise meaning of the Skill Ratio and Over-forecast values is lim-ited, since the landslide inventory is incomplete. Relative skill, however, highlights the spatial discrepancies between forecasts and observed occurrence, and suggests a more ro-bust measure of validity.
The absolute skill of the algorithm is evaluated using a Probability of Detection (POD) value, which indicates the number of landslide occurrences that are successfully pre-dicted by the algorithm forecasts over time (Panofsky and Brier, 1965). While this statistic suffers from the same in-ventory limitations as the relative skill metrics, it provides us with some indication of how the current algorithm performs in time. We define the statistic as:
POD=XN
F
j ∩NjL
NL (4)
3.2 Evaluation of surface parameters
We evaluate the importance of the algorithm’s constitutive variables by examining the sensitivity of the Over-forecast and Missed Landslide metrics to soil texture, land cover, and slope. These three surface variables have clearly identifiable effects on slope instability and are heavily weighted in the current susceptibility index (Nadim et al., 2006; Guinau et al., 2005; Wang and Sassa, 2005). Soil texture and soil type are closely related so only soil texture is examined. The three surface variable grids were aggregated from 0.25◦×0.25◦ resolution to a 1◦ grid globally using the mean value from each set of cells. The maximum value within the grid was used to represent slope. The soil texture and land cover grids were then individually normalized and values were extracted from each variable for landslide locations and algorithm fore-cast locations.
Table 1. Percentage of landslide occurrences in each Susceptibility Index category for coastal and inland event locations. Results indi-cate that landslides loindi-cated inland have higher susceptibility values compared to landslide events located in coastal areas.
Susceptibility 2003 2007
Index Coastal Inland Coastal Inland
0 22% 1% 9% 2%
1 5% 0% 26% 0%
2 15% 3% 19% 5%
3 20% 15% 18% 22%
4 12% 25% 16% 35%
5 27% 57% 13% 37%
We estimate the spatial sensitivity of algorithm over-forecasts to input variables by defining a Correlation Param-eter (CP), which represents the product of normalized soil or land cover with the normalized Over-Forecast metric, written as:
ˆ
NjS|LC= S|LCj
(maxS|LC−minS|LC) (5)
Correlation Parameter,CPSj|LC=Overforecastsj∗ ˆNjS|LC whereS|LC represents either soil texture or land cover. The CP can be used as a proxy to estimate the spatial coherence and sensitivity of each parameter affecting over-forecasted areas. The statistic is used to create a 1◦ global grid with a quantitative index ranging from 0 to 1, with 1 indicating pixels where the density of forecasts is highly sensitive to the surface variable.
4 Results
4.1 Susceptibility map
regions. In addition, high population growth in coastal ar-eas can contribute to incrar-eased landslide frequency, a factor that is not incorporated in the current susceptibility map, but which affects the landslide inventory database.
4.2 Rainfall threshold detection
We chose a subset of landslide occurrences with high con-fidence in their location (i.e., location known within 25 km) in order to estimate the relative success of the I-D thresh-old. 161 events were chosen from the 2003 database and 309 from 2007. For each event, daily rainfall accumulation was calculated using TMPA rainfall data for the seven days prior to and the date of the reported event. Using the same 1, 3, and 7-day duration threshold windows considered in the algorithm, average rainfall intensity measurements were cal-culated in two ways: finding one average rainfall value for the three durations, with the landslide date serving as a fixed end point; and calculating the average rainfall intensity for the three durations using a running window end date over the 8 days of each record.
Rainfall accumulation for the landslide occurrences ex-ceeded the I-D threshold values for only 28% of the 2003 landslide inventory and 17% of the 2007 events, suggesting that either the rainfall threshold is too high or the TMPA rain-fall data is limited (Table 2). Many of the 2003 and 2007 landslide occurrences that were not resolved were associated with short-duration, high-intensity rainfall, typically exceed-ing the I-D threshold at sub-daily scales of 3 to 12 h. The failure of the I-D threshold to resolve over 70 to 90% of the landslide occurrences suggests that either the threshold is too high for the temporal durations considered, the tem-poral windows are too long, the satellite data cannot appro-priately resolve surface rainfall intensities, the landslide was incorrectly located or dated, or the landslide was triggered by conditions other than rainfall. It is likely that multiple factors contribute to these unresolved landslide occurrences. 4.3 Algorithm forecasts
4.3.1 Relative skill
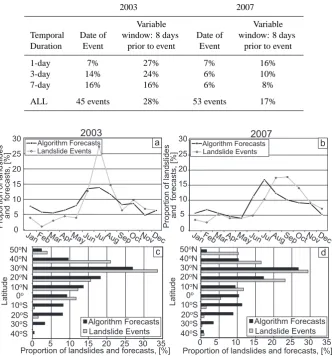
We compared the algorithm forecasts with the landslide in-ventories according to the percentage of events by month and 10◦ latitude bands (Fig. 6). The monthly distribu-tions for both years indicate similar seasonal patterns, with a peak in landslide occurrences and forecasts in the North-ern Hemisphere summer (June through September) which is consistent with the trend suggested in Petley et al. (2005). We also consider the latitudinal characteristics of the land-slide occurrences and algorithm forecasts to determine if the two datasets have the same distribution in the Northern and Southern Hemispheres. Figure 6 indicates that the forecasts and landslides follow similar distributions for the Northern Hemisphere, with the largest percentage of events in both
databases occurring within the 20–30◦North latitude band.
However, the same distribution does not apply in the South-ern Hemisphere, where there are very few landslide reports in proportion to the percentage of forecasts. We attribute this discrepancy to landslide reporting biases or non-English me-dia in Central and Southern Africa and South America as well as over-forecasting in certain locations. There is likely a strong geographic bias in this statement given the small size of the validation dataset.
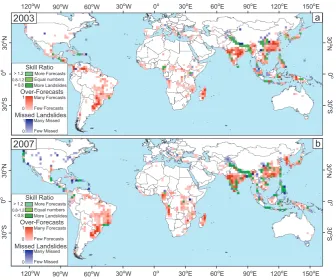
The Skill Ratio, Over-forecast, and Missed-Landslide metrics are used to illustrate where the algorithm is over-estimating, under-over-estimating, or correctly resolving landslide activity and susceptibility. The three statistics were plotted on one map for 2003 (Fig. 7a) and 2007 (Fig. 7b). A positive Skill Ratio, depicted in green, indicates areas with both land-slide reports and forecasts. Over-forecasted areas are shown in red, and blue areas denote pixels where landslides have been identified without corresponding forecasts.
4.3.2 Absolute skill
POD values are calculated at 1, 3, and 7-day temporal win-dows by considering the landslide occurrences that are accu-rately detected by the algorithm forecasts for the entire land-slide population as well as the landland-slide events only occur-ring in high susceptibility index categories (Table 3). The 1-day threshold window resolves the largest percentage of the events for both years (32% for 2003 and 22% for 2007) and decreases as the temporal window increases. However the number of forecasts increases from approximately 1100 to 5000 forecasts per year as the temporal window decreases from 7 days to 1 day, resulting in larger concentrations of over-forecasted pixels. We attribute this large number of forecasts at shorter temporal thresholds to more frequent high-intensity, short-duration events as well as an overesti-mation of high susceptibility values, rather than too low an I-D threshold. This conclusion is problematic due to the sig-nificant difficulty of the I-D threshold to resolve a large ma-jority of the landslide inventory events. This is based on the results of Sect. 4.2.
5 Sensitivity analysis
5.1 Surface variables and resolution
Table 2. Evaluation of rainfall intensity-duration thresholds at 3 temporal windows, shown as the proportion of landslides resolved at each temporal duration. The two columns for each year show the percentage of landslide events resolved when the landslide date is fixed and when the intensity-duration threshold values are considered in a variable window within 8 days of the landslide event.
2003 2007
Variable Variable
Temporal Date of window: 8 days Date of window: 8 days
Duration Event prior to event Event prior to event
1-day 7% 27% 7% 16%
3-day 14% 24% 6% 10%
7-day 16% 16% 6% 8%
ALL 45 events 28% 53 events 17%
Latitude
Algorithm Forecasts Landslide Events 0
5 10 15 20 25 30
0 5 10 15 20 25 30 35
L
a
ti
tu
d
e
Proportion of landslides and forecasts, [%] 0
5 10 15 20 25 30
JanFebMarAprMayJunJulAugSepOctNovDec
a
2003 2007
Landslide Events
Algorithm Forecasts b
c d
Proportion of landslides
and forecasts, [%]
10oS 0o 20oN 30oN 40oN 50oN
30oS 40oS 20oS 10oN
Landslide Events Algorithm Forecasts
Proportion of landslides and forecasts, [%]
10oS 0o 20oN 30oN 40oN 50oN
30oS 40oS 20oS 10oN
JanFebMarAprMayJunJulAugSepOctNovDec
Algorithm Forecasts Landslide Events
Proportion of landslides and forecasts, [%]0 5 10 15 20 25 30 35
Fig. 6. Frequency of landslide occurrences and algorithm forecasts spatially and temporally for 2003 (left) and 2007 (right); (a) and (b) show the percentage of landslide events and algorithm forecast by month; (c) and (d) show the percentage of landslide events and algorithm forecasts by latitude.
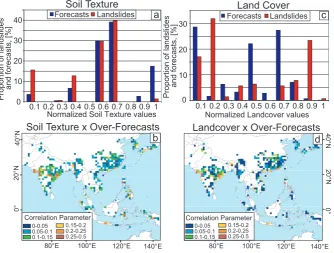
the susceptibility map. We extract the normalized soil tex-ture values for forecast locations and landslide locations and find that soil texture values tend to be higher in forecast loca-tions compared to landslide areas (Fig. 8a). This implies that soil texture is biasing the susceptibility map without adding additional utility and its inclusion in the susceptibility in-dex should be re-evaluated or de-emphasized. This result is not surprising given the coarse spatial resolution of soil data. Figure 8b highlights the spatial Correlation Parame-ter for soil texture within EasParame-tern Asia and Oceania. The highest correlations over the Indian peninsula and portions of Southeastern China indicate that soil texture is likely the primary source of over-forecasting. This can significantly bias the susceptibility index in areas where the slope values (weighted as 0.3) are relatively low.
For the land cover data, the percentage of normalized land cover pixels above 0.7 is much larger for catalogued events than for forecasts, indicating that land cover may play a more influential role in the Susceptibility Index than its current weight of 0.1 suggests (Fig. 8c). Figure 8d illustrates the Correlation Parameter for land cover, with values exhibiting a distribution similar to that for soil texture but with slightly smaller values.
2003
b a 2003
30
oN
30
oS
0
o
120oW 90oW 60oW 30oW 0o 30oE 60oE 90oE 120oE 150oE
30
o
N
30
o
S
0
o
2007
30
o
N
30
o
S
0
o
30
oN
30
oS
0
o
120oW
90oW 60oW 30oW 0o 30oE 60oE 90oE 120oE 150oE
More Forecasts
More Landslides Equal numbers
Missed Landslides Over-Forecasts
Many Forecasts
Few Forecasts
Few Missed Many Missed Skill Ratio
0.8-1.2 < 0.8 > 1.2
1
0
1
0
More Forecasts
More Landslides Equal numbers
Missed Landslides Over-Forecasts
Many Forecasts
Few Forecasts
Few Missed Many Missed Skill Ratio
0.8-1.2 < 0.8 > 1.2
1
0
1
0
Fig. 7. Global map of the Skill Ratio, Over-forecasts, and Missed Landslide statistics for (a) 2003 and (b) 2007. Green represents the skill ratio, defined as the normalized forecast density over the landslide density. Red denotes areas with a high density of forecasts but no landslides, and blue indicates pixels with landslide reports and no algorithm forecast. Both the Over-forecasts and Missed-landslide areas are normalized by the maximum density values.
Table 3. Probability of Detection (POD) values for three temporal windows, where the columns indicate the proportion of landslide events in each landslide catalog that were resolved by the algorithm for the specified temporal duration. For each year, the first column displays all landslide occurrences and the second column only considers landslides that are located in areas with a susceptibility index value of 4 or 5.
2003 2007
POD: Total POD: Only POD: Total POD: Only Temporal Landslide Susceptibility Landslide Susceptibility
Duration Inventory 4 and 5 Inventory 4 and 5
1-day 22% 32% 13% 22%
3-day 15% 21% 10% 17%
7-day 13% 18% 6% 11%
soil type and soil texture values. When slope is aggre-gated to 0.25◦×0.25◦resolution using the median value for
each set of 90-m pixels, the maximum slope resolved in the 0.25◦×0.25◦ product globally is 21 degrees, a clear under-estimation of the highest slope values. A more appropriate methodology is needed to accurately compute or character-ize slope values for aggregated pixels.
Spatial resolution and uncertainty or errors in the sur-face data products limit the accurate characterization of sus-ceptibility conditions. Land cover information offers near-homogenous global coverage; however the classification of
0 10 20 30
0.1 0.2 0.3 0.4 0.5 0.6 0.7 0.8 0.9 1 Normalized Landcover values
c
Forecasts Landslides
Landcover x Over-Forecasts
0 10 20 30 40
0.1 0.2 0.3 0.4 0.5 0.6 0.7 0.8 0.9 1
Proportion of landslides
and forecasts, [%]
a
Soil Texture x Over-Forecasts
Normalized Soil Texture values
b
Soil Texture Land Cover
d 40°N
20
°N
0°
140°E 120°E
100°E 80°E
20
°N
40°
N
0°
140°E 120°E 100°E
80°E
Correlation Parameter 0-0.05
0.05-0.1 0.1-0.15
0.15-0.2 0.2-0.25 0.25-0.5 Correlation Parameter
0-0.05 0.05-0.1 0.1-0.15
0.15-0.2 0.2-0.25 0.25-0.5
Forecasts Landslides
Proportion of landslides
and forecasts, [%]
Fig. 8. Comparison of landslide event and algorithm forecast databases for soil texture (left) and land cover (right): (a) normalized soil texture values considered at algorithm forecast locations and landslide event locations; (b) spatial distribution of the Correlation Parameter between Over-forecasted areas and soil texture values; (c) normalized land cover values extracted for algorithm forecast locations and landslide event locations; (d) Correlation Parameter for Over-forecasted areas and land cover values.
0 5 10 15 20 25
0 1 2 3 4 5 6 7 8 9 10 11 12 13 14 15 16 17 18 19 20 21
Slope, [o]
Proportion of Pixels, [%]
Forecasts Landslides
Fig. 9. Example of slope distribution for the 2003
algo-rithm forecasts (black) and landslide occurrences (grey) using the 0.25◦×0.25◦slope product. Results are divided into 1 degree bins.
5.2 Rainfall sensitivity
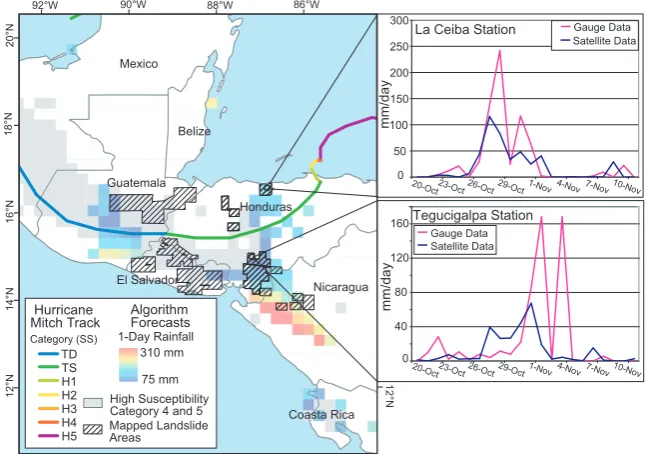
In order to evaluate how rainfall observations affect algo-rithm performance, we applied the algoalgo-rithm to a case study of Hurricane Mitch in Central America (landfall 29 Octo-ber, 1998, Category 1 on SS scale). Landslide inventory data were compiled in affected areas in Honduras, Nicaragua, El
Salvador, and Guatemala (USGS, 2007). The mapped ar-eas were compared with the algorithm forecasts using 1-day temporal windows for 10 days before and after the storm’s landfall. Approximately 60–70% of the mapped land area corresponded to high susceptibility values. The algorithm forecasts intersect the mapped regions in parts of Nicaragua, Honduras, and a small portion of Guatemala; however, large portions of El Salvador, Guatemala and Western Honduras did not receive forecasts. This is likely due to the poor detec-tion of high-intensity, short-duradetec-tion rainfall events, which were frequent during Hurricane Mitch (Fig. 10).
Nicaragua Honduras
El Salvador Guatemala
Mexico
Belize
Coasta Rica High Susceptibility
Category 4 and 5 Mapped Landslide Areas
Category (SS)
Hurricane Mitch Track
La Ceiba Station
0 50 100 150 200 250 300
20-Oct23-Oct26-Oct29-Oct1-Nov 4-Nov 7-Nov 10-Nov
mm/
da
y
Gauge Data Satellite Data
Tegucigalpa Station
0 40 80 120 160
mm/day
Gauge Data Satellite Data
Algorithm Forecasts
86°W 88°W
90°W 92°W
20
°N
18
°N
16
°N
14
°N
12
°N 12
°N
310 mm
75 mm 1-Day Rainfall TD
TS H1 H2 H3 H4 H5
20-Oct
23-Oct26-Oct29-Oct1-Nov 4-Nov 7-Nov 10-Nov
Fig. 10. Example of algorithm performance for Hurricane Mitch in October to November, 1998. Map shows the path and intensity of the storm according to the Saffir-Simpson scale. The algorithm was run using a 1-day temporal window and forecasts were plotted according to the cumulative rainfall. Forecasts are compared to mapped landslide areas (hatched boxes). Graphs at the right compare daily rainfall accumulation estimates for two available NCDC rainfall gauges in Honduras and TMPA satellite data.
(Fisher, 2004). However, this example provides insight into some of the underlying discrepancies between in situ and re-motely sensed rainfall estimations.
One reason for the discrepancy between satellite and gauge rainfall is that TMPA satellites are unable to contin-ually monitor the rainfall intensities in a storm, but rather provide a snapshot of the rainfall field at a minimum of 3-h intervals due to t3-he sampling frequency (Huffman et al., 2007). In addition, the 0.25◦×0.25◦ spatial resolution and 1-day temporal window limits the ability to resolve high-intensity, short-duration events such as fast-moving tropical systems. Dealing with extremes in radar rainfall data is an ongoing topic of research in remote-sensing and the degree to which we can better resolve such extremes will affect the forecasting capabilities of these systems. Shallow orographic rainfall is also not well-resolved in the current TMPA rainfall data due to the difficulties in resolving warm rain processes over land as well as the underestimation of mountainous re-lief, leading to significant under-estimations of rainfall (Bar-ros and Lang, 2003; Adler et al., 2000). This is likely what occurred in the mapped areas in Guatemala, where complex topography is common and there were no forecasts issued (Bucknam et al., 2001). Antecedent soil moisture is also a key variable unaccounted for in the triggering relationship that can be used to identify susceptible surface conditions dynamically (Glade et al., 2000).
6 Discussion
The goal of this analysis is to evaluate a proposed global landslide hazard assessment algorithm using global landslide inventory data in order to determine what contributes to sig-nificant uncertainties, and how key input observations inter-relate. Considering landslide hazard globally is an extremely challenging task that requires large generalizations of the physical mechanisms underlying slope instability as well as the rainfall-triggering processes. As a result, there are many factors limiting our ability to evaluate quantitatively the algo-rithm’s performance, including the consideration of surface variables and rainfall data at the same coarse spatial resolu-tion globally and the troubling incompleteness of the land-slide catalogues. Despite these limitations, the analysis sug-gests that the algorithm demonstrates some predictive skill in resolving the landslide inventory events. Although a ro-bust test is vitiated by limitations in the underlying variables, we suggest that the statistical framework we have developed is useful for assessing the performance of global forecasting methods as well as their limitations. The proposed method for dynamic landslide hazard forecasting has these limita-tions:
1. Improper identification of susceptible areas results in Over-forecasting biases;
3. Landslide inventory incompleteness for global and re-gional calibration and validation.
The present susceptibility map demonstrates some skill in resolving the potential location of landslide events; however, there are many regions where susceptibility is overestimated compared to what is realistic. The weighted linear combina-tion approach used to integrate the parameters in the suscep-tibility map employs a subjective categorization of weights which serves to bias the susceptibility values regionally. In-stead, a susceptibility evaluation should be done using re-gression and sensitivity analysis to more appropriately relate surface observables to susceptibility.
The spatial resolution of surface variables at 0.25◦×0.25◦
in the susceptibility map results in a loss of important in-formation, particularly for slope. When 90-m slopes are ag-gregated to coarser spatial resolutions, particularly using the median value, small, but important surface features are ob-scured including coastlines and small islands. Probability distributions and modeled slope histograms can be used as a guide to determine the scale at which to approach the issue of slope resolution. Building on the current data inputs and methodologies, a new susceptibility map can be derived at a higher spatial resolution using a separate weighting scheme to better resolve these features.
The relative skill metrics, Skill Ratio, Over-forecast den-sity, and Missed landslide denden-sity, are useful for spatially evaluating algorithm performance and highlighting areas in which the algorithm requires improvements. The western and central portion of the Himalayan Arc, Western India, areas in Southeast China and parts of the Philippines and Indonesia have a positive Skill Ratio, suggesting that there are both landslides and algorithm forecasts in these regions; however for some areas, particularly in Northern India and Nepal, the Skill Ratio below 1 indicates that there are com-paratively more landslides than forecasts. This is likely a re-sult of satellite data underestimating rainfall at high altitudes during the monsoon season, since the susceptibility values are generally high in these regions (Barros et al., 2000). Many of the landslide occurrences in this region were also reported along major highways. While we removed all land-slides that were clearly anthropogenically triggered, such as those in mines, removing events along roads would exclude too much of our inventory. This suggests that anthropogenic modification of the surface plays a sizeable role in increasing surface instability, which has not been resolved in the current susceptibility map. The high Over-forecast densities in the Indian peninsula, Brazil, Eastern China, and Central Africa appear to come from over-emphasizing soils information and under-weighting slope, which result in high susceptibility in-dex values. Lastly, missed-landslides have the highest den-sity in the Central United States, portions of the Caribbean, and parts of Western Asia including Afghanistan and Pak-istan. We attribute this to low susceptibility index values in coastal areas, poorly resolved rainfall accumulations, or
enhanced instability from other factors such as snow melt, seismic activity, and anthropogenic influence.
Although it is difficult to differentiate the physical suscep-tibility conditions from biases in landslide reporting, the tem-poral and latitudinal distribution of forecasts can provide in-sight into this issue. Both the landslide events and algorithm forecasts exhibit consistent seasonal and spatial patterns for 2003 and 2007; however, the proportion of algorithm fore-casts to landslides is much higher for the Southern Hemi-sphere tropics and sub-tropics, compared to other areas. The relative skill evaluation indicates that over-forecasting is a problem in Brazil and Central Africa; however, the landslide reporting may be a larger contributor to the uncertainty due to non-English reporting of landslide events and limited trans-mission of event information to media sources.
Since 60–70% of the landslides fall within high suscep-tibility locations, the low POD values (ranging from 19 to 33%) imply that the rainfall threshold relationship is vastly under-estimating rainfall accumulation. While the rainfall intensity-duration threshold may be the most straightforward way to estimate potential landslide triggering conditions, considering the I-D threshold curve at the global scale may not be the ideal way to resolve these events, particularly among different climatic zones (Guzzetti et al., 2008). In addition, the minimum 1-day threshold is unable to success-fully identify events with short-duration, high-intensity rain-fall triggers. The limited sampling frequency of the current TMPA satellite data at sub-daily scales precludes the use of rainfall accumulations at less than one day. Specifying I-D thresholds regionally may help to resolve the rainfall ex-tremes and could be enhanced with antecedent soil moisture information to provide more system memory.
The landslide inventory data represents one of the largest uncertainties in our algorithm evaluation because without a complete dataset, we are unable to pinpoint the contribution of each variable’s uncertainty to the total estimation of al-gorithm accuracy. For our analysis, we require information on all available rainfall-triggered landslide occurrences at the global scale and therefore cannot limit the scope of our analy-sis at this point. The use of regional data from specific events, such as Hurricane Mitch, can offer more comprehensive and quantitative information to evaluate algorithm performance. This can provide key insight into the surface variables affect-ing susceptibility in these regions.
7 Conclusions
Furthermore, the methodology used to relate the surface vari-ables in the susceptibility map does not accurately represent surface conditions globally. The susceptibility map should consider data products at higher spatial resolutions using a more physically-based approach to better resolve the quanti-tative relationship between surface variables and their contri-bution to surface instability. Limitations in satellite estima-tion of rainfall, particularly in resolving peak rainfall accu-mulations, influence the detection of rainfall-triggered land-slide events and consequently decrease the effectiveness of the intensity-duration curve. Since the accuracy and reso-lution of the TMPA rainfall data are not likely to improve significantly in the near future, rainfall-triggering informa-tion should be enhanced with addiinforma-tional proxies for hydro-logic instability within the algorithm framework. At present, the algorithm’s temporal memory is only as long as the du-ration windows considered in the rainfall threshold. Intro-ducing a variable such as antecedent soil moisture could ex-tend the memory of the system and better resolve locations of potential instability, particularly following heavy rainfall events. Intensity-duration and rainfall accumulation relation-ships may also be considered regionally to remove some of the climatological bias between regions and allow for more effective evaluation of the pre-conditions and intensities con-tributing to landslide triggering in separate climatologies.
While the global landslide hazard algorithm framework may eventually be useful for forecasting landslide haz-ard conditions at the global scale, at present the approach can be effective for understanding the relationship between landslide-controlling variables. Spatial and temporal data resolution and accuracy serve as the most significant limit-ing factors of this analysis and in many cases may be im-proved upon by considering higher resolution products. The incompleteness of the global landslide catalogue remains a significant limiting factor for validating any algorithm at the global level. We suggest that a comprehensive global cat-alogue be a high-priority goal of in situ and remote sens-ing observational programs. Ensemble regional inventories available from event-based mapping initiatives may help to fill in gaps where global information is lacking. Considering the algorithm framework regionally would present a useful way to test global data sets with more comprehensive land-slide inventory data. Future versions of the algorithm, incor-porating the suggested changes, could make this approach more valuable for discerning areas of potential landslide ac-tivity and allow the research community to consider issues of landslide hazard, risk and vulnerability in a broader context.
Acknowledgements. The authors would like to thank Stephanie Hill
and Lynne Shupp for their help in preparing the landslide inventory database. This research was supported by a grant from NASA Applied Sciences program, NASA Graduate Fellowship (Grant NNG05GN31H) and by the Lamont-Doherty Earth Observatory, Columbia University.
Edited by: P. Reichenbach
Reviewed by: V. Singhroy and another anonymous referee
References
Adler, R. F., Huffman, G. J., Bolvin, D. T., Curtis, S., and Nelkin, E. J.: Tropical Rainfall Distributions Determined Using TRMM Combined with Other Satellite and Rain Gauge Information, J. Appl. Meteor., 39, 2007–2023, 2000.
Barros, A. P., Joshi, M., Putkonen, J., and Burbank, D. W.: A study of the 1999 monsoon rainfall in a mountainous region in cen-tral Nepal using TRMM products and rain gauge observations, Geophys. Res. Lett., 27, 3683–3686, 2000.
Barros, A. P. and Lang, T. J.: Monitoring the Monsoon in the Himalayas: Observations in Central Nepal, June 2001, Mon. Weather Rev., 131, 1408–1427, 2003.
Batjes, N. H.: Global Data Set of Derived Soil Prop-erties, 0.5-Degree Grid (ISRIC-WISE), Oak Ridge National Laboratory Distributed Active Archive Cen-ter, doi:10.3334/ORNLDAAC/546, online available at: http://www.daac.ornl.gov, last access: June 2006, 2000. Bucknam, R. C., Coe, J. A., Chavarr´ıa, M. M., Godt, J. W., Tarr,
A. C., Bradley, L.-A., Rafferty, S., Hancock, D., Dart, R. L., and Johnson, M. L.: Landslides Triggered by Hurricane Mitch in Guatemala – Inventory and Discussion, US Geological Survey, US Department of the Interior, Open-File Report 01-443, 2001. Caine, N.: The Rainfall Intensity Duration – Control of Shallow
Landslides and Debris Flows, Geogr. Ann., 62(1–2), 23–27, 1980.
Castellanos Abella, E. A. and van Westen, C. J.: Generation of a landslide risk index map for Cuba using spatial multi-criteria evaluation, Landslides, 4, 311–325, 2007.
Chau, K. T., Sze, Y. L., Fung, M. K., Wong, W. Y., Fong, E. L., and Chan, L. C. P.: Landslide hazard analysis for Hong Kong using landslide inventory and GIS, Compu. Geosci., 30, 429– 443, 2004.
CIESIN: Gridded Population of the World, Version 3 (GPWv3) Data Collection, Center for International Earth Science Informa-tion Network, Columbia University, 2005.
Coe, J. A., Godt, J. W., Baum, R. L., Bucknam, R. C., and Michael, J. A.: Landslide susceptibility from topography in Guatemala, in: Landslides: Evaluation and Stabilization, edited by: Lacerda, W. A., Ehrlich, M., Fontura, S. A. B., and Say˜ao, A. S. F., Taylor & Francis Group, London, UK, 69–78, 2004.
Crosta, G. B. and Frattini, P.: Rainfall thresholds for triggering soil slips and debris flow, in: Mediterranean Storms, edited by: Mug-nai, A., Guzzetti, F., and Roth, G., Proceedings of the 2nd EGS Plinius Conference on Mediterranean Storms, 2000, Siena, Italy, 2001.
Crozier, M. J. and Glade, T.: Landslide Hazard and Risk: Issues, Concepts and Approach, in: Landslide Hazard and Risk, edited by: Glade, T., Anderson, M. G., and Crozier, M. J., John Wiley & Sons Ltd, West Sussex, 1–40, 2006.
Dai, F. C. and Lee, C. F.: Landslide characteristics and slope insta-bility modeling using GIS, Lantau Island, Hong Kong, Geomor-phology, 42, 213–228, 2002.
Natural Disaster Hotspots: A Global Risk Analysis, The World Bank Hazards Management Unit, 132 pp., 2005.
FAO/UNESCO: Digital soil map of the world and derived soil properties Food and Agriculture Organization, online available at: http://www.fao.org/ag/agl/agll/dsmw.htm, last access: June 2006, 2003.
Fisher, B. L.: Climatological Validation of TRMM TMI and PR Monthly Rain Products over Oklahoma, J. Appl. Meteor., 43, 519–535, 2004.
Friedl, M. A., McIver, D. K., Hodges, J. C. F., Zhang, X. Y., Mu-choney, D., Strahler, A. H., Woodcock, C. E., Gopal, S., Schnei-der, A., Cooper, A., Baccini, A., Gao, F., and Schaaf, C.: Global land cover mapping from MODIS: algorithms and early results, Remote Sens. Environ., 83, 287–302, 2002.
Glade, T., Crozier, M., and Smith, P.: Applying Probability Deter-mination to Refine Landslide-triggering Rainfall Thresholds Us-ing an Empirical “Antecedent Daily Rainfall Model”, Pure Appl. Geophys., 157, 1059–1079, 2000.
Godt, J. W.: Landslide Overview Map of the Coterminous United States, United States Geological Survey (USGS), Open-file Re-port, 97–289, 1997.
Guinau, M., Pall`as, R., and Vilaplana, J. M.: A feasible methodol-ogy for landslide susceptibility assessment in developing coun-tries: A case-study of NW Nicaragua after Hurricane Mitch, Eng. Geol., 80, 316–327, 2005.
Guzzetti, F., Cardinali, M., and Reichenbach, P.: The AVI Project: A Bibliographical and Archive Inventory of Landslides and Floods in Italy, Environ. Manage., 18, 623–633, 1994.
Guzzetti, F., Peruccacci, S., Rossi, M., and Stark, C. P.: The rainfall intensity–duration control of shallow landslides and debris flows: an update, Landslides, 5, 3–17, 2008.
Hong, Y., Adler, R., and Huffman, G.: Evaluation of the po-tential of NASA multi-satellite precipitation analysis in global landslide hazard assessment, Geophys. Res. Lett., 33, L22402, doi:10.1029/2006GRL028010, 2006.
Hong, Y., Adler, R., and Huffman, G.: Use of Satellite Remote Sensing Data in the Mapping of Global Landslide Susceptibility, J. Nat. Hazards, 43, 245–256, 2007a.
Hong, Y., Adler, R. F., and Huffman, G.: An Experimental Global Prediction System for Rainfall-Triggered Landslides Us-ing Satellite Remote SensUs-ing and Geospatial Datasets, IEEE T. Geosci. Remote, 45, 1671–1680, 2007b.
Hong, Y., Adler, R. F., and Huffman, G. J.: Satellite Remote Sens-ing for Landslide MonitorSens-ing on a Global Basis, American Geo-physical Union EOS, 88, 357–358, 2007c.
Huffman, G. J., Adler, R. F., Bolvin, D. T., Gu, G., Nelkin, E. J., Bowman, K. P., Hong, Y., Stocker, E. F., and Wolff, D. B.: The TRMM Multisatellite Precipitation Analysis (TMPA): Quasi-Global, Multiyear, Combined-Sensor Precipitation Esti-mates at Fine Scales, J. Hydrometeorol., 8, 38–55, 2007. Innes, J. L.: Debris flows, Prog. Phys. Geog., 7, 469–501, 1983. Kirschbaum, D. B., Adler, R., Hong, Y., Hill, S., and
Lerner-Lam, A. L.: A global landslide catalog for hazard applica-tions – Method, Results and Limitaapplica-tions, Nat. Hazards, doi:10-1007/s11069-009-9401-4, in press, 2009.
Larsen, M. C. and Torres-Sanchez, A. J.: The frequency and distri-bution of recent landslides in three montane tropical regions of Puerto Rico, Geomorphology, 24, 309–331, 1998.
Lee, S. and Min, K.: Statistical analysis of landslide susceptibility at Yongin, Korea, Environ. Geol., 40, 1095–1113, 2001. Nadim, F., Kjekstad, O., Peduzzi, P., Herold, C., and Jaedicke, C.:
Global landslide and avalanche hotspots, Landslides, 3, 159– 173, 2006.
Panofsky, H. A. and Brier, G. W.: Some applications of statistics to meteorology, The Pennsylvania State University, University Park, PA, 224 pp., 1965.
Petley, D. N., Dunning, S. A., and Rosser, N. J.: The analysis of global landslide risk through the creation of a database of worldwide landslide fatalities, in: Landslide Risk Management, edited by: Hungr, O., Fell, R., Counture, R., and Ebergardt, E., Balkema, Amsterdam, 367–374, 2005.
Petley, D. N., Hearn, G. J., Hart, A., Rosser, N. J., Dunning, S. A., Oven, K., and Mitchell, W. A.: Trends in landslide occurrence in Nepal, Nat. Hazards, 43, 23–44, 2007.
Rabus, B., Eineder, M., Roth, A., and Bamler, R.: The shuttle radar topography mission—a new class of digital elevation models ac-quired by spaceborne radar, ISPRS J. Photogramm., 57, 241– 262, 2003.
Sarkar, S. and Kanungo, D. P.: An integrated approach for landslide susceptibility mapping using remote sensing and GIS, Photo. Eng. Remote Sens., 70, 617–625, 2004.
Thompson, J. A., Bell, J. C., and Butler, C. A.: Digital eleva-tion model resolueleva-tion: effects on terrain attribute calculaeleva-tion and quantitative soil-landscape modeling, Geoderma, 100, 67– 89, 2001.
USGS: Hurricane Mitch Project, Central America, online available at: http://landslides.usgs.gov/research/other/hurricanemitch/ index.php, November, 2007.