•
•
LIS research in Africa: how much is it worth?
A citation analysis of the literature,
1986-2006
Omwoyo Bosire Onyancha
Department of Library and Information Science, University of Zululand Private Bag x I 00 I, KwaDlangezwa 3886, South Africa
b_
[email protected]
Received: 25th May 2007 Accepted: 12thJune 2007
This paper examines library and information science (LIS) literature asproduced and published by researchers inAfrica in order to establish the productivity and impact of LIS research in the region. Using publication counts, and more specifically, citation analysis, the paper demonstrates that the research output and impact of LIS literature on the continent is relatively low when compared to other disciplines in Africa, such as social sciences. Correspondingly, the research forms a small percentage ofboth the national and world total LIS research output. Acomparison ofcountries indicates that South Africa presently leads interms ofboth research output and citations, and Nigeria and South Africa account for over 70% ofthe total number ofAfrica's publications and citations. Other findings are discussed, in addition torecommendations for further research, and ways in which toimprove the visibilityofLIS research in Africa.
I. Introduction
Various authors have observed that the usefulness of a discipline is measured by the amount and quality of research completed in the said discipline (Siddiqui, 1997). According to Lancaster (1991), research productivity and impact is measured through: an analysis of the number of publications produced and the quality of the sources in which the published material appears; assessinghow much of the work is individual, group based or organizational; and determining the quality of the citations in the published works. Whereas research productivity is measured by the number of publications, research impact is often measured through an analysis of citations which are commonly assumed to be an indicator of a source's quality (Wallace, 1989: 18).
There is general concern amongst LIS scholars in Africa concerning the growth, development and relevance of the discipline. Research Interest Groups (RIGs) are being convened to brainstorm effective ways of making the discipline more competitive in the region. At a recently held Progress in Library and Information Science in Southern Africa (PROLISSA) conference, two keynote speakers posed two pertinent questions concerning the status of LIS research in Africa. Mchombu (2002) wondered
"which way information science research in Southern Africa?"
while Moahi (2002) posed the question,"are we making our mark?"
In his paper, Mchombu (2002:7) acknowledges that"there is no baseline data on
research in the information sciences in Africa",
and notes that the quantity of LIS research in Africa is generally low, while its quality is 'variable'.To the best knowledge of the author, there has been no comprehensive study carried out to determine both the quantity and quality of LIS research in Africa. Nevertheless, several researchers have conducted studies that analyze LIS literature with a variety of objectives in mind while using various methodologies. Most of these studies have focused on the productivity of LIS research as published in given journals/periodicals. For instance, Mabawonku (200 I) set out to analyze papers published in the
African Journal
of
Library, Archives, and Information Science
(AJLAIS) between 1996 and 2000 in order to map the changing patterns in library and information science research in Africa. Similarly, Alemna (200 I ) conducted a bibliometric study on the papers published in the AJLAIS during the same period, Le. 1996-2000. This author examined a total of 79 papers using various variables, including the status of the authors, gender, country of origin, and types of research. Mabawonku's (200 I) and Alemna's (200 I) papers were follow-up studies to the previously conducted study by Alemna (1996). Alemna (200 I) used the same journal to analyze LIS research in Africa using more or less the same variables, Le. the status of the authors, gender, country of origin, and types of research, as well as the type and origin of cited records. Aina (2002) later examined the same journal (Le. AJLAIS) to compare the citations in the journal and three other journals regularly used by LIS researchers in Africa, the aim being to identify the frequency with which AJLAIS is consulted and used by researchers in Africa. Aina and Mabawonku (1997) also examined the same journal in order to evaluate the information profession in Anglophone Africa.Internationally, Crawford (1999:224) compares the productivity of LIS literature in two 'primary journals in the field of academic librarianship', namely:
College
&Research Libraries
and theJournal
of
Academic Librarianship;
so as to"evaluate
these journals on the basis
of
type
of
articles published. structure
of
the articles. types
of
statistics used. and data collection
methods used".
Tiew, Abdullah&
Kaur (2002) examined all the articles published in theMalaysian Journal
of
Library and
Information Science (MJLlS)
from 1996 to 2000 to determine, among other aspects: the quantitative growth of articles byvolume; the type of articles; the distribution of references by volume; the range and mean number of references per article; the authorship patterns of articles; the ranked list of the most prolific contributors of articles; the ranked list of authors by geographical affiliation; and the ranked list of authors by institutional affiliation. Other studies that have focused on the analysis of specific LIS journals/periodicals in order to measure productivity in LIS research include He
&
Spink (2002), Lipetz (1999), Raptis (1992), and Siddiqui (1997). Aina (1999) deviated from the analysis of specific journals/peri-odicals in terms of quantity and quality, and focused on individual researchers' productivity. He identified 34 top-ranking researchers in LIS in Africa, and examined a total of 294 papers that the researchers had published between 1990 and1995.
Bibliometric analyses of LIS literature specific to particular geographic regions are also common. For example, Ocholla (2000) used the
South African Bibliographic and Information Network
(SABINET) to analyze LIS research in South Africa -produced between 1993 and 2000 - in order to determine the research capacity and potential in the country. He analyzed data using various indicators, such as research themes/subjects, institutions, quantity of the reports, language of medium, gender and population groups. In an article entitled "Library literature in Ghana, 1950-1994" Kadiri (200 I) used two bibliographies to investigate, among other things, the number of published materials in librarianship in Ghana, formats of publication, research collaboration, and sources of librarianship literature.At the international level, Cano (1999) evaluated LIS research in Spain over a span of I 7 years, during which she iden-tified and analyzed a total number of 354 articles. Uzun's (2002) bibliometric study of LIS research in developing countries and Eastern European countries is one of the few studies to have covered a broader spectrum of countries/geographic regions. Uzun (2002:21) examined "a set of 21 core journals in the field of library and information science (LIS) from
1980-1999" and sought articles with either principal or co-authors from developing countries (DCs) and the formerly socialist Eastern European countries (EECs) in order to identify the productivity of research articles by librarians and information scientists from the aforementioned areas in international journals.
2. Purpose of the study
This study examines LIS records produced by researchers in Africa between 1986 and 2006 in order to measure the quantity and quality of LIS research in Africa in terms of the number of publications and citations as well as its impact when compared with research in selected social science disciplines. In view of the above, the study sought to determine:
I. The level of coverage of LIS records in the Institute for Scientific Information (lSI) and Library and Information Science and Technology Abstracts (L1STA)databases
2. The total world productivity of LIS records between 1986 and 2006 3. The total number of records produced by Africa over the same period 4. The trend of LIS research in Africa from 1986 to 2006
5. LIS records' share of both the national and world output
6. The total number of citations received by LIS records by African country 7. The average number of citations per LIS record in each country
8. The most cited LIS records
9. The performance of LIS research when compared to research in other social sciences
3. Methodology
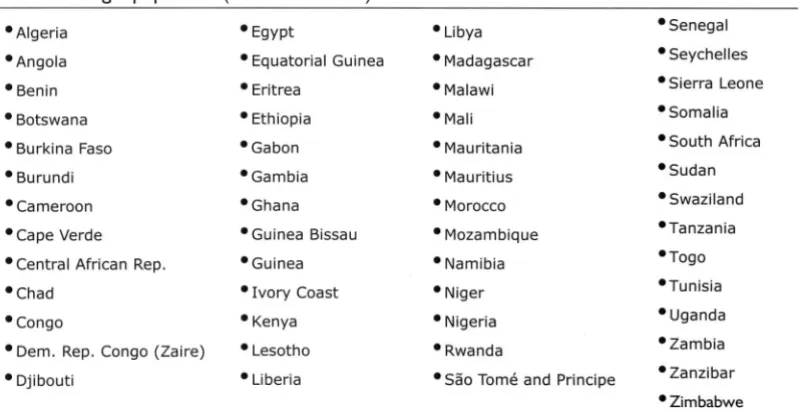
The study targeted a total of 53 African countries (see Table I). Of the 53 countries, 22 are English speaking. Worth noting too is the multi-lingual nature of some countries where there are several official languages (e.g. South Africa which has II official languages, Cameroon [2], Central African Republic [2], Chad [2], Djibouti [2], Eritrea [2], Kenya [2], etc.). Besides English, French is widely spoken in Africa, especially in Sub-Saharan Africa. The language is an official language in 23 countries. Portuguese-speaking countries total five, while there are II Arabic-speaking countries (see
http://
www.nationsonline.org/oneworld/africanJanguages.htm
).
Two sources of data, namely lSI's Web of Knowledge and EBSCO Online were used to extract LIS publications. Specifically, two databases from the Web of Knowledge (i.e. SCI and SSCI) and one electronic database from EBSCO online (i.e. L1STA),were used to collect data. The two lSI databases cover close to 35 different document types from a variety of subject domains (mainly science and social sciences publications) while L1STA indexes more than 600 periodicals plus books, research reports and proceedings. Subject coverage in L1STAincludes librarianship, classification, cataloging, bibliometrics, online information retrieval, information management and more.
Four approaches were used to obtain LIS records, as follows:
I. The total world productivity of LIS records in lSI was determined by searching for two keywords, namely, TS="Librar*" OR TS="lnformation" as 'Topics' of discussion. The search was then refined using the "Subject Categories" option as provided by lSI in order to identify the 'Information Science
&
Library Science' subject category records. It is worth noting that the use of only two keywords may have resulted in fewer LIS records than has been published.2. Another search was conducted within the lSI databases (Le. the Science Citation Index [SCI] and the Social Sciences Citation Index [SSCI]) in order to obtain only LIS records as produced by researchers in Africa by:
a. Identifying a country's total number of publications through an advanced search using '~D='country name"', where AD stands for 'Address' field.
b. Analyzing the identified records using lSI's '~nalyze" feature. The records were analyzed according to 'Subject categories' and whichever country that did not yield any LIS record was excluded from the final analysis.
3. In this way, LIS records were identified, downloaded and saved as
.txt
computer files and thereafter analyzed in order to measure LIS research productivity by country; proportion of LIS research to each respective country's total productivity; the cited ness and uncitedness of LIS research; the most cited works; and the trends of LIS research impact -calculated as the average number of citations per record in each year - in each country.4. In the case of L1STA,only the names of countries were used to search for and download LIS records specific to African countries using the a uniform search strategy, i.e. AF ='country name' where AF is the Author's Institutional Affiliation (or Address) field tag. In this way, all records produced by authors affiliated to institutions which are located in African countries were captured.
The above approaches employed an advanced search in the case of the Science Citation Index and the Social Sciences Citation Index. The same procedures were followed to identify publications published by researchers in Africa in selected social science disciplines (Le. Anthropology, Economics, Education, Geography, History, Political Science, Language and Linguistic theory, and Sociology) for comparative purposes. The Library and Information Science and Technology Abstracts (L1STA) database was used in order to compare the coverage of LIS records in the two bibliographic databases (Le. L1STAand lSI databases). A list of countries that produced LIS records was compiled from the lSI databases and then used to download L1STArecords for comparison purposes only. An attempt was made to use the Library and Information Science Abstracts (LISA) data, but because of the unavailability, on the database, of all contributing authors' addresses, it was excluded from the study.
Table ITarget population (African countries)
• Algeria • Egypt • Libya • Senegal
• Angola • Equatorial Guinea • Madagascar • Seychelles
• Benin • Eritrea • Malawi • Sierra Leone
• Botswana • Ethiopia • Mali • Somalia
• Burkina Faso .Gabon • Mauritania • South Africa
• Burundi .Gambia • Mauritius .Sudan
• Cameroon • Ghana • Morocco • Swaziland
.Cape Verde • Guinea Bissau • Mozambique .Tanzania
• Central African Rep. .Guinea .Namibia .Togo
.Chad • Ivory Coast • Niger .Tunisia
.Congo • Kenya • Nigeria • Uganda
• Dem. Rep. Congo (Zaire) • Lesotho • Rwanda .Zambia
• Djibouti • Liberia • Sao Tome and Principe • Zanzibar
• Zimbabwe
In the absence of a controlled subject vocabulary to describe LIS research and given that the discipline consists of several terms/phrases which are common in other disciplines (e.g. link analysis, content analysis, co-word analysis, data mining, information technology, knowledge management, etc.), the approach that was adopted in this study provided as accurate data as possible. An attempt was made to search for LIS records in the SCI and SSCI using specific terms/phrases, such as those provided by the Association for Library and Information Science Education (2003) in its classification of LIS research
areas, but this proved difficult and yielded inaccurate data. This limitation perhaps explains why various researchers evaluate LIS research using LIS-specific journals and databases.
Data extracted from the SCI and SSCI databases was analyzed using the STIKISIcomputer-aided software to obtain citation and publication frequencies in each year of publication in each country. The average cites per record, which was used to measure a country's publications impact and LIS publications impact in Africa, was calculated as the ratio of the total number of citations to the total number of publications. The rank of the LIS subject category relative to each country's total number of subject categories was used to measure the performance of LIS in the respective countries. Relative performance, whose formula is herein introduced by this author, was thus calculated as follows:
Relative Performance
(rp)
=
Rank (position) of LIS Subject Category
Total no. of Subject categories
where 0 ~
rp ~
IThe relative performance of LIS was deemed high if the ratio was closer to zero (0). For instance, if a LIS subject category ranked second out of a total of 8 subject categories in country A, the
rp
was calculated as 2/8 = 0.25. If, in country B, the LIS subject category ranked 2nd out of a total of 50 subject categories, therp
would be 2/50=0.04. Country B's LIS performance would therefore be rated as higher than that of country A.Finally, it should be borne in mind that the inclusion of other document types such as book reviews, editorial material, meeting abstracts, notes, letters, reviews, and reprints (see Appendix A) in the final analysis resulted in higher productivity and impact than it would have been had we analyzed only journal articles which are assumed to reflect scholarly publishing of research findings. Nevertheless, worth noting is the fact that some of these document types not only ignite debate that may lead to research but also, in the process, attract citations, an aspect that was the subject of discussion in this paper. It is also acknowledged that visibility of an author, institution or country is often measured by, among other indicators, the number of citations that docu'ments published by each of the entities receive. It is in this respect that we included all the document types in the analysis.
4. Results
This section provides the findings of the study under the following subheadings: the world output of LIS publications; LIS research output in Africa; trend of LIS research in Africa; LIS research's contribution to both national and world output; number of citations by country; impact of LIS research; rank and relative performance of LIS; most cited LIS records; cited ness and/or uncitedness of LIS records; and the productivity and impact of LIS and selected social sciences.
4.1 World productivity of LIS records 1986-2006
Table 2 compares LIS publications as indexed in lSI's SCI and SSCI to L1STA databases. There were a total of 15934 records in lSI, while L1STAyielded a total of 823199 publications between 1986 and 2006. The Table illustrates a mixed pattern of growth, whereby some years recorded a growth rate as low as 5 (in the case of lSI) and 1290 records in L1STA. The highest increase in the number of publications was recorded in 1991 (lSI) and 2003 (L1STA), which yielded a difference of 165 and 13962 records between 1990 and 1991 (lSI) and 2002 and 2003 (L1STA), respectively. Similarly, the number of records peaked to 890 in 1998 in lSI and 76902 in 2005 in L1STA.
4.2 LIS research output in Africa 1986-2006
Only records that were downloaded from the lSI databases were analyzed and presented in Table 3, because the main focus of the study was to compute and compare
productivity
andimpact
of LIS publications in Africa. Only the lSI databases provided both research indicators, i.e. number of publications and citations. L1STAprovided only the number of publications. The results in Table 3 show that there were a total of 26 countries in Africa which produced at least one lSI listed LIS record. The leading country was South Africa which produced a total of 439 records, followed by Nigeria (259), while Botswana and Ghana were ranked number three with 59 records each. Kenya (37) came fifth, followed by Egypt (36), Swaziland (29) and Ethiopia (25). At the bottom of the Table are Angola, Gabon and Ivory Coast, which produced one record each. It should also be noted that all the 14 top countries are in Sub-Saharan Africa, while the leading country from Northern Africa (i.e. Morocco) produced only 6 records.Table 2
World productivity of LIS research ranked according to year of publication, 1986-2006lSI L1STA
No. of Records Change in Cumulative %Cumulative No. of records Change in no. Cumulative Percentage no. of records increase increase of records increase change
1986 657 - 657
-
13223 - 13223-1987 694 37 1351 105.63 12918 -305 26141 97.69
1988 651 -43 2002 48.19 12490 -428 38631 47.78
1989 656 5 2658 32.77 17104 4614 55735 44.28
1990 582 -74 3240 21.90 23197 6093 78932 41.62
1991 747 165 3987 23.06 25928 2731 104860 32.85
1992 802 55 4789 20.12 30000 4072 134860 28.61
1993 815 13 5604 17.02 34188 4188 169048 25.35
1994 874 59 6478 15.60 41853 7665 210901 24.76
1995 846 -28 7324 13.06 40449 -1404 251350 19.18
1996 876 30 8200 11.96 39909 -540 291259 15.88
1997 861 -15 9061 10.50 37910 -1999 329169 13.02
1998 890 29 9951 9.82 37744 -166 366913 11.47
1999 828 -62 10779 8.32 37602 -142 404515 10.25
2000 622 -206 11401 5.77 . 39305 1703 443820 9.72
2001 779 157 12180 6.83 40595 1290 484415 9.15
2002 779 0 12959 6.40 49505 8910 533920 10.22
2003 826 47 13785 6.37 63467 13962 597387 11.89
2004 702 -124 14487 5.09 73263 9796 670650 12.26
2005 732 30 15219 5.05 76902 3639 747552 11.47
2006 715 -17 15934 4.70 75647 -1255 823199 10.12
TOTAL 15934 823199
Table 3
Yearly distribution of the LIS records by African country from lSI data, 1986-2006South Africa 7 5 4 8 10 18 7 31 II 32 9 6 14 19 18 23 32 48 56 40 41 439 Nigeria 16 19 23 20 23 19 17 16 8 10 10 9 7 4 8 2 3 9 6 20 10 259
Botswana I I I 6 3 4 3 3 6 2 4 4 I I 3 4 2 5 5 59
Ghana 2 3 10 6 I 4 6 4 7 I I 5 2 I I I 2 2 59
Kenya 3 5 I 5 2 3 2 1 1 I 2 2 5 I 2 I 37
Egypt 2 I I I 2 2 4 I I 2 I 4 2 3 6 3 36
Swaziland 6 2 2 3 3 5 2 2 I I 1 I 29
Ethiopia I 2 3 2 2 5 3 2 I I I I I 25
Tanzania I I I I 4 I 2 I 12
Zambia 3 I I 2 I I 2 I 12
Uganda 1 I I I I 2 I I I 10
Namibia I I 2 I 1 2 8
Benin 2 1 I I 2 7
Morocco I I I I 2 6
Algeria 2 I I 1 5
Libya 3 I I 5
Malawi I 3 I 5
Senegal I I 2 1 5
Cameroon I I I 3
Lesotho I I I 3
Tunisia 2 I 3
Zimbabwe I I I 3
Sierra Leone 1 I 2
Angola I I
Gabon I 1
Ivory Coast I I
-.0 to-. (Xl C1' 0
-
,.... M 't" U'"I -.0 to-. (Xl C1' 0-
,.... M 't" U'"I -.0"Ei
(Xl (Xl (Xl (Xl C1' C1' C1' C1' C1' C1' C1' C1' C1' C1' 0 0 0 0 0 0 0 C1' C1' C1' C1' C1' C1' C1' C1' C1' C1' C1' C1' C1' C1' 0 0 0 0 0 0 0
~
- -
-
-
-
-
--
-
-
-
--
-
,.... ,.... ,.... ,.... ,.... ,.... ,....-+-South Africa _ Nigeria -.- Ghana Botswana -- Kenya -+-Egypt
60
In
s::
040
••
lU.~
.0
30
::l
a.
.•..
20
0
0
z
10
0
to t-- co en 0 .,- N (") '<t L() to t-- co en 0 .,- N (") '<t L() to
co co co co en en en en en en en en en en 0 0 0 0 0 0 0
en en en en en en en en en .,-en en.,- en.,- en.,- en 0 0 0 0 0 0 0
N N N N N N N
Year of publication
Figure ITrend of LIS research in each country between 1986 and 2006
4.3 Trend of LIS research in Africa 1986-2006
Fig Ireveals a zigzag pattern of growth in the number of records in each country. Other than South Africa and Nigeria,
who sometimes recorded more than 10 records in a single year, the rest of the countries remained well under the 10
mark throughout the period under study. Worth noting is Nigeria's continued decline in productivity since 1989, and
South Africa's upward trend, especially post 1997.
Table 4 Record contribution as a percentali!e of the national (151only) and world productivity
lSI L1STA
No. of Total national 0/0 oftotal national 0/0 of total world LIS No. of 0/0 of total world output
records output output output (N = 15934) records (N=823199)
Algeria 5 8070 0.06 0.03 5 0.0006
Angola I 213 0.47 0.01 I 0.0001
Benin 7 2600 0.27 0.04 10 0.0012
Botswana 59 1770 3.33 0.37 92 0.0112
Cameroon 3 39 " 0.08 0.02 2 0.0002
Egypt 36 49709 0.07 0.23 21 0.0026
Ethiopia 25 4475 0.56 0.16 7 0.0009
Gabon I 1119 0.09 0.01 0 0.0000
Ghana 59 3155 1.87 0.37 68 0.0083
Ivory Coast I 386 0.26 0.01 0 0.0000
Kenya 37 12000 0.31 0.23 41 0.0050
Lesotho 3 226 1.33 0.02 6 0.0007
Libya 5 1335 0.37 0.03 I 0.0001
Malawi 5 1943 0.26 0.03 5 0.0006
Morocco 6 14355 0.04 0.04 I 0.0001
Namibia 8 910 0.88 0.05 10 0.0012
Nigeria 259 21261 1.22 1.63 196 0.0238
Senegal 5 2568 0.19 0.03 3 0.0004
Sierra Leone 2 300 0.67 0.01 16 0.0019
South Africa 439 94574 0.46 2.76 542 0.0658
Swaziland 29 671 4.32 0.18 12 0.0015
Tanzania 12 4788 0.25 0.08 23 0.0028
Tunisia 3 11845 0.03 0.02 2 0.0002
Uganda 10 2966 0.34 0.06 26 0.0032
Zambia 12 1868 0.64 0.08 16 0.0019
Zimbabwe 3 4931 0.06 0.02 21 0.0026
•
4.4 LIS research's
contribution to both the national and world output
As mentioned above, of the 53 African countries only 26 authored at least one LISrecord each between 1986 and 2006.
Further analysis of the lSI data, as shown in Table 4, indicates that South Africa's contribution accounted for a mere
0.46% of the total national output and 2.76% of the world's total LISoutput, while Nigeria's productivity accounted for
1.22% of the country's national output and 1.63% of the world's total LISoutput. Other findings were as follows, in the
order of percentage of the total national output and the world's total LIS output: Botswana (3.33%, 0.37%), Ghana
(1.87%,0.37%)
and Kenya (0.31%,0.23%).
It should be noted that the highest LISproducers in terms of the number of
LIS records (Le. South Africa, Nigeria, Botswana, Ghana, and Kenya) were not the leaders when their percentage
contribution to the total national output was considered. The highest national contribution was recorded by Swaziland
(4.32%). As regards L1STA,each country's contribution fell below 0.1%. The highest contribution was recorded by
South Africa (0.0658%) followed by Nigeria (0.0238%), Botswana (0.0 I 12%), Ghana (0.0083%), and Kenya (0.0050%)
as shown in Table 4.
4.5 Number of citations by African country
The data in Table 5 indicates that South Africa (498) received the highest number of citations, followed by Nigeria (232),
Egypt (92), Botswana (48), and Kenya (45). Other findings were as follows: Ghana (38), Ethiopia (37), Swaziland (33),
Tanzania (32) and Zambia (15). Four countries, namely Algeria, Angola, Sierra Leone and Tunisia received no citations for
the entire period of study.
Table 5
Total number of citations by year of publicationfor Africancountries, 1986-2006
South Africa 9 45 41 6 26 19 31 34 43 37 25 9 5 31 34 23 23 32 13 9 3 498
Nigeria 55 27 24 18 10 19 20 10 4 6 2 3 2 3 4 1 2 17 1 4 232
Egypt 2 2 3 11 2 38 2 10 2 8 2 5 2 3 92
Botswana 3 15 6 1 8 3 1 3 1 2 1 4 48
Kenya 4 3 3 2 3 1 1 9 4 2 9 4 45
Ghana 3 1 8 7 0 1 3 0 4 3 0 3 0 3 0 2 0 38
Ethiopia 4 3 3 1 4 11 4 2 3 1 1 37
Swaziland 15 3 8 3 1 2 1 33
Tanzania 1 1 27 1 2 32
Zambia 3 5 2 5 15
Senegal 5 3 8
Malawi 4 3 7
Morocco 4 1 1 6
Namibia 3 3 6
Zimbabwe 2 3 5
Uganda 1 2 1 4
Libya 2 1 3
Lesotho 1 1 2
Benin 1 1
Cameroon 1 1
Gabon 1 1
Ivory Coast 1 1
Algeria 0
Angola 0
Sierra 0
Tunisia 0
-D
"
co a- 0-
l"l..,
"t" Lrl -D
"
co a- 0-
l"l..,
"t" Lrl -Dl3
co co co co a- a- a- a- a- a- a- a- a- a- 0 0 0 0 0 0 0a- a- a- a- a- a- a- a- a- a- a- a- a- a- 0 0 0 0 0 0 0 t2
-
-
-
-
-
-
-
-
-
-
-
-
-
-
l"l l"l l"l l"l l"l l"l l"l4.6 Average number of citations per LIS record in each African country
Table 6 provides the average citations per record in each year by country. The Table reveals that Tanzania recorded the
highest average number of citations per record (Le. 2.7), followed by Egypt (2.6), Zimbabwe (1.7), Senegal (1.6), Ethiopia
( I.5), and Malawi (I .4). Others that recorded one or more citations per record were, in descending order: Zambia (1.3),
Kenya (1.2), South Africa (1.1), and Swaziland (1.1) while Gabon, Ivory Coast, and Morocco each yielded 1.0 citation per
record. Again, Algeria, Angola, Sierra Leone and Tunisia produced zero citations per record. Table 6 also indicates that,
other than South Africa, no country received citations continuously throughout the period of study.
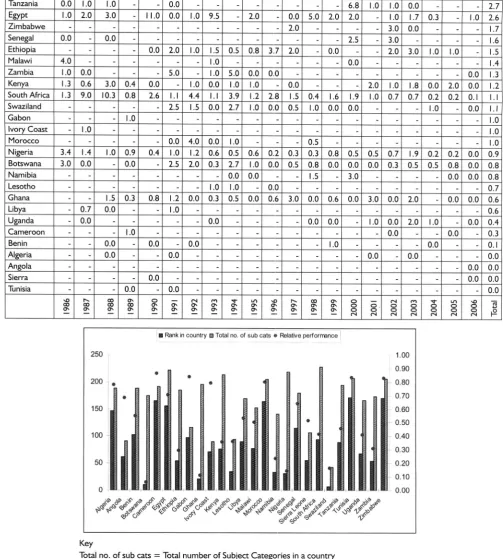
4.7 Rank and relative performance of LIS in each country
This section presents the rank distribution and relative performance of LIS in each African country by comparison with other subject areas of research in the respective countries. The data is reported in Figure 2. The rank distribution and relative performance ratio ofthe subject domain in each country was as follows: Algeria (146/188, rp=0.78), Angola (62/
91, rp=0.68). Benin (103/188, rp=0.55), Botswana (10/175, rp=0.06), Cameroon (165/191, rp=0.86). Egypt (156/222,
rp=0.70). Ethiopia (54/185, rp=0.29), Gabon (97/116, rp=0.84). Ghana (21/196, rp=O.1 I), Ivory Coast (71/90,
rp=0.79), Kenya (76/213, rp=0.36), and Lesotho (34/94, rp=0.36).
Table 6Average cites per record by African country and year of publication 1986-2006
Tanzania 0.0 1.0 1.0 - - 0.0 -
-
--
- - - - 6.8 1.0 1.0 0.0 - - - 2.7Egypt 1.0 2.0 3.0
-
11.0 0.0 1.0 9.5 - 2.0-
0.0 5.0 2.0 2.0 - 1.0 1.7 0.3 - 1.0 2.6Zimbabwe
-
- - - --
--
- - - 2.0 - - - - 3.0 0.0-
--
1.7Senegal 0.0 - 0.0 -
-
--
--
--
--
- 2.5 - 3.0 - --
- 1.6Ethiopia -
-
--
0.0 2.0 1.0 1.5 0.5 0.8 3.7 2.0 - 0.0 - - 2.0 3.0 1.0 1.0 - 1.5Malawi 4.0 -
-
- - - - 1.0 - - --
0.0-
- - --
-
1.4Zambia 1.0 0.0 - - - 5.0 - 1.0 5.0 0.0 0.0 - - - -
-
--
- - 0.0 1.3Kenya 1.3 0.6 3.0 0.4 0.0 - 1.0 0.0 1.0 1.0
-
0.0-
- - 2.0 1.0 1.8 0.0 2.0 0.0 1.2South Africa 1.3 9.0 10.3 0.8 2.6 1.1 4.4 1.1 3.9 1.2 2.8 1.5 0.4 1.6 1.9 1.0 0.7 0.7 0.2 0.2 0.1 1.1
Swaziland
-
--
- - 2.5 1.5 0.0 2.7 1.0 0.0 0.5 1.0 0.0 0.0 --
- 1.0 - 0.0 1.1Gabon - - - 1.0 - - - -
-
--
- - - --
- - - --
1.0Ivory Coast - 1.0 - - -
-
- --
- --
--
- 1.0Morocco
-
- - --
0.0 4.0 0.0 1.0 - - - 0.5-
- - - 1.0Nigeria 3.4 1.4 1.0 0.9 0.4 1.0 1.2 0.6 0.5 0.6 0.2 0.3 0.3 0.8 0.5 0.5 0.7 1.9 0.2 0.2 0.0 0.9
Botswana 3.0 0.0
-
0.0-
2.5 2.0 0.3 2.7 1.0 0.0 0.5 0.8 0.0 0.0 0.0 0.3 0.5 0.5 0.8 0.0 0.8Namibia - - - -
-
--
- 0.0 0.0 --
1.5 - 3.0 - --
- 0.0 0.0 0.8Lesotho - - -
-
- 1.0 1.0 - 0.0 - --
- --
- --
- 0.7Ghana - - 1.5 0.3 0.8 1.2 0.0 0.3 0.5 0.0 0.6 3.0 0.0 0.6 0.0 3.0 0.0 2.0 - 0.0 0.0 0.6
Libya - 0.7 0.0 -
-
1.0 - - --
- - --
-
- 0.6Uganda - 0.0 - - - -
-
0.0 --
- - 0.0 0.0 - 1.0 0.0 2.0 1.0 - 0.0 0.4Cameroon
-
- - 1.0 - - --
0.0 - - 0.0 - 0.3Benin - - 0.0 - 0.0
-
0.0 --
- --
- 1.0 - - - - 0.0 - - 0.1Algeria -
-
0.0 --
0.0 --
- - --
--
-
0.0 - 0.0-
- - 0.0Angola -
-
--
- - --
- --
- - --
- - 0.0 0.0Sierra - -
-
-
0.0 - - - --
- --
- - --
- - - 0.0 0.0Tunisia - - - 0.0
-
0.0 - --
- - --
- --
- - - --
0.0-.0 r-- co 0- 0
-
t'l M -.r VI -.0 r-- co 0- 0 - t'l M -.r VI -.0 "iii co co co co 0- 0- 0- 0- 0- 0- 0- 0- 0- 0- 0 O. 0 0 0 0 0 •... 0--
0--
-
0--
0- 0--
-
0--
0- 0--
0---
0--
0- 0--
-
0- 0- 0 0 0 0 0 0 0~
-
t'l t'l t'l t'l t'l t'l t'lI.
Rank in count;Yo Total no. of sub cats. Relative perforrrance I250
I
200
i.
150
100
•
•
•
•
•
1.00
T
0.90~ 0.80
. 0.70
I r 0.60
L 0.50
I
0040~ 0.30
t
0.20 ~ 0.10 - 0.00Key
Total no. of sub cats =Total number of Subject Categories in a country
Rank in country = Rank of LIS in each country relative to other subject areas of research
Relative performance = Ratio of rank of LIS to a country's total number of subject categories
Others are: Libya (90/169, rp=0.53), Malawi (77/153, rp=0.50), Morocco (164/205, rp=0.80), Namibia (33/141,
rp=0.23), Nigeria (31/219, rp=0.14), Senegal (115/180, rp=0.64), Sierra Leone (55/107, rp=0.51), South Africa (94/228,
rp=OAI), Swaziland (7/43, rp=0.16), Tanzania (89/195, rp=OA6), Tunisia (172/207, rp=0.83), Uganda (68/166,
rp=OAI), Zambia (54/174, rp=0.31) and Zimbabwe (171/206, rp=0.83). Fig 2 provides this distribution in graphic form.
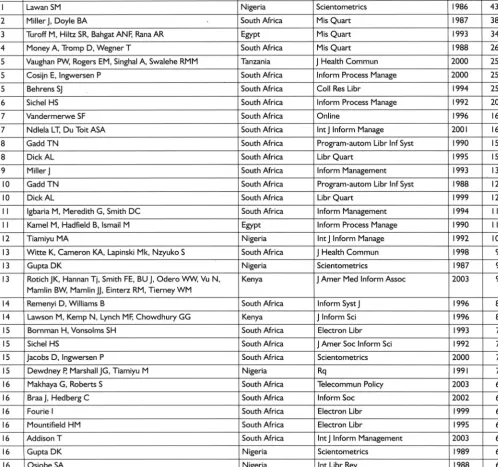
4.8 Most cited LIS records
The 'TC' (i.e. Total Cites) field tag was used to identify the most cited records in Africa. Table 7 provides the records which had received 6 or more citations at the time of conducting this study (i.e. April 2007). They include, in descending order: Lawan SM (43), Miller
J
& Doyle BA (38), Turoff M, Hiltz SR, Bahgat ANF & Rana AR (34), and Money A, Tromp D&
Wegner T (26) while the records authored by Vaughan PW, Rogers EM, Singhal A&
Swalehe RMM and Cosijn E&
Ingwersen P received 25 citations apiece. Also evident from Table 7 is the dominance of South Africa as one of the top most cited countries. Out of the top 34 most cited records, 23 (67.6%) originated from South Africa while Nigeria yielded 6 (17.6%) followed by Egypt and Kenya which produced 2 (5.9%) each and Tanzania (I, 2.9%).Table 7Most cited LIS records
Rank Author(s) Country Journal Year TC
I Lawan SM Nigeria Scientometrics 1986 43
2 Miller J, Doyle BA South Africa Mis Quart 1987 38
3 Turoff M, Hiltz SR, Bahgat ANF, Rana AR Egypt Mis Quart 1993 34
4 Money A, Tromp D, Wegner T South Africa Mis Quart 1988 26
5 Vaughan PW, Rogers EM, Singhal A, Swalehe RMM Tanzania J Health Commun 2000 25
5 Cosijn E, Ingwersen P South Africa Inform Process Manage 2000 25
5 Behrens SJ South Africa Coli Res Libr 1994 25
6 Sichel HS South Africa Inform Process Manage 1992 20
7 Vandermerwe SF South Africa Online 1996 16
7 Ndlela LT, Du Toit ASA South Africa Int J Inform Manage 2001 16
8 Gadd TN South Africa Program-autom Libr Inf Syst 1990 15
8 DickAL South Africa Libr Quart 1995 15
9 MillerJ South Africa Inform Management 1993 13
10 Gadd TN South Africa Program-autom Libr Inf Syst 1988 12
10 DickAL South Africa Libr Quart 1999 12
II Igbaria M, Meredith G, Smith DC South Africa Inform Management 1994 II
II Kamel M, Hadfield B, Ismail M Egypt Inform Process Manage 1990 II
12 Tiamiyu MA Nigeria Int J Inform Manage 1992 10
13 Witte K, Cameron KA, Lapinski Mk, Nzyuko S South Africa J Health Commun 1998 9
13 Gupta DK Nigeria Scientometrics 1987 9
13 Rotich JK, Hannan Tj, Smith FE, BU J, Odero WW, Vu N, Kenya J Amer Med Inform Assoc 2003 9
Mamlin BW, Mamlin JJ, Einterz RM, Tierney WM
14 Remenyi D, Williams B South Africa Inform Syst J 1996 8
14 Lawson M, Kemp N, Lynch MF, Chowdhury GG Kenya J Inform Sci 1996 8
15 Bornman H, Vonsolms SH South Africa Electron Libr 1993 7
15 Sichel HS South Africa J Amer Soc Inform Sci 1992 7
15 Jacobs D, Ingwersen P South Africa Scientometrics 2000 7
15 Dewdney P,Marshall JG, Tiamiyu M Nigeria Rq 1991 7
16 Makhaya G, Roberts S South Africa Telecommun Policy 2003 6
16 Braa
J,
Hedberg C South Africa Inform Soc 2002 616 Fourie I South Africa Electron Libr 1999 6
16 Mountifield HM South Africa Electron Libr 1995 6
16 Addison T South Africa Int
J
Inform Management 2003 616 Gupta DK Nigeria Scientometrics 1989 6
16 Osiobe SA Nigeria Int Libr Rev 1988 6
4.9 Cited ness and/or uncitedness of LIS records
Table 8 provides the total number of cited and uncited records in each African country. There were a total of 308 uncited records in South Africa, accounting for 70. 16% of the total LIS records produced by LIS researchers in the country. The
data in Table 8 further reveals that out of Nigeria's 259 records, 109 (42.08%) were cited while 150 (57.92%) were uncited. Botswana yielded 22 (37.29%) cited and 37 (62.71 %) uncited records while Ghana's uncited records totaled 38 (64.41 %). Most of the countries (e.g. South Africa, Nigeria, Botswana, Ghana, Kenya, Swaziland, Zambia, Uganda, Namibia, Benin, and Algeria) recorded more uncited than cited records. Other countries such as Egypt, Ethiopia, and Tanzania produced more cited than uncited records.
Table 8Citedness and/or uncitedness of LISrecords
Cited records %of total Uncited records %of total TOTAL
South Africa 131 29.84 308 70.16 439
Nigeria 109 42.08 150 57.92 259
Botswana 22 37.29 37 62.71 59
Ghana 21 35.59 38 64.41 59
Kenya 14 37.84 23 62.16 37
Egypt 19 52.78 17 47.22 36
Swaziland 13 44.83 16 55.17 29
Ethiopia 19 76.00 6 24.00 25
Tanzania 7 58.33 5 41.67 12
Zambia 5 41.67 7 58.33 12
Uganda 3 30.00 7 70.00 10
Namibia 2 25.00 6 75.00 8
Benin I 14.29 6 85.71 7
Morocco 3 50.00 3 50.00 6
Algeria 0 0.00 5 100.00 5
Libya 2 40.00 3 60.00 5
Malawi 3 60.00 2 40.00 5
Senegal 3 60.00 2 40.00 S
Cameroon 1 33.33 2 66.67 3
Lesotho 2 66.67 I 33.33 3
Tunisia 3 100.00 0 0.00 3
Zimbabwe 2 66.67 1 33.33 3
Sierra Leone 2 100.00 0 0.00 2
Angola 0 0.00 1 100.00 I
Gabon I 100.00 0 0.00 I
Ivory Coast 1 100.00 0 0.00 I
4.10 Productivity and impact of research in LIS and selected social sciences
Table 9
Productivity and impact of research in LISand other social sciencesECON ANTH EDU LIS GEOG POL-SCI SOC HIS LING
1986-1990 Records 328 301 264 192 163 105 102 68 42 Cites 858 1764 805 307 446 166 350 70 140 Av cites 2.62 5.86 3.05 1.60 2.74 1.58 3.43 1.03 3.33
1991-1995 Records 325 265 230 260 102 135 100 117 44 cites 932 2079 863 366 321 172 658 133 138
Av cites 2.87 7.85 3.75 1041 3.15 1.27 6.58 1.14 3.14
1996-2000 Records 381 265 248 166 101 144 116 83 20 cites 1130 1387 694 214 346 182 333 54 65 Av cites 2.97 5.23 2.80 1.29 3.43 1.26 2.87 0.65 3.25
2001-2006 Records 609 415 466 374 163 154 158 126 15 cites 951 ' 1019 337 191 391 90 169 29 7
Av cites 1.56 2046 0.72 0.51 2040 0.58 1.07 0.23 0047
TOTAL Records 1643 1246 1208 992 529 538 476 394 121 Cites 3871 6249 2699 1078 1504 610 1510 286 350 Av Cites 2.36 5.02 2.23 1.09 2.84 1.13 3.17 0.73 2.89
Key
ECON = Economics ANTH = Anthropology
EDU = Education &Educational research LIS= Information Science & Library Science GEOG= Geography
POL-SCI= Political Science SOC = Sociology
HIS=History
L1NG= Applied Linguistics Av Cites= Average cites per record
•
5. Discussion and conclusions
Worldwide, and as shown in Table 2, productivity of LIS publications appears constant, implying a steady output. However, there were several instances during which productivity reduced by large margins, for example between 1999 and 2000 (lSI), and between 1996 and 1997 (L1STA). Equally important were the instances during which research output leapt by almost similar margins to the drops during reductions, e.g. between 1990 and 1991 (lSI) and between 2002 and 2003 (L1STA). It is difficult to speculate what factors underlie such patterns of productivity. Nevertheless, the patterns do show that LIS authors are not consistent in terms of their research activities, Le. productivity or publication. Whether this could perhaps be attributed to financial or time constraints could not be substantiated from the data. It would be interesting to determine the cause of the pattern witnessed in this study, and subsequently recommend areas of improvement.
A trend in keeping with the above was witnessed in Africa, whereby South Africa emerged the most productive country. While various researchers (e.g. Alabi and Saracevic in Jacobs, 2000) have noted a tremendous growth in scientific activities in most third world countries, LIS research has generally remained low in Africa, as indicated by each country's LIS research output from the perspective of national and world research output. Some of the factors that have been said to influence or affect productivity in Africa include lack of funds and basic facilities, the intellectual and physical isolation of researchers, insufficient personnel to run programs, fragmentation of effort in research, lack of vision and direction by the governments of Africa, and the poor self-image of the region in basic research (Mweene, n.d.).
A comparison of productivity in each African country indicates that South Africa and Nigeria produced over 70% of the total LIS research output in Africa (Le. 992). The remaining countries (which are the majority, Le. 24) produced a mere 30% of Africa's total LIS research output. Previous studies (e.g. (Narvaez-Berthelemont, Russell, Arvanitis, Waast, & Gaillard, 200 I) produced similar results. Generally, South Africa's dominance in terms of research output in Africa, especially in the post apartheid era, has also been acknowledged in other studies (e.g. Jacobs, 2002). The high research output by the two countries could be attributed to several factors, chief among them being the countries' research policies. Whereas Nigeria's research policy is not clear to the author, South Africa regards research highly, and has therefore put in place a number of mechanisms that enhance research output. For instance, the government, through the Ministry of Education, provides subsidies for every research paper/article that is published in an accredited journal by researchers in institutions of higher learning in the country. The generated funds are split between the author's university of affiliation, the department that he/she works for, and the individual author. This incentive may have contributed to the high pattern of productivity witnessed in this and other studies.
Additionally, the number of LIS schools and researchers in each country may influence productivity. South Africa boasts the largest number of university LIS schools/departments (Le. 15) followed by Nigeria (7), Kenya (3), Sudan (2), and Tanzania (2) while Botswana, Cameroon, Democratic Republic of Congo, Ethiopia, Ghana, Malawi, Namibia, Senegal, Sierra Leone, Uganda, Zambia and Zimbabwe have one LIS school/department each (Minishi-Majanja
&
Ocholla, 2004). There was no data offering the number of LIS schools in Arabic countries. Notably, despite the fact that there are two LIS schools in Sudan, there were no LIS records produced by that country as indexed and reflected in lSI's databases. A search of ~F=Sudan' in L1STA,however, produced three records. Other factors that may influence productivity are the number of scholarly journals that are published in a country. According to the Urlich Periodical Directory (accessed on 12thJune 2007) Nigeria and South Africa publish a total of 204 and 483 academic/scholarly publications, respectively. In comparison, Botswana, Ghana and Kenya produce 9, 30 and 71 academic/scholarly publications. It was not possible, however, to ascertain the LIS-specific journals that are published in these countries. It was noted that none of the L1S-specific journals which are published in the African countries investigated are indexed in lSI databases.Further research is therefore recommended to study the influence of the number of LIS schools/departments and researchers (including such personal characteristics of researchers as age, academic qualifications, etc) on productivity. Another notable observation was the dismal performance of Northern Africa's countries. This may be attributed to the language factor. The lSI prefers indexing records that are published in English, and whenever a paper is prepared in any other language, the institute requires that an English language version should be provided. This limits its coverage of records that are published in any other languages, including those written in Arabic or other African languages.
Concerning the number of citations, South Africa led with 498 citations, followed by Nigeria (232). Again, the two countries' combined productivity exceeded the sum total of the rest of the countries, numbering 24. There were four countries (i.e. Algeria, Angola, Sierra Leone and Tunisia) that did not receive citations. It should be noted, however, that these countries were among the least productive in terms of the total number of records. This does not, however, mean that the more the number of records a country produces, the higher the number of citations it is likely to receive. It simply means that high research productivity may result in a higher number of citations in a country since a country with such high productivity may have more chances of receiving more citations than a country with low research productivity.
In terms of the impact of LIS research, which was measured by the average citations per record, it was noted that less productive countries dominated the top positions of countries with the highest average citations per record. These in-cluded Tanzania, whose 12 records generated 2.7 citations per record. Others in this category include Zimbabwe, Sene-gal and Malawi and Zambia. A comparison was also made between the number of cited and uncited records in order to determine the extent of the influence and visibility of LIS research conducted in Africa. It was observed that most records, especially in the most productive countries, remained uncited. Whether the low average citations per record and uncit-edness of LIS records implies poor quality, non-visibility, or the low impact of African LIS research is difficult to tell, be-cause cited ness and/or citation impact factors do not always indicate quality (Garfield, 1993; Seglen, 1997). Nevertheless, further research should be conducted to ascertain the factors that contribute towards the uncitedness of LIS research records and thereby recommend solutions.
The ranking and relative performance of LIS in each of the 26 countries as shown in Fig 2 demonstrated that the subject domain ranked poorly in most countries, while its relative performance was found equally wanting. The best performance was reported in Botswana where LIS was ranked number 10 out of a total of 175 subject categories in which research was conducted, thus producing the performance ratio of 0.06. This may indicate that LIS is not a highly prioritized area of research in a given country especially in situations where governments influence research output, particularly in situations where the governments commission and fund research. Other factors that may explain the poor ranking of LIS may include the following:
• LIS researchers may be fewer than researchers from other disciplines that are performing well.
• LIS research is largely conducted at institutions of higher learning, unlike research in pure sciences which is conducted at both industry level and within institutions of higher learning
• LIS research is largely basic research while research in pure sciences is mainly applied or action research hence the need for the industry and other stakeholders to invest in the latter.
•
•
each other of the current LIS publications through, for example, listservs and e-mail alerts, may bring about awareness of current and ongoing research in the domain of LIS research in Africa, thus improving the visibility or impact of LIS research.
6. Declaration and acknowledgement
Versions of this paper were presented at the World Library and Information Congress: 73rd IFLA General Conference and Council, 19-23 August, Durban, South Africa (see http://ifla.org/IV/ifla73papers/132-0nyancha-en.pdf).
References
Aina, L.O. (1999). Research and publication patterns in library and information science. Information Development, 15(2): I 14-1 19 Aina, L. O. (2002). African Journal of Library, Archives and Information Science' as a resource base for library and information
science research in Africa.African journal ofLibrary, Archives &Information Science, 12(2): 167-175 Aina, L. O.& Mabawonku, I. M. (1997). The Literature of the Information Profession in
Anglophone Africa: Characteristics, Trends and Future Directions.journal ofInformation Science, 25 (2) 32 1-326.
Aina, L. O. & Mooko, N. P. (1999). Research and publication patterns in library and information science. Information Develop-ment, 15(2): 1/4-/19
Alemna, A A (1996). The Periodical Literature of Library and Information Science in Africa: 1990- 1995. International Information and Library Review, 28(2):93- 103.
Alemna, A A (200 I). The periodical literature of library and information in Africa: 1996-2000. Information Development; December 200 I, Vol. 17 Issue 4, p257-261, 5p
Cano, Y. (1999). Bibliometric overview of library and information science research in Spain.journal ofthe American Society for Information Science, 50(8):675-680
Crawford, G. A (1999). The Research Literature of Academic Librarianship: A Comparison of College &Research Libraries and journal
of
Academic Librarianship. College &Research Libraries, 224-230Garfield, E. (1993). New Scientist examines AIDS research with lSI 's citation data. Current Contents, 27,3-12
He, S. Y.,& Spink, A (2002). A comparison of foreign authorship distribution in JASIST and the Journal of Documentation. journal ofthe American Society for Information Science and Technology, 53( II ):953-959.
Jacobs, D. (2000). Institutional status, funding and grading in relation to faculty research productivity. Progress in Library and Information Science inSouthern Africa: proceedings ofthe first biennial DISSAnet conference, 143-153. Glenstantia: Infuse Jacobs, D. (2002). Scientometrics of genetic research and development in South Africa, 1990-200 I. In: T. Bothma &A Kaniki
eds. Progress in Library and Information Science in Southern Africa: proceedings ofthe second biennial DISSAnet conference, 93-103. Glenstantia: Infuse
Kadiri, J. (200 I). Library literature in Ghana, 1950-1994. African journal ofLibrary, Archives &Information Science, I 1(2):89-95 Lancaster, F.W.(1991). Bibliometric methods in assessing productivity and impact ofresearch. Bangalore: Sarada Ranganathan
En-dowment for Library Science.
Lipetz, B. A (1999). Aspects of JASIS authorship through five decades. journal ofthe American Society for Information Science, 50( I I), 994-1003.
Mabawonku, I. (200 I). Trends in Library and Information Science Research in Africa, 1991 -2000. African journal ofLibrary, Ar-chives, and Information Science, I 1(2):79-88
Mchombu, K.J. (2002). Which way information sciences research in Africa? In: T. Bothma &A Kaniki eds. Progress in Library and Information Science in Southern Africa: proceedings ofthe second biennial DISSAnet conference, 93-103. Glenstantia: Infuse Minishi-Majanja, M. K. & Ocholla, D. N. (2004). Auditing of information and communication technologies in library and
information science education in Africa. Education for Information, 22: 187-221
Moahi, K.H. (2002). Information science research in Southern Africa: are we making our mark? In: T. Bothma &A Kaniki eds. Progress in Library and Information Science in Southern Africa: proceedings ofthe second biennial DISSAnet conference, 93-103. Glenstantia: Infuse
Mweene, H.Y. (n.d). Basic science research: The case for a regional approach. Retrieved April I, 2003, from http://
www.iitap.iastate.edu/reports/stafrica/HabatwaDARed.html
Narvaez-Berthelemot, N., Russell, J. M., Arvanitis, R., Waast, R., & Gaillard, J. (200 I). Science in Africa: An overview of mainstream scientific output. In: M. Davis & C. S. Wilson (eds.). Proceedings of the 8th International Conference on Scientometrics and Informetrics, Sydney, July, 16-20,2,469-476.
Ocholla, D. N. (2000). Research capacity in library and information science in South Africa - an overview. Paper delivered at the 66th IFLA Council and General Conference, Jerusalem, Israel, 13th-18th August. Retrieved April 4, 2002, from http://
www.if/a.org/IV/if/a66/papers/054-127e.htm.
Raptis, P.(1992). Authorship characteristics in five international library science journals. Libri, 42:35-52.
Seglen P. O. (1997). Why the impact factor of journals should not be used for evaluating research. British Medical journal, 314:498-502 .
Siddiqui, M. A (1997). A bibliometric study of authorship characteristics in four international information science journals. International Forum on Information and Documentation, 22(3): 3-23.
Tiew, WS., Abdullah, A, &Kaur, K. (2002). Malaysian Journal of Library and Information Science, 1996-2000: A bibliometric study.Malaysian journal ofLibrary and Information Science, 6(2):43-56.
Uzun, A (2002). Library and information science research in developing countries and Eastern European countries: A brief bib-liometric perspective. International Information and Library Review, 34:21-33.
Wallace, D. P. (1989). Bibliometrics and citation analysis. In: Principles and Applications of Information Science for Library Professionals. Chicago: American Library Association, 10-26.
Appendix A: Distribution of records by document type
Article Book Editorial Meeting Note Letter Review Item about Reprint Bibliography Discussion News
Country review material abstract individual
South Africa 231 139 34 13 8 7 5 I I
Nigeria 231 8 2 10 4 2 I I
Botswana 53 4 I I
Ghana 53 2 3 I
Kenya 27 4 5 I
Egypt 34 I I
Swaziland 25 2 I I
Ethiopia 23 I I
Tanzania II I
Zambia 12
Uganda 9 I
Namibia 7 I
Benin 6 I
Morocco 5 I
Algeria 5
Libya 2 2 I
Malawi 3 I I
Senegal 3 2
Cameroon 2 I
Lesotho 3
Tunisia I I I
Zimbabwe 3
Sierra Leone 2
Angola I
Gabon I