Abstract—The effectiveness of Fenton’s reagent (H2O2/Fe2+) for chemical oxidation of the organic content of wastewater generated from a textile industry has been studied. The oxidative agent generates reactive hydroxyl radical species which degrades the reactive dye under study: Remazol brilliant orange 3RID (RBO3RID). The experimental results indicate that the oxidation process leads to a reduction in the chemical oxygen demand (COD) concentration up to 97%. Response surface methodology was used to optimize three different process variables: COD to Hydrogen peroxide ratio, Hydrogen peroxide-to-Fe (II) ratio and time. Analysis of variance (ANOVA) showed a high coefficient of determination value (R2=0.997). Effect of experimental parameters on the COD removal efficiency of RBO3RID was established by the response surface and contour plots. Results showed that COD removal increases with increasing oxidation time and initial Fe2+ concentration.
Index Terms—Fenton’s oxidation, reactive dye, response surface methodology, optimization.
I. INTRODUCTION
Among the several types of dyes used worldwide, reactive azo dyes are frequently used for dyeing cotton and other cellulose fibers. The covalent bonds that attach reactive dyes to natural fibers make them among the most permanent of dyes [1]. More than 10% of dyestuff used during the coloring processes does not bind to the fibers and therefore these excess dyes are released into the environment producing serious environmental pollution. The presence of these dyes in wastewater and subsequently in water resources, even at very low concentrations, is easy to observe visually as the result of textile industry activities. They may increase effluent toxicity and lead to environmental damage [2], [3].
Several treatment options are available for the degradation of dyes before their discharge like coagulation, flocculation, activated sludge process, advanced oxidation processes etc. Among all the processes stated above, advanced oxidation processes (AOPs) stand out to be better treatment method than the rest [4], [5]. The main advantage of AOPs over other biological, physico-chemical and classical chemical processes are their pronounced destructive nature leading to complete mineralization of the
Manuscript received November 9, 2014; revised January 20, 2015. Suvanka Dutta, Ananya Ghosh, Sankar Chandra Moi, and Rajnarayan Saha are with the Department of Chemistry, National Institute of Technology, Durgapur-713209, West Bengal, India (e-mail: [email protected]).
pollutants present in wastewater. AOPs generate less sludge and involve short-lived chemical species with high oxidation power [6]. In these processes, hydroxyl radicals (.OH) generated from different sources like H2O2 and ozone in presence of catalysts (Fe2+, Ce4+, Ti4+ etc.) and H2O2/O3 in presence of UV light. Photocatalysts (TiO2, ZnO and different metal doped photocatalysts) in presence of UV light is also used in AOP’s.
An old yet effective method among the AOPs is the use of Fenton’s reagent for the degradation process. This method which involves generation of reactive oxygenated species from H2O2 in presence of ferrous catalyst is a fast and commercial way to deal with harmful organic contaminants in a green manner. In this process, H2O2 is decomposed catalytically by Fe2+ in the pH range of 3-3.5, giving rise to hydroxyl radicals [7]. Oxidation by H2O2 alone is not effective for high concentrations of certain refractory contaminants, such as highly chlorinated aromatic compounds and inorganic compounds (e.g. cyanides), because of low rates of reaction at reasonable H2O2 concentrations. Transition metal salts (e.g. iron salts), ozone and UV-light can activate H2O2 to form hydroxyl radicals which are strong oxidants [8].
Iron (II) is oxidized by hydrogen peroxide to iron (III), forming a hydroxyl radical and a hydroxide ion in the process. Iron (III) is then reduced back to iron (II) by another molecule of hydrogen peroxide, forming a hydroperoxyl radical and a proton. The net effect is a disproportionation of hydrogen peroxide to create two different oxygen-radical species, with water (H+ + OH–) as a byproduct. The chemical equation which is followed during the reaction is as follows:
Fe2+ + H2O2 → Fe3+ + •OH + OH– (a)
Fe3+ + H2O2 → Fe 2+
+ •OOH + H+ (b)
The generated free radicals attack C-H bond of organic molecules and initiates several chain reaction.
RH + OH.→ R.+ H2O (c)
RH + 2OOH.→ ROO.+ RO.+ H2O (d)
ROO.+ RH → ROOH + R (e).
RO. + RH → ROH + R (f)
2ROO.→ ROOR+ O2 (g)
These reactions generate organic radicals and other free
Application of Response Surface Methodology for
Optimization of Reactive Azo Dye Degradation Process
by Fenton’s Oxidation
radicals, which in turn initiate the chain reactions of dye degradation. Various types of textile dyes and other organic contaminants have been degraded completely into nontoxic end products (carbon dioxide and water) using this reagent, in a short span of time [9]-[12].
Conventionally, wastewater treatments, like many other industrial processes are optimized by using singular variation of treatment variables. Moreover, this method assumes that various treatment parameters do not interact and that the response variable is only function of the single varied parameter. However, the response obtained from a waste treatment method for example, results from the interactive influences of the different variables. When a combination of several independent variables and their interactions affect desired responses, response surface methodology (RSM) is an effective tool for optimizing the process [13]. RSM uses an experimental design such as the central composite design (CCD) to fit a model by least squares technique [14]. Adequacy of the proposed model is then revealed using the diagnostic checking tests provided by analysis of variance (ANOVA). The response surface plots can be employed to study the surfaces and locate the optimum. In several industrial processes, RSM is almost routinely used to evaluate the results and efficiency of the operations [15], [16]. In the present work, a CCD in the form of a 23 full factorial design was used to develop mathematical equations, in terms of the pollutant removal, providing quantitative evaluation of the Fenton process used to oxidatively treat RBO3RID dye solution. In this evaluation, COD to Hydrogen peroxide ratio, Hydrogen peroxide-to-Fe (II) ratio and treatment time as the key parameters affecting the decomposition performance of the Fenton’s reagent were studied.
II. METHODS
A. Materials and Analytical Methods
TABLEI:DETAILS OF THE REACTIVE DYE
Dye Chemical structure
Remazol Brilliant
Orange 3RID(RBO
3RID)
C20H17N3Na2O11S3
λmax = 492 nm
MW = 617.54 CI No. 17757
CAS No.2225-83-1
Remazol Brilliant Orange 3RID (RBO3RIB) dye was obtained from Colour Chem limited (Clariant), Mumbai and used without further purification. A detail specification of the dye is given in Table I. Commercial grade 50% Hydrogen peroxide (H2O2) was used. Reagent grade Ferrous Sulfate (FeSO4, 7H2O) brought from Merck India.
Chemical oxygen demand (COD) was estimated by closed reflux, titrimetric method [17]. Hydrogen peroxide was estimated by iodometric method [18]. COD removal efficiency was calculated by the following formula:
0
0 ( %)C Ct100 COD RE
C (1)
B. Experimental Design
Fenton’s oxidation experiments were carried out batch wise in a 1 L Borosil beaker with continuous stirring (430 rpm) at room temperature. 1 litre synthetic waste water containing 500 mg/L dye was taken for batch oxidation with various H2O2 and FeSO4 dosages at adjusted pH of 3-3.5 by adding dilute sulfuric acid. Samplings were done at different intervals as specified by the Design expert software for chemical analysis.
TABLEII:CODED VARIABLES FOR RESPONSE SURFACE METHODOLOGY
Variables Factor Range and Level -1 +1 -α +α
x1 COD:H2O2
(wt:wt)
0.3 0.8 0.129 0.97
x2 H2O2:Fe2+
(molar ratio)
0.03 0.08 0.013 0.097
x3 Time (min) 28 93 5.84 115.16
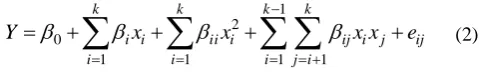
In this study, RSM was used for the optimization of process variable to enhance the degradation of RBO3RID dye combined with the factorial experimental design of CCD. RSM is a useful method for studying the effect of several variables influencing the responses by varying them simultaneously and carrying out a limited number of experiments. The experimental results were analyzed using Design Expert7, and the regression model was proposed. In order to evaluate the influence of operating parameters on the COD removal efficiency of the dyes, 3 independent variables were chosen: COD to Hydrogen peroxide ratio(x1), Hydrogen peroxide-to-Fe(II) ratio (x2) and time (x3)of dye solution. Accordingly, the CCD matrixes of 20 experiments covering the full design of 3 factors were used for building quadratic models as shown inTable II. This point includes 23=8 cube points, 2×3=6 axial points and 6 replications at the center point. A second order polynomial response equation (Equation 2) can be proposed to correlate the dependent and independent variables. Where Y is the predicted response, k is the number of factors, xi and xjare
the coded variables; β0 is the offset term; βi, βj, and βij are
the first-order, quadratic, and interaction effects respectively; i and j are the index numbers for factor; and eij
is the residual error[19].
1 2 0
1 1 1 1
k i i
k ii i
k k ij i j
ij i i i j iY
x
x
x x
e
(2)The quality of the polynomial model was expressed by the coefficient of determination, namely, R2 and Adj-R2. The statistical significance was verified with adequate precision ratio and by the F test [20].
III. RESULT AND DISCUSSION
A. Optimization of Experimental Conditions for COD
Removal by Response Surface Methodology
an average of the duplicate experimental results at each operating condition shown in Table II. Those already selected operational variables (x1, x2 and x3) may affect the efficiency of the Fenton process. The experimental response chosen to analyze the results was the percent of COD removal efficiency. A second order model, typical for response surface Eq.(2), in terms of the coded variables xi,
was reduced to the form of Eq.(3) based on the experimental results describing the COD removal by Fenton oxidation. The statistical analysis showed that all the variables set in the preparation of the model, within its tested boundaries, had significant effect on it. In addition, the cross term x1x3 and the quadratic term x2 x3 were also found to be statistically significant. The results show that the ratio
[COD]: [H2O2] was the most significant factor in the Fenton oxidation of dye degradation, followed by the ratio [H2O2]: [Fe2+] and time.
1 2
3 1 2 1 3 2 3
2 2 2
1 2 3
( %) 6 0.011 0.72
1.62 0.32 0.19 0.43
1.02 0.012 0.032
COD RE x x
x x x x x x x
x x x
(3)
B. Analysis of Variance
Analysis of variance (ANOVA) values for the quadratic regression model obtained from CCD employed in the optimization of dye degradation are listed in Table III.
TABLEIII:THREE FACTOR CENTRAL COMPOSITE DESIGN AND EXPERIMENTAL RESULTS
Run Experimental design Experimental plans Actual COD RE% Square root transformed COD RE% COD:H2O2 (wt:wt) H2O2:Fe2+ (molar ratio) time X1 X2 X3 actual predicted
1 0 0 -1.682 0.55 0.06 5.84 5.08 2.25 2.38
2 1 -1 1 0.80 0.03 93.00 52.57 7.25 7.29
3 1.682 0 0 0.97 0.06 60.50 78.78 8.88 8.89
4 0 -1.682 0 0.55 0.01 60.50 22.1 4.70 4.76
5 0 0 0 0.55 0.06 60.50 35.26 5.94 6.00
6 0 1.682 0 0.55 0.10 60.50 52.13 7.22 7.18
7 0 0 0 0.55 0.06 60.50 39.31 6.27 6.00
8 1 1 -1 0.80 0.08 28.00 27.77 5.27 5.25
9 -1 -1 -1 0.30 0.03 28.00 18.58 4.31 4.26
10 1 -1 -1 0.80 0.03 28.00 29.1 5.39 5.30
11 -1 -1 1 0.30 0.03 93.00 49.14 7.01 7.02
12 -1 1 -1 0.30 0.08 28.00 30.57 5.53 5.48
13 0 0 0 0.55 0.06 60.50 34.48 5.87 6.00
14 0 0 0 0.55 0.06 60.50 36.82 6.07 6.00
15 -1.682 0 0 0.13 0.06 60.50 78.42 8.8 8.86
16 1 1 1 0.80 0.08 93.00 79.47 8.91 8.95
17 0 0 1.682 0.55 0.06 115.16 62.77 7.92 7.82
18 0 0 0 0.55 0.06 60.50 36.03 6.00 6.00
19 0 0 0 0.55 0.06 60.50 34.47 5.87 6.00
20 -1 1 1 0.30 0.08 93.00 97.34 9.87 9.95
TABLEIV:ANALYSIS OF VARIANCE (ANOVA) FOR FIT OF COD REMOVAL EFFICIENCY FROM CENTRAL COMPOSITE DESIGN
Source Sum of Squares
Degrees of freedom
Mean
Square F Value
p-value Prob> F
Model 62.86 9 6.98 406.67 < 0.0001 x1-COD:
H2O2 1.601E-003 1
1.601E-003 0.093 0.7664 x2-H2O2:
Fe2+ 7.11 1 7.11 413.68 < 0.0001
x3-time 35.67 1 35.67 2076.86 < 0.0001
x1x2 0.80 1 0.80 46.78 < 0.0001
x1x3 0.29 1 0.29 17.16 0.0020
x2x3 1.47 1 1.47 85.44 < 0.0001
x12 14.86 1 14.86 865.07 < 0.0001
x22 1.981E-003 1
1.981E-003 0.12 0.7411 x32 1.48 1 1.48 85.98 < 0.0001
Residual 0.17 10 0.017 Lack of
Fit 0.058 5 0.012 0.50 0.7647
As the response ranges from 5.08 to 97.34, the max to
oxidation process. Also, an acceptable agreement with the adjusted determination coefficient is necessary. In this study, the Adj-R2 value of 99.48% was found. The values of R2 and Adj-R2 are close to1.0, which is very high and advocates a high correlation between the observed values and the predicted values. This indicates that the regression model provides an excellent explanation of the relationship between the independent variables and the response. The diagnostic plots given in Fig. 1 and Fig. 2 were used for estimating the adequacy of the regression model.
The actual and predicted COD removal efficiency percentage is given in Fig. 1. The graph shows there are tendencies in linear regression fit, and the model adequately explains the experimental range studied. The actual COD removal percentage value is the measured result for a specific run, and the predicted value is evaluated from the independent variables in the CCD model. The predicted COD RE% and studentized residual plot are shown in Fig. 2.
Fig. 1. The actual and predicted COD removal efficiency.
Fig. 2. The predicted COD removal efficiency (%) of RBO3RID dye and studentized residual plot.
C. Interactive Effect of Processes of Independent Variables
To understand the impact of each variable, three
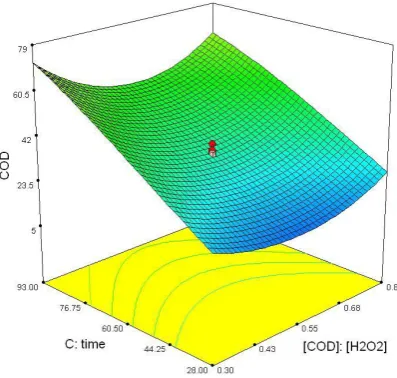
dimensional (3D) plots were made for the estimated responses, which were the bases of the model polynomial function for analysis to investigate the interactive effect of the two factors on the COD removal percentage within the experimental ranges given in Fig. 3-Fig. 5. The inferences so attained are discussed below.
Fig. 3. Interactive effect between COD to H2O2 ratio and H2O2 to Fe (II)
ratio. Fixed reaction time 60.5 minute.
1) Interactive effect between COD to Hydrogen
peroxide ratio and Hydrogen peroxide-to-Fe(II) ratio
To investigate the integrated effect of COD to Hydrogen peroxide ratio and Hydrogen peroxide-to-Fe(II) ratio, RSM was used and the result was given in the form of 3D plots. As indicated in Fig 3, by lowering H2O2 to Fe(II) ratio, COD RE% increased. By increasing H2O2 concentration, the COD removal increases. The effect of increasing catalyst (Fe2+) concentration is more distinct as seen by the sharp increase of COD removal efficiency.
2) Interactive effect between COD to Hydrogen
peroxide ratio and time
Fig. 4. Interactive effect between COD to H2O2 ratio and time (min). At
constant H2O2:Fe2+ ration= 0.06.
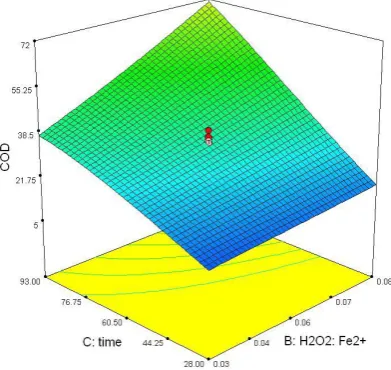
Fig. 5. Interactive effect between H2O2 to Fe (II) ratio to time (min). Fixed
COD to H2O2 ratio =0.55.
3) Interactive effect between hydrogen peroxide-to-Fe(II) ratio and Time
As seen in Fig. 5, the response surface and 3D plots were enhanced as a function of Hydrogen peroxide-to-Fe (II) ratio and time. Removal percentage increased remarkably with increasing catalyst concentration and with increasing experimental time. Thus, with increase of time, an improvement in dye degradation performance was determined.
D. Model Optimization and Confirmation
The desired goal of the model is to maximize COD removal efficiency to achieve highest treatment performance. The optimum values of the process variables for the maximum COD removal are shown in Table V. After verification through a further experimental test with the predicted values, the result indicates that the maximum decolonization efficiency was obtained when the values of each parameter were set as the optimum values. It implies that the strategy to optimize the decolonization conditions and to obtain the maximal decolonization efficiency by RSM for the decolonization of the dye RBO3RID with Fenton’s reagent in this study is successful.
TABLEV:CODREMOVAL EFFICIENCY AT OPTIMUM VALUES OF THE
PROCESS PARAMETERS
Variables Optimum value predicted
Experimental value
COD:H2O2
(wt:wt)
0.80 0.81
H2O2:Fe2+
(molar ratio)
0.08 0.78
Time (min) 93 93
COD removal efficiency % 80.18 78.56
IV. CONCLUSION
In this work, the removal of the model dye RBO3RID from aqueous solutions by Fenton’s reagent has been studied. Based on experimental results, an empirical relationship between the response and independent variables is obtained and expressed by the second-order polynomial equation. Effect of experimental parameters on COD removal efficiency of RBO3RID was established by the response surface and contour plots of the model-predicted responses. High COD removal (78.56%) was obtained under optimal value of process parameters for dye solutions in the 93 min of the removal process. Analysis of variance showed a high coefficient of determination value (R2=0.997, adj R2=99.48), thus ensuring a satisfactory adjustment of the second-order regression model with the experimental data.
ACKNOWLEDGEMENT
We like to acknowledge our Head of the Department Dr. Apurba Kumar Patra for his valuable suggestion and National Institute of Technology Durgapur, for providing infrastructure. Great assistance provided by our 2 fellow research scholars Ishani Mitra and Ram Chandra Maji.
REFERENCES
[1] U. Pagga and D. Brown, “The degradation of dyestuffs: Part II — Behaviour of dyestuffs in aerobic biodegradation tests,” Chemosphere, vol. 15, pp. 479-491, 1986.
[2] V. Tigini, P. Giansanti, A. Mangiavillano, A. Pannocchia, and G. C. Varese, “Evaluation of toxicity, genotoxicity and environmental risk of simulated textile and tannery wastewaters with a battery of biotests,” Ecotoxicol. Environ. Saf., vol. 74, no. 4, pp. 866-873, 2011. [3] H. Y. Shu, C. R. Huang, and M. C. Chang, “Decolorization of
monoazo dyes in wastewater by advanced oxidation process; a case study of acid red 1 and acid yellow 23,” Chemosphere, vol. 29, pp. 2597-2607, 1994 .
[4] S. S. Phugare, D. C. Kalyani, A. V. Patil, and J. P. Jadhav, “Textile dye degradation by bacterial consortium and subsequent toxicological analysis of dye and dye metabolites using cytotoxicity, genotoxicity and oxidative stress studies,” J. Hazard. Mater., vol. 186, no. 1, pp. 713-723, 2011a.
[5] S. S. Phugare, D. C. Kalyani, S. N. Surwase, and J. P. Jadhav, “Ecofriendly degradation, decolorization and detoxification of textile effluent by a developed bacterial consortium,” Ecotoxicol. Environ. Saf., vol. 74, no. 5, pp. 1288-1296, 2011b.
[6] N. Zhu, L. Gu, H. Yuan, Z. Lou, L. Wang, and X. Zhang, “Degradation pathway of the naphthalene azo dye intermediate 1-diazo-2- naphthol-4-sulfonic acid using Fenton's reagent,” Water Res., vol. 46, pp. 3859-3867, 2012.
[7] E. Neyens and J. Baeyens, “A review of classic Fenton’s peroxidation as an advanced oxidation technique,” J. Hazard. Mater., vol. 98, pp. 33-50, 2003.
[8] L. Gu, J.-Y. Nie, N.-W. Zhu, L. Wang, H.-P. Yuan, and Z. Shou, “Enhanced Fenton's degradation of real naphthalene dye intermediate wastewater containing 6-nitro-1-diazo-2-naphthol-4-sulfonic acid: A pilot scale study,” Chem. Eng. J., vol. 189-190, pp. 108-116, 2012. [9] F. Emami, A. R. Tehrani-Bagha, K. Gharanjig, and F. M. Menger,
“Kinetic study of the factors controlling Fenton-promoted destruction of a non-biodegradable dye,” Desalination, vol. 257, pp. 124-128, 2010.
[10] N. Masomboon, C. Ratanatamskul, and M. C. Lu, “Chemical oxidation of 2, 6-dimethylaniline by electrochemically generated Fenton's reagent,” J. Hazard. Mater., vol. 176, pp. 92-98, 2010. [11] R. C. Martins, A. F. Rossi, and R. M. Quinta-Ferreira, “Fenton's
oxidation process for phenolic wastewater remediation and biodegradability enhancement,” J. Hazard. Mater., vol. 180, pp. 716-721, 2010.
[12] F. Fu, Q. Wang, and B. Tanga, “Effective degradation of C.I. Acid Red 73 by advanced Fenton process,” J. Hazard. Mater., vol. 174, pp. 17-22, 2010.
[13] D. C. Montgomery, G. C. Runger, and N. F. Hubele, Engineering Statistics, John Wiley and Sons Inc., Hoboken, NJ, 2001.
Suvanka Dutta is working as a doctoral research scholar at National Institute of Technology, Durgapur, India. She earned her master of technology degree from National Institute of Technology, Durgapur, India. She did her master of science degree in environmental system management from Presidency College, Kolkata, India.
Suvanka did her research project of master degree on reductive degradation of textile dyes by zero valent iron nanoparticle. Her doctoral work is on chemical and photochemical degradation of textile dyes with various nanomaterials.
Ananya Ghosh is a research scholar at the National Institute of Technology, Durgapur, West Bengal, India. She completed her master degree in chemistry from the University of Burdwan in 2013. She is pursuing her doctoral work under the guidance of Dr. Raj Narayan Saha, associate professor at the Department of Chemistry in NIT, Durgapur. Her research interests lie in the different synthetic strategies of preparing nanomaterials and their utilization in the treatment of contaminated groundwater.
S. C. Moi has more than 16 years’ research experience in the fields of kinetics and mechanism of substitution reaction on d8 metal ion systems by bio-active molecules. He has earned his Ph.D. degree in chemistry from the Burdwan University India. He has 13 years’ teaching experience and is currently an associate professor of chemistry at National Institute of Technology Durgapur, India and greatly enjoys teaching introductory to advanced levels of chemistry courses such as B. Tech., M. Tech (Corrosion Science and technology) and M.Sc. His total publication is 14 in National and International Journals. His current research interest is in the area of bioactivity of Pt and Pd (II) metal complexes, speciation and DFT study.
Rajnarayan Saha has more than 15 years’ research experience in the field of environmental chemistry and water and wastewater treatment. He earned his Ph.D. degree from Indian Institute of Technology, Mumbai (IITB). He did his master degree in technology as well as in science from IITB and Burdwan University. He is currently working as an associate professor in the Department of Chemistry at National Institute of Technology, Durgapur, India. In addition to the doctoral programme, many M.Tech students are pursuing of their dissertation work under his guidance. He has completed and running Sponsored Projects from Govt. of India.
He published more than 20 research papers in different renowned International and National journals like Analyst, Journal of Hazardous Material, International Journal of Environment and Engineering, Journal of Plant interaction.
[14] G. G. Vining, Statistical Methods for Engineers, Duxburg Press, An International Thomason Publishing, Europe, London1V7AA, 2003. [15] M. Muthukumar, D. Sargunmani, N. Selvakumar, and J. Venkata Rao,
“Optimisation of ozone treatment for colour and COD removal of acid dye effluent using central composite design experiment,” Dyes Pigments, vol. 63, pp. 127-134,2004.
[16] Q. Beg, V. Sahai, and R. Gupta, “Statistical media optimization and alkaline protease production from Bacillus mojavensis in a bioreactor,” Proc. Biochem., vol. 39, pp. 203–209, 2003.
[17] APHA, AWWA, WPCF, Standard Methods for the Examination of Water and Wastewater, 9th ed., American Public Health Association, Washington, DC, 1995.
[18] J. Bassett, R. C. Denney, G. H. Jeffery, and J. Mendham, Vogel’s Text Book of Quantitative Inorganic Analysis Including Elementary Instrumental Analysis, 4th ed. ELBS & Longman, 1978, ch. 10, p. 381.
[19] S. S. Moghaddam, M. R. A. Moghaddam, and M. Arami, “Coagulation/flocculation process for dye removal using sludge from water treatment plant: Optimization through response surface methodology,” J. Hazard Mater., vol. 175, pp. 651-657, 2010. [20] M. A. Rauf, N. Marzouki, and B. K. Körbahti, “Photolytic
decolorization of Rose Bengal by UV/H2O2 and data optimization
using response surface method,” J. Hazard Mater., vol. 159, pp. 602-660, 2008.
[21] V. V. Guaracho, N. M. S. Kaminari, M. J. J. S. Ponte, and H. A. Ponte, “Central composite experimental design applied to removal of lead and nickel from sand,” J. Hazard. Mater., vol. 172, pp. 1087-1092, 2009.