Abstract— This experimental program focuses on the application of non-linear ultrasonic (NLU) and acoustic emission (AE) techniques to evaluating concrete with compression induced distributed damages. Cubic specimens, 150 x 150 x 150 mm, were cast with w/c of 40%, 50%, and 60%. The nonlinear ultrasonic evaluation was based upon measuring the change in fundamental amplitude with increasing damage and output power level. The test results obtained were analyzed and the suitability of using nonlinear ultrasonic amplitude attenuation as a useful measure of damage growth in concrete was examined. In acoustic emission testing technique 4 sensors were used to listen to the wide range of events under various loading and unloading cycles. The data obtained was carefully examined for Kaiser effect and Felicity ratio was appropriately measured at different loading stages in order to assess the concrete deterioration. Normalized values of Felicity Ratio were plotted and compared with the nonlinear ultrasonic test data. A correlation between acoustic emission and nonlinear ultrasonic techniques in assessing damage growth in concrete was investigated.
Index Term— acoustic emission, Felicity ratio,
fundamental amplitude, Kaiser effect, non-linear
ultrasonic.
I. INT RODUCT ION
THE demands for assuring the safety and the performance of concrete structures requires inspection for estimating the condition of existing and aging structures, which are usually subjected to severe environmental effects. A variety of inspection methods have been studied to provide early detection and warning for critical defects. For a quasi-brittle material like concrete, a subs tantial non-linearity in the shape of micro-cracking exists even before maximum stress is reached. In order to maintain the structure, these cracks should be inspected properly for quantifying the condition of structural integrity and assessing the degree of damage and deterioration. The inspection methods for nondestructive evaluation (NDE) of concrete structures are in demand for this purpose.
Nonlinear ultrasound has been found to be very useful in evaluating distributed damage in concrete [1]. It is sensitive to low levels of damage, making it an ideal method for detecting damage at its earliest stages. Studies conducted by Roe et al. [2] showed the suitability of using a nonlinear ultrasonic
A. A. Shah is with the College of Engineering, King Saud University, P. O. Box 800, Riyadh 11421, Kingdom of Saudi Arabia. (corresponding author phone: +96614670631; fax: +96614673600; e-mail: [email protected]).
Y. A. Al-Salloum is with the College of Engineering, King Saud University, P. O. Box 800, Riyadh 11421, Kingdom of Saudi Arabia. (e-mail:
technique in detecting damage in concrete. Nonlinear non -destructive ultrasonic tests were performed on a laboratory concrete bridge to detect damage in the deck after it was overloaded. The nonlinear ultrasonic tests detected damage throughout the deck; particular interest was paid to locations where damage was not visible. These results were compared to those obtained using pulse velocity tests at the same locations. Nonlinear ultrasonics was found to be several orders of magnitude more sensitive to damage diction than the results obtained from pulse velocity.
In a recent study by Shah and Hirose [3], nonlinear ultrasonic test method was effectively used in detecting early damages in cubic concrete specimens. Wave propagation was made at various output power levels through the concrete subjected to compression load application in several steps. Ultrasonic amplitude attenuation was used to measure the non -linear response of the concrete. At each damage and power levels, the fundamental amplitude was measured and compared with the one obtained at undamaged stage. A change in fundamental amplitude even at early loading stages compared to that at unloaded state was observed showing higher sensitivity of the non-linear ultrasound method to detecting early stage damages in concrete. The sensitivity of wave attenuation based nonlinear ultrasound test method increased with increasing damage, providing an efficient means of assessing concrete integrity.
Similarly, the AE technique is one of the most sensitive techniques to non-invasively monitor deformation, fatigue, and fracture of materials and it is an experimental tool well suited for monitoring fracture processes [4-8]. Acoustic emission is caused due to localized and rapid release of strain energy in a stressed material. AE is a class of phenomena whereby transient elastic waves are generated by rapid release of energy from localized sources within a material. The stress waves can be detected on the specimen surface and analyzed to deduce the magnitude and nature of the damage present in materials. The technique of acoustic emission has two areas of broad applications. The first is nondestructive evaluation. The second is a tool in studies or research, which are not fundamentally directed toward acoustic emission [9, 10]. Structural elements can fail in many different ways. AE technique is a useful tool to study the energy released during the different failure mechanisms in different types of materials. It is this second application with which, in general structural engineering is concerned. Acoustic emission (AE) is a very useful tool in this role because of its high sensitivity to
Correlating Tests of Progressively Damaged
Concrete with NLU and AE Techniques
any process or mechanism that generates sound waves. AE technique is one of the potential tools to estimate the fracture process zone. As concrete is a heterogeneous material consisting of different phases, the inelastic zone around a crack tip is termed a fracture process zone and AE has been used to observe the fracture process zone [11-14]. Concrete structures contain flaws such as pores, air voids, and shrinkage cracks even before they are mechanically loaded. These flaws cause the microcracks under the external loading, which extend to macrocracks until large fractures are formed, which cause collapse of the structure. To describe the fracture mechanism as well as fracture parameters and to locate cracks AE has been used [15-18]. Three dimensional (3D) acoustic emission (AE) has also been applied to observe the phase of the fracture zone of concrete ahead of the crack tip, which significantly influences the tension softening behavior of concrete. 3D acoustic emission (AE) technique was applied to obtain the influence of the aggregate size. It was also revealed that the fracture process zone may expand as the crack grows and the expanding rate of the process zone is influenced by the aggregate size [19].
Researchers have suggested the applicability of Kaiser Effect for assessing the deterioration of concrete structures [20]. b-value analysis of acoustic emission (AE) signals was used to assess the damage that occurred in reinforced concrete beams [21]. AE was used to quantify damage in generic laboratory structures for the purpose of tuning damage models [22]. Damage estimation of structural concrete from concrete samples was developed, combining acoustic emission measurements with damage mechanics [23]. Acoustic emission characteristics due to microcracking were studied in full scale prestressed concrete piles by applying AE and fundamental study on the mechanism of the piles under both cyclic and monotonic loads [24]. Acoustic emission characteristics of three-point bending concrete beams were investigated during the entire loading period and found that relative notch depth significantly influenced AE characteristics [25].
In the present experimental study it is intended to examine the correlation between the non-linear ultrasonic and acoustic emission techniques. The sensitivity of non -linear ultrasound test method in detecting cracks or defects is certainly influenced by the microstructural behavior, which in turn is influenced by the change in damage level and w/c. It is also obvious that acoustic emission events are influenced by the change in damage level and w/c. Therefore it will be appropriate to find a relationship, if any, between non -linear ultrasonic and acoustic emission techniques that will be very useful in understanding the concrete material behavior subjected to axial compression steps loading.
II. EXPERIMENT AL PROGRAM A. Materials and Specimen Preparation
Three batches of concrete with different w/c, 40%, 50%, and 60%, were used to produce 18 cubic specimens, 150 x 150 x
150 mm in size. Each concrete batch consisted of 6 cubic specimens. Three specimens from each batch with each w/c were used for acoustic emission experiments and the remaining three specimens from the same batch for nonlinear ultrasonic evaluation. The mean value of the three test specimens was used for analysis and comparison of the test results. All of the specimens were produced with Type I Portland cement, 12 mm coarse aggregate, fine aggregate, water, a high range water reducing admixture, and air entraining agent. Three cylinders 102 mm in diameter and 203 mm tall were also cast from each batch of concrete. After casting, all the specimens were kept under ambient conditions for 24 h, covered with a polythene sheet. The moulds were opened and the hardened concrete specimens were wet cured for 28 days. The cylinders were then tested for compressive strength. The mean compressive strength of the cylinders was used to measure the compressive strength of the cubes in selecting the load steps for ultrasonic testing.
B. Test Setup
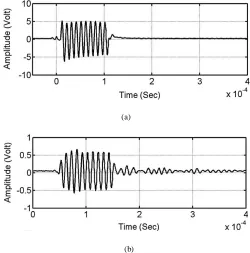
Fig. 1 shows the test setup for non-linear ultrasonic and acoustic emission experiments. The non-linear ultrasonic test setup (see Fig. 1 (a)) is composed of five parts: an 80 MHz synthesized function/arbitrary waveform generator (Model 33250A-Agilent) for generating a continuous sinusoidal P-wave signal, a RITEC RF tone burst gated amplifier (Model GA-1000-0.05-5-5kw) for amplifying the input ultrasonic signals from the function generator; a RITEC modestly high gain broadband RF receiver (Model BR-640-LF); two piezoelectric contact transducers for transmitting and receiving ultrasonic pulses (Japan Probe); and an oscilloscope (Model hp-infinium-500 MHz-1G Sa/s) with a built-in PC. The transmitting wave transducer operated at a central frequency of 100 kHz, and the receiving wave transducer had a central frequency of 200 kHz. The waveform of the transmitted signal was a tone burst with 10 cycles. Fig. 2 shows examples of transmitted and received signals.
In the experiments, a thin layer of silicone gel was used as couplant between the transducers and the concrete surfaces. In addition, two rubber bands were tightly rapped around the transducers that together with the couplant provided excellent conductivity for ultrasonic signals and considerably improved the local contact conditions between the transducers and the concrete surfaces (see Fig. 1 (a)).
(a)
(b)
Fig. 1. T est setup (a) Non-Linear Ultrasonic (b) Acoustic Emission
Fig. 1 also shows the instrumentation for compression testing. The non-linear ultrasonic and acoustic emission tests, respectively, were performed simultaneously with uni-axial compression loading. The axial compressive load to each specimen was gradually applied in several steps until peak level using a universal testing machine (UTM, closed loop servo-hydraulic testing machine) in the stroke control mode using a built-in ramp function. At the end of each loading step the non-linear ultrasonic test and AE monitoring was performed and the test data was recorded.
(a)
(b)
Fig. 2. Examples of (a) transmitted signal and (b) received signal
C. Testing Procedure
The objective was to observe the nondestructive evaluation of a concrete cube progressively damaged under axial compression loading using nonlinear ultrasonic and acoustic emission test methods. The damages to each test specimen were induced in compression in increments of 20% of the ultimate strength of the specimen. In nonlinear ultrasound tests, after each loading increment, the load was held constant while specimen was ultrasonically evaluated in the through transmission mode. Each specimen was carried throu gh cycles of loading, and NDT analysis for loads of 0, 20, 40, 60, and 80% of the estimated failure load. The tests were also run at five pulser output power levels corresponding to 10, 30, 50, 70, and 90% of the maximum possible peak-to-peak output of 1800V. The specimens were first evaluated ultrasonically in the undamaged condition with all power levels to establish a baseline. The ultrasonic data recorded at higher loading stages and different input power levels was compared with the baseline value in order to measure the change in fundamental amplitude of the waveform or attenuation.
(a)
(b)
Fig. 3. AE monitoring (a) peak amplitude and load Vs. elapsed time (b) AE hits and load Vs. elapsed time
Under incremental cyclic loads, AE activity in concrete can be represented with damage progress as shown in Fig. 4. Provided that damage levels are classified into four different levels: in-tact; almost intact; slightly damaged; and heavily damaged, AE activity corresponding to each damage level is demonstrated as in the chart. In the second cyclic load, AE activity would start to be observed at the load level of the maximum prior load. This phenomenon is referred to as Kaiser Effect. In the subsequent third cyclic load, in which the material shows slightly damaged condition, the onset of AE appearance would be at a lower load level than previously applied. Decrease of effective areas against external load or accumulation of microcracks within materials appears to play significant roles for the observed behavior. In order to express the relation of AE activity to the stress level experienced, such damage-indices as Felicity ratio [26], CBI ratio [27], and Load ratio [28] have already been proposed. It is also important to pay attention to the AE activity during un loading processes [24]. With the evolution of damage, not only the AE activity during uploading, but that during unloading becomes more intense. Accumulation of shear-type cracks seems to produce this phenomenon. The ratio of the cumulative number of AE
events during uploading to that during unloading, is referred to as Calm ratio [28].
Fig. 4. Representation of AE activity with damage progress In the present study, Felicity Ratio was used as a measure of AE evaluation of damages in concrete induced by compression loading. It is defined as the load where considerable AE resumes, divided by the maximum applied load. Since, concrete contains flaws or defects in the shape of microcracks even at early loading stages it was very difficult to locate exactly the onset at which AE activity resumes. Hence, Felicity ratio was measured during reloading operation for the load levels corresponding to AE hits at 3, 5, and 10%, respectively, of the AE hits at the previous maximum load. By doing so, Felicity Ratio can be used as a measure of damage assessment with different sensitivity levels to detecting damages in concrete. Normalized values of Felicity Ratio at three different points were plotted and compared with the change in fundamental amplitude measured with nonlin ear ultrasound method. Sensitivity of the two methods to assessing damage growth in concrete using different w/c was examined. Besides this, a relationship between the two methods was also investigated.
III. RESULT S AND DISCUSSION
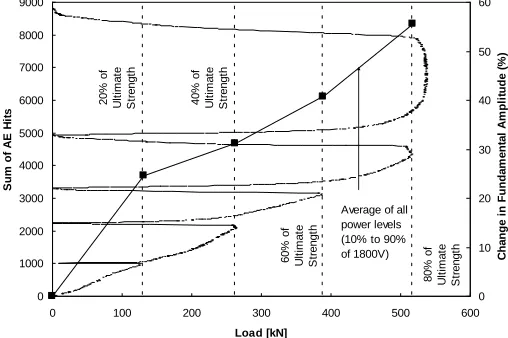
This study‟s primary objective was to investigate a relationship between nonlinear ultrasonic parameter and the acoustic emission parameter in the presence of compression induced damages in concrete. In nonlinear ultrasound tests wave attenuation was used as a measure of damage ev aluation in concrete. The change in fundamental amplitude of the waveform or attenuation was measured from the Fourier spectra prepared for different load and output power levels. The amplitude values obtained at damaged state were compared with those of undamaged state and change in amplitude was recorded. The results of the nonlinear wave attenuation are reported by Shah and Hirose [3]. Here the average results of three test specimens with each w/c using all power levels are plotted and compared with the average AE events of the three specimens at each w/c.
rate of total AE hits derived from all 4 channels. 0 500 1000 1500 2000 2500 3000 3500 4000 4500
0 100 200 300 400 500 600 700 800 900 1000
Load [kN] S um of A E H it s 0 10 20 30 40 50 60 70 80 C ha ng e i n Fu nd a m e nt a l A m pl it ud e ( % ) 2 0 % o f U lt im a te S tr e n g th 4 0 % o f U lt im a te S tr e n g th 6 0 % o f U lt im a te S tr e n g th 8 0 % o f U lt im a te S tr e n g th
Average of all power levels (10% to 90% of 1800V)
Fig. 5. AE events and change in fundamental amplitude Vs. the load applied for w/c of 40%
During several loading and unloading cycles the data obtained was thoroughly examined for the occurrence of Kaiser Effect and other damage indices, Felicity Ratio in particular. None of the specimens clearly exhibited any sign of the occurrence of perfect Kaisar Effect. AE hits were actively generated during 30-40% of the previous maximum load even at the first cyclic loading stage. This suggests that Kaiser Effect started to break from approximately 40% of the first maximum cyclic loading stage and continuous AE activity was obtained not only in loading but also in unloading operation at below 40% of the previous maximum load at higher loading stages. Each loading stage was carefully checked for the difference in load where the AE activity resumes and the maximum applied load for calculating the Felicity Ratio wherever applicable. Since concrete consists of non-linearity in the shape of microcracks even before the application of load or at initial loading stages, Felicity ratio was calculated by measuring the load readings at three different points where the AE activity during reloading operation is supposed to resume i.e. 3, 5, and 10% of the AE hits at the previous maximum load divided by the previous maximum load. By doing so we obtained Felicity ratio values exhibiting both conservative and unconservative trends towards damage assessment in concrete.
The nonlinear ultrasound parameter has shown the results in the same manner as occurred in the test specimens using acoustic emission technique. The change in fundamental amplitude of the waveform increases as damage increases. For damage level of 80 percent the amplitude is changed from the undamaged state by approximately 70 percent.
Figs. 6 and 7 show similar information for the test specimens with w/c of 50 and 60%, respectively . Average results of three specimens using AE technique and three specimens with nonlinear ultrasonic method were plotted against the applied load. The trends of increasing AE events
and change in attenuation with damage are apparent in the fig. However, the increase in AE hits with damage for w/c of 50 and 60%, respectively, is higher than that which occurred in the specimens with a w/c of 40%. Again no sign of Kaiser Effect was clearly observed. For both w/c concretes AE activity at each loading stage res umes at or below 30% of the previous maximum applied load. Hence, the loading points where there were significant AE activities during reloading operations were carefully monitored. Felicity Ratio was measured, as measured for 40% w/c concrete, at three different reloading points corresponding to the AE hits at 3, 5, and 10% of the AE events appeared at the previous maximum load. 0 1000 2000 3000 4000 5000 6000 7000
0 100 200 300 400 500 600 700
Load [kN] S um of A E H it s 0 10 20 30 40 50 60 70 C ha ng e i n Fu nd a m e nt a l A m pl it ud e ( % ) 2 0 % o f U lt im a te S tr e n g th 4 0 % o f U lt im a te S tr e n g th 6 0 % o f U lt im a te S tr e n g th 8 0 % o f U lt im a te S tr e n g th
Average of all power levels (10% to 90% of 1800V)
Fig. 6. AE events and change in fundamental amplitude Vs. the load applied for w/c of 50%
0 1000 2000 3000 4000 5000 6000 7000 8000 9000
0 100 200 300 400 500 600
Load [kN] S um of A E H it s 0 10 20 30 40 50 60 C ha ng e i n Fu nd a m e nt a l A m pl it ud e ( % ) 2 0 % o f U lt im a te S tr e n g th 4 0 % o f U lt im a te S tr e n g th 6 0 % o f U lt im a te S tr e n g th 8 0 % o f U lt im a te S tr e n g th
Average of all power levels (10% to 90% of 1800V)
Fig. 7. AE events and change in fundamental amplitude Vs. the load applied for w/c of 60%
of voids and porosity as well as a weaker interfacial transition zone than low water cement ratio concrete has. These defects lead to premature micro-crack formation and increased attenuation. Thus, the change in attenuation for high w/c concrete was smaller from the undamaged state to the damaged state. This implies that as damage progressed, the specimen with a w/c of 40% experienced a greater loss in fundamental amplitude than the specimens with w/c of 50 and 60%, respectively.
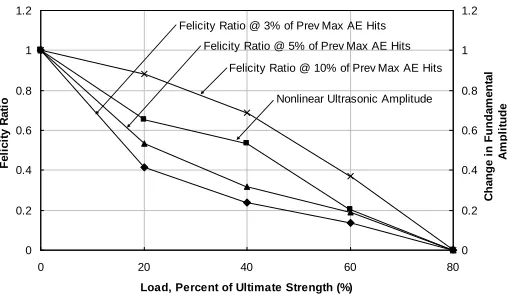
Fig. 8 shows the normalized values of the Felicity Ratio (FR) and change in fundamental amplitude for w/c of 40% against the progress in damage.
Normalized Plot For W/C=40%
0 0.2 0.4 0.6 0.8 1 1.2
0 20 40 60 80
Load, Percent of Ultimate Strength (%)
Fe li c it y R a ti o 0 0.2 0.4 0.6 0.8 1 1.2 C ha ng e i n Fu nd a m e nt a l A m pl it ud e
Felicity Ratio @ 3% of Prev Max AE Hits
Nonlinear Ultrasonic Amplitude Felicity Ratio @ 5% of Prev Max AE Hits
Felicity Ratio @ 10% of Prev Max AE Hits
Fig. 8. AE parameter and nonlinear ultrasound parameter Vs. the load applied for w/c of 40%
A closed relationship between the two parameters in detecting distributed damages in concrete has been observed. Felicity Ratio (FR), obtained at all three loading points during reloading operation, was reduced smoothly from the undamaged state as damage progressed. The FR value at 20% damage level indicates that even at early loading st ages the occurrence of Kaiser Effect was hard to observe. In addition, it suggests that microcracking does exist in this concrete under initial load application due to which AE activity resumed at the load much less than the previous maximum load. Similarly, the signal amplitude decreases smoothly from undamaged state to damaged state. For damage level above 40% the reduction in amplitude was larger. Additionally, for these specimens AE results seem more sensitive, for 3 and 5% of the AE hits at the previous maximum load in particular, to concrete damages than nonlinear ultrasonic testing.
Figs. 9 and 10 show the same information for test specimens with w/c of 50 and 60%, respectively. Felicity Ratio (FR) and fundamental amplitude were found decreasing with increasing damage. However, the reduction in FR for w/c of 50 & 60%, respectively, with damage is greater than that which occurred with a w/c of 40%. In case of signal amplitude, as stated earlier, initially the specimens with w/c of 50 & 60%, respectively, experienced greater loss in fundamental amplitude than the specimens with a w/c of 40%. However, as damage progressed the specimens with 40% w/c concrete attenuated strongly than high w/c concrete. Following the
conservative trend in measuring the Felicity Ratio, again the AE monitoring for these specimens has shown increased sensitivity to concrete damages over the nonlinear ultrasonic testing.
Normalized Plot for W/C=50%
0 0.2 0.4 0.6 0.8 1 1.2
0 20 40 60 80
Load, Percent of Ultimate Strength (%)
Fe li c it y R a ti o 0 0.2 0.4 0.6 0.8 1 1.2 C ha ng e i n Fu nd a m e nt a l A m pl it ud e
Felicity Ratio @ 3% of Prev Max AE Hits Felicity Ratio @ 5% of Prev Max AE Hits
Felicity Ratio @ 10% of Prev Max AE Hits
Nonlinear Ultrasonic Amplitude
Fig. 9. AE parameter and nonlinear ultrasound parameter Vs. the load applied for w/c of 50%
Normalized Plot for W/C=60%
0 0.2 0.4 0.6 0.8 1 1.2
0 20 40 60 80
Load, Percent of Ultimate Strength (%)
Fe li c it y R a ti o 0 0.2 0.4 0.6 0.8 1 1.2 C ha ng e i n Fu nd a m e nt a l A m pl it ud e
Felicity Ratio @ 3% of Prev Max AE Hits Felicity Ratio @ 5% of Prev Max AE Hits
Felicity Ratio @ 10% of Prev Max AE Hits Nonlinear Ultrasonic Amplitude
Fig. 10. AE parameter and nonlinear ultrasound parameter Vs. the load applied for w/c of 60%
The data plotted in Figs. 8-10 show close correlation between the nonlinear ultrasonic and acoustic emission parameters. The Felicity Ratio plotted with 3 and 5%, respectively, of the previous maximum AE events exhibited conservative trend and has shown higher sensitivity of acoustic emission testing than nonlinear ultrasonic testing to damage detection in concrete. On the other hand, Felicity Ratio measured with 10% of the AE hits of the previous maximum load has shown an unconservative trend towards detecting damages in concrete. In that case nonlinear ultrasound method appears more sensitive than the acoustic emission technique. Although, using conservative or unconservative trends, acoustic emission monitoring can effectively perform damage assessment in concrete, change in nonlinear ultrasonic amplitude appears to be an easy and simple measure of damage growth in concrete.
IV. CONCLUSIONS
utilization of nonlinear ultrasound method and acoustic emission technique in nondestructive evaluation of concrete cubes progressively damaged under compression loading. The nonlinear ultrasonic evaluation was based upon measuring the change in fundamental amplitude with increasing damage and output power level. In acoustic emission testing technique 4 sensors were used to listen to the wide range of events under various loading and unloading cycles. Each loading and unloading stage was carefully examined for Kaiser and Felicity effects in order to assess the concrete deterioration. Normalized values of Felicity Ratio were plotted and compared with the nonlinear ultrasonic test data. A possible correlation between acoustic emission and nonlinear ultrasonic techniques in assessing damage growth in concrete was investigated. The test results analysis led to the following conclusions.
1. The acoustic emission activity and nonlinear ultrasonic amplitude were found quite sensitive to change in the applied loading events and w/c.
2. AE events and attenuation were observed to increase significantly as damage progresses. Additionally, as concrete contains microcracks even at initial loading stages, none of the test specimens exhibited clearly any signs of the occurance of perfect Kaiser effect.
3. A close correlation between AE damage index (Felicity Ratio) and nonlinear ultrasonic parameter (wave attenuation) in detecting concrete damages was observed. Felicity Ratio and signal amplitude were reduced smoothly from the undamaged state as damage progressed.
4. Felicity ratio measured at three different loading points exhibited conservative and unconservative trends when plotted against the change in nonlinear ultrasonic amplitude at fundamental frequency. Following conservative trend the acoustic emission index has shown greater sensitivity to concrete damages over nonlinear ultrasound method. However, with unconservative trend the acoustic emission sensitivity to damage detection in concrete appeared less than that of nonlinear ultrasonic testing.
5. Generally, nonlinear ultrasonic parameter (wave attenuation) appears to be an easy measure of assessing concrete damages.
6. These results can be of great interest in evaluation of concrete structures.
ACKNOWLEDGMENT
This research is supported by King Saud University, Riyadh, Saudi Arabia, which is thankfully acknowledged.
REFERENCES
[1] J. D. Stauffer, C. Woodward, and K. R. White, “ Nonlinear ultrasonic testing with resonant and pulse velocity parameters for early damage in concrete,” ACI Materials Journal, vol. 102, no. 2, pp. 118-121, 2005. [2] S. E. Roe, C. Woodward, and M. J. Cramer, “ Nonlinear ultrasonic testing on a laboratory concrete bridge deck,” Review of Progress in Quantitative Non-destructive Evaluation, 26, pp.1429-1434, 2007.
[3] A. A. Shah, and S. Hirose, “ Nonlinear ultrasonic evaluation of concrete with cracks induced under compression,” Proceedings of the 17th
Sym posium on Ultrasonic Testing, T he Japan Society for Non-Destructive Inspection, Sendai, Japan, pp. 65-68, October 5-7, 2008. [4] S. Mindess, “ Acoustic emission,” Handbook on Nondestructive Testing
of Concrete. CRC Press, Boca Raton, Fla., 1990.
[5] M. Ohtsu, “ A review of acoustic emission in civil engineering with emphasis on concrete,” Journal of Acoustic Emission,; vol. 8, no. 4, pp. 93-98, 1989.
[6] M. Ohtsu, “ T he history and development of acoustic emission in concrete engineering,” Magazine of Concrete Research, vol. 48, no. 177, pp. 321-330, 1996.
[7] M. Ohtsu, and H. Watanabe, “ Quantitative damage estimation of concrete by acoustic emission,” Construction and Building Materials, no. 15, pp. 217-224, 2001.
[8] T . Uomoto, “Application of acoustic emission to the field of concrete engineering,” Journal of Acoustic Emission, vol. 6, no. 3, pp. 137-144, 1987.
[9] R. K. Miller, and P. McIntire, Nondestructive testing handbook. vol. 5, Acoustic Emission T esting, American Society for Nondestructive T esting Inc., 1987.
[10] Physical Acoustic Corporation (PAC). PAC user’s manual SAMOS AE system. Princeton Junction, NJ, 2005.
[11] A. K. Maji, and S. P. Shah, “ Process zone and acoustic emission measurement in concrete,” Experimental Mechanics, pp. 27-33, 1988. [12] A. K. Maji, C. Ouyang, and S. P. Shah, “ Fracture mechanism of
quasi-brittle materials based on acoustic emission. Journal of Materials Research, vol. 5, no. 1, pp. 206-217, 1990.
[13] K. Otsuka, and H. Date, “ Fracture process zone in concrete tension specimen,” Engineering Fracture Mechanics, vol. 65, pp. 111-131, 2000.
[14] M. H. Nomura, and M. Izumu, “Correlation of fracture process zone and tension softening behavior in concrete,” Cem ent and Concrete Research, no. 21, no. 4, pp. 545-550, 1991.
[15] P. Rossi, J. L. Robert, J. P. Gervais, and D. Bruhat, “The use of acoustic emission in fracture mechanics applied to concrete,” Engineering Fracture Mechanics, vol. 35, no. 4-5, pp. 751-763, 1990. [16] Z. Li, and S. P. Shah, “ Localization of microcracking in concrete under
uniaxial tension,” ACI Materials Journal, vol. 91, pp. 372-381, 1994. [17] M. V. Lysak, “Development of the theory of acoustic emission by propagating cracks in terms of fracture mechanics,” Engineering Fracture Mechanics, vol. 55, no. 3, pp. 443-452, 1996.
[18] M. Izumi, H. Mihashi, and N. Nomura, “Acoustic emission technique to evaluate fracture mechanics parameters of concrete,” Fracture toughness and fracture energy of concrete. F. H. Wittmann, ed., Elsevier Science, Amsterdam, T he Netherlands, pp. 259 -268, 1986. [19] H. Mihashi, N. Nomura, and S. Niseki, “Influence of aggregate size on
fracture process zone of concrete detected with three dimensional acoustic emission technique,” Cement and Concrete Research, vol. 21, no. 4, pp. 737-744, 1991.
[20] S. Yuyama, T . Okamoto, and S. Nagataki, “ Acoustic emission evaluation of structural integrity in repaired reinforced concrete beams,” Materials Evaluation, vol. 52, no. 1, pp. 86-90, 1994.
[21] S. Colombo, I. G. Main, and M. C. Forde, “ Assessing damage of reinforced concrete beam using „b-value‟analysis of acoustic emission signals,” Journal of Materials in Civil Engineering, vol. 15, no. 3, pp. 280-286, 2003.
[22] E. N. Landis, and B. Lucie, “ Experiments to relate acoustic emission energy to fracture energy of concrete,” Journal of Engineering Mechanics, vol. 128, no. 6, pp. 698-702, 2002.
[23] K. Matsuyama, T . Fujiwara, A. Ishibashi, and M. Ohtsu, “ Field application of acoustic emission for diagnosis of structural deterioration of concrete,” Journal of Acoustic Em ission, vol. 11, no. 4, S65-S73, 1993.
[24] T . Shiotani, M. Shigeishi, and M. Ohtsu, “ Acoustic emission characteristics of concrete piles,” Construction and Building Materials, vol. 13, no. 1-2, pp. 73-85, 1999.
[26] T . J. Fowler, “ Experience with acoustic emission monitoring of chemical process industry vessels,” Progress in Acoustic Em ission III, Japan Society for Non-destructive Inspection, pp. 150-162, 1986. [27] S. Yuyama, T . Okamoto, M. Shigeishi, M. Ohtsu, and T . Kishi, “ A
proposed standard for evaluating structural integrity of reinforced concrete beams by AE,” Acoustic Emission: Standards and Technology Update, AST M ST P1353, pp. 25-40, 1998.
[28] T he Japanese Society for Non-Destructive Inspection (JSNDI). Recom mended practice for in situ monitoring of concrete structures by acoustic em ission. NDIS2421, 24 p., 2000.
Abid A. Shah. This author was born on November
02, 1974 at Bannu Pakistan. He earned his B.S. degree in Civil Engineering from N.W.F.P. University of Engineering and T echnology, Peshawar, Pakistan in 1996, in 2000 he received his M.S. degree in Structural Engineering from National University of Sciences and T echnology, Islamabad, Pakistan, and in 2004 he got his Ph.D. degree in Structural Engineering from the University of Leipzig, Leipzig, Germany.
He worked for one and half years (2005-2006) as Senior Lecturer in Civil Engineering at the University of Botswana, Gaborone, Botswana (Southern Africa). Afterwards, he joined Tokyo Institute of Technology, T okyo, Japan as Postdoctoral Fellow under a fellowship from Japan Society for the Promotion of Science (JSPS) in 2006. He worked there in the area of Nondestructive Evaluation of Distributed Damages in Concrete using Nonlinear Ultrasonics and Acoustic Emission T echniques. Presently, he is working as Assistant Professor, Specialty Units for Safety and Preservation of Structures, College of Engineering, King Saud University, Riyadh, Kingdom of Saudi Arabia. He is doing research in the area of Infrastructure Health and System Monitoring. He has published 24 papers in refereed journals, 14 papers in international conference, submitted 3 research reports, and delivered three invited talks. He has also published one book on the subject of Punching Shear of Flat -Plate Slab-Column Connections with Book on Demand, GmbH, Norderstedt, Germany in 2005. His current and previous research interests include Structural Health Monitoring, Rehabilitation of Concrete Structures using FRP, Nonlinear Ultrasonics and Acoustic Emission based Assessment of Damage in Concrete, and Punching Shear of Flat-Plate Slab-Column Connections.
D. Shah is registered as Professional Engineering with Pakistan Engineering Council since 2000. He is also a member of Saudi Council of Engineers (SCE).
Youse f A. Al -Salloum. T his author is working as