Towards the Development of a Learning Analytics
extension in Open edX
Javier Santofimia Ruiz, Héctor J. Pijeira Díaz, José A. Ruipérez-Valiente,
Pedro J. Muñoz-Merino, Carlos Delgado Kloos
Universidad Carlos III de Madrid Avenida Universidad 30 28911 Leganés (Madrid) Spain
{100060449@alumnos, 100075697@alumnos, jruipere@it, pedmume@it, cdk@it}.uc3m.es
ABSTRACT
The emergence of platforms to support MOOCs (Massive Open Online Courses) strengthens the need of a powerful learning analytics support since teachers cannot be aware of so many students. However, the learning analytics support in MOOC platforms is in an early stage nowadays. The edX platform, one of the most important MOOC platforms, has few learning analytics functionalities at present. In this paper, we analyze the learning analytics support given by the edX platform, and the main initiatives to implement learning analytics in edX. We also present our initial steps to implement a learning analytics extension in edX. We review technical aspects, difficulties, solutions, the architecture and the different elements involved. Finally, we present some new visualizations in the edX platform for teachers and students to help them understand the learning process.
Categories and Subject Descriptors
K.3.1 [Computer Uses in Education]: Distance learning; H.1.2 [User/Machine Systems] Human information processing; D.2.11 [Software Architectures] Domain-specific architectures;
General Terms
Design, Performance, Human Factors
Keywords
Learning analytics, MOOCs, visualizations
1.
INTRODUCTION
The use of Virtual Learning Environments (VLEs) in teaching activity is very common nowadays. Technology should strengthen the existing weaknesses in education and open new possibilities so that the learning process can be improved at different levels. In addition, teachers should be able to reflect on their teaching taking into account the results of what their students have done so that they can update their methods and improve the learning cycle in each iteration. Furthermore, students should know about their mistakes and check on how they are progressing in the course when interacting with a VLE. However, it is very hard to make sense of the raw data that is stored as the result of the students’ interaction. Therefore, it is necessary to transform raw data into useful information that can be used by the different stakeholders in the learning process. One of the most promising areas of research emerging to fulfill this requirement is learning analytics. Learning analytics involves the use of advanced modeling techniques to better understand student learning process and improve the support provided for students and instructors; it includes the use of different types of data (such as class grades, demographics, VLE activity or surveys) [1].
A concrete case scenario which has emerged strongly in the past few years are MOOCs. The online phenomenon of MOOCs is
built upon the active engagement of several hundred to several thousands of students, the facilitation of an acknowledged expert in a field and a collection of freely accessible online resources [2]. MOOCs started to be widely known a few years ago, however there are many authors such as O’Donnel [3] who argue that the MOOC methodology has been used since long ago. Many influential universities such as Harvard and MIT, and also important companies like Google and Microsoft provided important support that boost MOOCs to gain notoriety in the higher education context. There are different MOOC providers but the three largest in 2013 were Coursera1, edX2 and Udacity3
[4]. These platforms have hundreds of thousands of users registered and courses are usually taken by several thousands of students. This massiveness makes even more necessary the use of learning analytics techniques so that students can receive feedback and information for their self-awareness. Instructors cannot devote a lot of time to each student, so they need help from the system. For example, it would be useful for instructors if the system would warn them in case that way too many students are struggling in an exercise, which might indicate some kind of problem.
Currently, edX is comprised of 53 schools and has over 2.5 million users taking more than 200 courses online [5]. EdX has been developed as an open-software tool which encourages a collaborative environment where everybody can work on enhancements. This open software initiative has been denominated Open edX4 and the source code can be found on
GitHub. However, the learning analytics support in edX is still in its very first steps and needs much more work. Although first analysis [6] of the data generated in edX courses have been reported, instructors and students need to have a learning analytics online support more powerful in order to improve the MOOC experience. There are different challenges when implementing learning analytics on edX such as how to integrate a learning analytics application in the edX architecture taking into account its data storage, APIs or infrastructure. Another challenge example is the selection and way of calculation of important indicators and visualizations that take into account the specific edX environment and interactions.
In this work we present our first steps towards developing a learning analytics extension for Open edX providing information of the results already achieved, which includes an analysis of the
different technological options and issues, how to integrate with the edX architecture, the different elements involved, or some provided visualizations. The provided visualizations were not present before in edX and take into account the specific features of edX.
The remainder of the paper will be organized as follows. First, we will cover some related work about learning analytics and visualizations in section 2. Section 3 makes an analysis of the learning analytics support in edX and what initiatives have been created. Section 4 presents an overview of the technologies and architecture of our proposed extension, leading to some of the available visualizations which are introduced in section 5. We finish with conclusions and future work in this line of research in section 6.
2.
RELATED WORK
One of the biggest challenges of learning analytics is the definition of indicators that can be meaningful for the description of the learning process. These indicators are usually the result of the transformation and processing of raw data. The definition and calculation of the indicators depend on the specific platform and educational context. A review of different learning indicators proposed in the literature has been presented by Dyckhoff [7]. An example of proposed indicators for a specific platform is given in [8] where higher level information indicators such as efficiency, hint abuser, or unreflective student were defined for the Khan Academy platform. One challenge regarding learning analytics for the edX platform is determining which indicators from the literature make sense to reuse in edX and which is the best way for their calculation out of the raw data provided in edX.
Using the information provided by these different indicators together with raw data, different useful visualizations can be generated so that teachers, students or other stakeholders could easily analyze and interpret the learning process. In this line, the Students Activity Monitor (SAM) [9] allows the visualizations of different charts by teachers and students, while CAMera [10] allows the visualization of contextualized attention metadata. Specific platforms such as Moodle [11] incorporate some learning analytics support by default, e.g. filtering of raw data depending on action types, times and activities. Although Moodle does not support powerful learning analytics visualizations by default, works such as [12] are able to present useful visual analysis in Moodle.
Regarding MOOCs, the Khan Academy platform [13] supports by default a powerful support for visualizations of different information such as the skill progress of each student (proficiency, in progress, struggling, not started), the achievement of skills during the time for each student, the time distribution spent in videos and exercises, or the visualization of different low level interactions. Nevertheless, other important visualizations related to different novel indicators are not present. For this reason, ALAS-KA, a new extension for learning analytics support in the Khan Academy platform was proposed, aimed at the presentation of different useful visualizations [14] which are not present by default in the Khan Academy platform.
One challenge regarding learning analytics in the edX platform is to analyze the different visualizations currently present in other platforms (such as the Khan Academy) in order to incorporate similar ones, whilst also including new visualizations that can make sense in edX because of their specific features.
In addition, the technical details should be taken into account at the time of implementing a learning analytics extension for edX, considering things like the way of storing raw data, the APIs for accessing data or edX architecture. In a similar way the technical details which need to be addressed in other platform such as Khan Academy can be different [15]. In addition, some technical details of edX have also been discussed for purposes other than learning analytics such as the implementation of serious games [16].
3.
LEARNING ANALYTICS IN EDX
This section presents useful information related to learning analytics in edX. First we present the type of raw data edX generates through the interaction of students. In addition, we review the current learning analytics support for the edX platform and some initiatives moving towards this direction.
3.1
Raw data
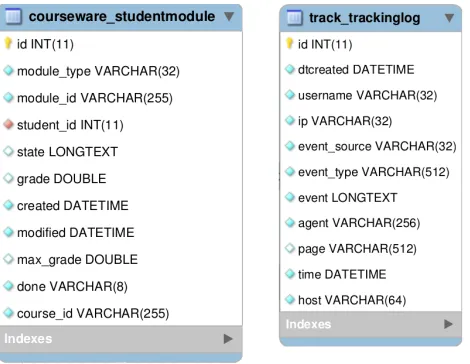
Courses structure educational activities and resources in order to support student learning. Courseware and students are the two main sources of information which can be found at the heart of the data layer and is key to the platform as a whole. Courseware data is divided into information related to the course structure and to the content. You may regard the course structure as the branches of a tree which are able to hold the leaves, where the leaves would represent the content itself. In a top-down hierarchy a course is divided into chapters, chapters contain sections, and sections are the place where content appears as a sequence. Every node (and that includes all branches and leaves) of the tree metaphor is referred to in edX as a module. EdX considers a module as any piece or collection of pieces of courseware. The state of each module is kept as a collection of key-value pairs. Whilst course data is created at the beginning of the course, student data student’s data is generated due to the interaction of students with the platform. Every time a student uses a module of courseware a new entry would be either added in case of first access, or updated if it had been previously accessed; this allows the system to keep track of the state for each module and student, which makes special sense for those modules which need to keep track of the current student status. The fields and the types of state entries are shown in the courseware_studentmodule table of edX in figure 1. If we take the example of a video, the state would save the position where the student left the video off and also the playing speed.
In addition, there is another data flow which is regarded as tracking logs. Nearly every interaction of students and instructors with the platform is registered as a tracking log. On the student side the event origin come from actions such as enrollment, logging in/out, navigational, video interaction, textbook, problem interaction, A/B testing or forum activity. The data format in which these events are stored is presented in the MySQL table
Figure 1. Two table examples in edX. The first table contains some of the variables related to an individual student’s state. The second table stores the tracking logs MySQL.
Figure 2. Tracking logs extract in edX.
This vast amount of information on students’ interaction with the platform is a potential gold mine for learning analytics, but data itself does not make a difference. To make use of this raw data it is needed a strong previous processing so that it can be of use for students and instructors; this advancement could become a powerful game-changing tool. It enables decision making and best practices propagation, thus it would make a difference in user experience while learning and teaching.
3.2
Current learning analytics support on
edX
Basic analytics are currently available at the platform. A basic page provides students with an overview of their progress in the platform so that they can keep track of their evolution during the course. This page consists of two parts: a progress graph and the same information in text and number format. Progress here is understood as graded problems completed. Problems are considered those contents in which grading makes sense such as homework, laboratories, essays, questions and so on. No grading policy is applied at this point. Figure 3 illustrates this progress graph with an example. The percentages of graded problems completed per chapter are represented in a bar graph. Ex 01, Ex 02
and Ex 03 in the horizontal axis refer to the three chapters, named
Example Week 1, Example Week 2 and Example Week 3
respectively, which belong to the edX's Demo course. As this is a chapter aggregation score, below the graph, the page on edX shows the student the detailed scores per modules where score apply.
Instructors are offered a “Course statistics at a glance”
subsection where apart from course technical information such as the number of descriptors for each module type, they can only retrieve the number of enrolled students. A beta dashboard version under development would display to instructors the following student distributions: per-problem scores, year of birth, gender and level of education. In general, most of this information could
be of interest from a demographical or sociological point of view, but remains short when we are dealing with learning analytics.
Figure 3. Progress graph example in the edX platform.
3.3
Initiatives for learning analytics on edX
The edX team is aware of the need to transform the available volume of raw data into information relevant to students and instructors5. The projects edX Analytics Service6 and Insights5have been the most visible efforts in this sense. Insights is defined as a Python+Mongo+Django framework for creating simple, pluggable analytics based on streaming events, according to its own homonymous GitHub repository. It is important to keep in mind that these are both projects in progress yet to be finished.
Insights is thought to work outside edX getting the information by reading database replicas. Insights will provide an API to handle these events at real time whenever they are triggered. Recently, the edX team has been working in the edX Analytics API Client7,
a tool that allows users to retrieve data from the edX data warehouse.
There is also an edX initiative for implementing A/B testing [17]. This initiative aims at giving two quite similar versions of a course but changing some features (e.g. the sequencing of the resources) and trying to measure which version worked better. This way, improvements can be done. As part of the A/B testing initiative, some visualizations are being proposed to compare both groups, such as visualizing students paths through the courseware. Moreover, proposals about the implementation of real time analytics in MOOCs have been presented with some visualization examples [18]. Specific cases of visualizations for the analysis of video interactions in edX have also been proposed [19]. Despite continued ongoing efforts to support edX with a variety of learning analytics resources, there is room for a lot of new functionality to be implemented. Here we identify a pressing necessity of providing a learning analytics extension of edX for the stakeholders in order to take advantage of the high volume of raw data available.
4.
OVERVIEW OF THE TECHNOLOGIES
AND ARCHITECTURE
Sub-section 4.1 makes a revision of Open edX architecture whilst section 4.2 presents our proposal for the learning analytics extension.
4.1
EdX architecture
EdX is composed by two main applications serving different purposes: the Content and the Learning Management System
5 https://github.com/edx/insights/ 6 https://github.com/edx/edxanalytics
(CMS and LMS respectively). The CMS is an authoring tool which is used in order to create courses for edX. The LMS is the environment for both instructors and students to teach and take the courses respectively. The connection of these two environments to the rest of the architecture is nearly symmetrical. We will pay attention to the LMS as it is the relevant one for the learning analytics purposes we pursue.
The LMS is based on the modularity principle. The different functionalities are covered by a variety of applications. This modular structure makes it simpler to develop new functionalities. The different applications are assembled so that they can interact with each other and with the system architecture. Our application for learning analytics fits well in this constellation as we will detail in the following sub-section.
Course data is moving towards splitting content and structure to facilitate reusing. Courseware is modeled across the architecture by entities known as XModules and XBlocks, which come with an API. XModules come from the original platform conception, but in order to overcome some intrinsic limitations, they are being replaced by the XBlocks. They can store states, render themselves as content ready for visualization, and handle user actions. XBlocks are designed to be a more powerful tool than XModules for third-party developers willing to extend the platform. Developers implement the new XBlock entities (they design the container), course authors create their contents or reuse those existing (they fill the container), and students use those contents in the learning process (they are the container consumers).
4.1.1
Technologies
EdX is supported by an eclectic variety of technologies, which have been put together with scarce and sparse documentation. This problem acts as an entry barrier for those newly developers starting to work on Open edX. The development environment installation has been significantly improved over time, as the result of receiving developers’ feedback through forums, the appearance of troubleshooting notes and simplifications derived from newer versions of the platforms. It could still however be a non-straightforward process and you may need to consult workarounds and forums, as well as rely on your own expertise or empirical knowledge. The Virtual Box tool is used to host the development environment and Vagrant is the tool chosen to build the development environment. They provide the developer with an easy way to replicate the development environment in order to be able to work under the required conditions.
EdX is a project which has been built using the web framework Django. The Django project is made out of a variety of functional units, i.e. Django applications. Django is written in the Python programming language and you need to be familiar with that to develop on edX. Taking into account that edX is a web application, it also contains web technologies like HTML, CSS and JavaScript and also Mako templates.
4.1.2
Data persistence
EdX uses two database engines: MySQL and MongoDB. MySQL is a relational database comprised of tables whereas MongoDB stores collections of BSON (Binary JSON-JavaScript Object Notation) documents. Course-related information is saved in a MongoDB collection. Student-related data is stored in MySQL tables.
Django natively supports MySQL. It comes by default with some built-in tables, being the most representative those containing user authentication information. Django provides a database
abstraction and an API for data manipulation. Django does not natively support MongoDB. In order to access the document collections stored in MongoDB, developers can use the XModule API, or XBlocks when they are fully integrated. Direct access to MongoDB contents is also possible through Python library
pymongo. Free tools could be used to access and visualize the databases from outside edX platform, such as MySQL Workbench
and Robomongo.
4.2
Our learning analytics extension
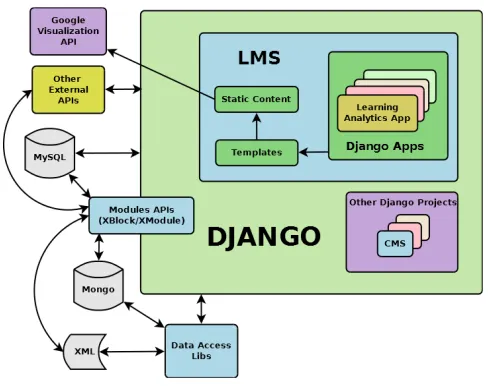
We can observe in figure 4 the location of our learning analytics application inside edX architecture. It fits well as just a new application among a number of already existing ones. As we have seen before, the edX architecture is a very complex one, therefore the architecture figure we present is a simplification, and some components that we are not using for our extension are omitted.
Figure 4. Learning analytics application inside edX architecture.
EdX application uses Django web framework to implement most of its components, which makes edX a very modular and reusable application. Thanks to this modularity, we have been able to use many parts of edX for our extension. Our learning analytics extension has been included as a new Django application inside the LMS. As part of the application we have implemented a first layer equipped with an API to retrieve low level data; this layer uses different tools that edX already provides in order to access MySQL, MongoDB or XML files. This API is able to query the databases regardless of their underlying technologies, thus facilitating to search for course structure, enrolled students and graded problems, attempts at solving activities or tracking logs events for a certain student given a course. In other words, this primary layer is aimed at providing an easy way to organize and retrieve course and student data.
the entire course. This is the most important layer of the application because it transform non meaningful data into information that can be used. There are many parameters in the literature that can be implemented here if adapted to edX functionalities.
The last and outer layer of the extension handles the presentation of the visualizations. This layer receives the information which have been previously processed in order to present it by graphics or plain numbers. The user receives a new tab in their horizontal top menu where he can access to these visualizations. Most of the visualizations are made in JavaScript, by means of the Google Charts API8, which supports interactivity. This API provides a
wide selection of charts that are easy and immediate to use. In addition interactivity functionalities provide of a good user experience for the user and the possibility of providing additional information.
4.2.1
Installation and use
The learning analytics extension is easy to append in any Open edX platform. The developer just needs to include the Django application, templates and static content folders in their LMS project, and add the application to their project configuration file. Using this extesion is simple too; users have a tab in their courseware where they can consult certain visualizations depending on their role in the course (student or course staff). Students will have access to a set of visualizations; mainly processed using their individual data, but some of the visualizations will allow a comparison between students or the whole class too.
Course staff will be able to access a wider range of visualizations. On the one hand they will be able to access visualizations using the data of their students individually, and on the other hand they will have access to a broader level of statistics, using the data of the whole course, which can be really helpful for course feedback. Given that the number of students in MOOCs can be really large, individual statistics can be sometimes not that useful for the instructor. To improve this issue, the visualization system will provide to the instructors the possibility of filtering and ordering by grade, previous studies, age and other attributes.
4.2.2
Lessons learned
The edX team have put a lot of effort into capturing most of the events of users when using the platform. The list of events is often revisited and new events are added to the tracking logs. Therefore the system is prepared to develop much further and complex analytics, but still the implementation remains undone. Anyhow everything points into the direction that a strong learning analytics support will be available in the next few years.
Regarding implementation, despite the ease of development that edX modularity offers, we had to face some issues during development. The first problem most developers will find when starting to develop in edX platform is the size of the project. EdX is a big project, and although most parts of the project are pretty well documented, some of the newer ones are not. The cause of this issue is related to other problem, the constant development of the platform, leading to frequent changes in modules or APIs. These two issues are common in open source software development, but in contrast they have many advantages. To solve these problems, it is recommended to study the platform code, in
8 https://developers.google.com/chart
order to understand the structure of the code, before starting the development. Understanding the architecture of the platform will help you design your extension in a way so that it is easy to adapt your code to any future changes in edX platform.
Another issue we had to face was the massive amount of data some of our visualizations needs to process. Since edX platform is a MOOC platform, we will have a large amount of data samples to work with, making statistics involving hundreds or thousands of students makes impossible to serve visualizations in real time. The easiest solution we found to this issue was to use a task scheduler tool, to process the statistics in a reasonable period. In our case, we decided to use Celery9 as it is easily integrated with
Django, and it is used in others parts of edX project. Developers wishing to contribute in the edX project will face some problems, but the potential work possible here makes these issues worth the effort.
5.
VISUALIZATION EXAMPLES
A MOOC produces a huge amount of raw data, which is hardly understandable by instructors and students as well. The learning analytics extension under development is focused on giving instructors and students an easy way to process that large amount of data and present it in a simple and accessible way for feedback. Individual information will be included in the extension we are working on too as an insightful feedback to the learning process stakeholders. The extension will provide different types of visualizations regarding information related to course modules like exercises, videos, textbooks, and students interaction with them.
The users of the platform could benefit from using this extension in many ways. Instructors could use visualizations to receive an overview on how the course is progressing, or detecting global issues affecting the whole course. In addition, they can monitor each student individually (or by different population groups like age or previous studies), being able to intervene when necessary if some students are doing poorly, thus preventing dropouts. Students can take advantage of the extension too, mainly by increasing their self-awareness about their work, but also by comparing their results with the rest of the course.
5.1
Progress distribution of students per type
of assignment
This first visualization is a stacked bar graph showing the number of students who have failed, pass, pass with honors or have not done any of the different graded sections on a course (at this point edX supports three different categories: homework, laboratories or exams). As we can see in figure 5 the information is presented in a simple and clear way so that instructors can easily analyze the results. The course staff can notice quickly if students are having problems with any specific section. For instance, in this case, the instructor could note that homework grades are higher than the ones for the midterm exam, which is normal. But by looking at the final exam results we can see that the grades are even higher than those of the homework, although participation in this exam was much lower. Lab participation is pretty low too.
The feedback provided by the information of these visualizations can be extremely important in order to modify sections for future releases of the course, or even fix issues while the course is being offered. In case the instructors need more specific information, the
graph has some interactive functions, as tips on hover, or breakdown by categories by clicking on them. The instructor can access more detailed information about each type of assignment by clicking on it. Figure 6 shows the result of breaking down the homework category into the different sub-sections which compose it.
Figure 5. Graph distributing students by grade.
Figure 6. Interactive functions on visualization.
Having access to each homework sub-section separately gives the instructors the possibility to check if any of the subsections are especially difficult. Instructors can revise each section separately in order to correct the difficulty if necessary. Cases like ‘HW2’ or ‘HW5’ where most of the students have very high or very low grades, suggest that there might be some design trouble, and this way instructors can note them out easily. In addition, instructors can check if students are dropping out in case they have stopped accessing the assignments.
5.2
Distribution of time per chapter and
activities
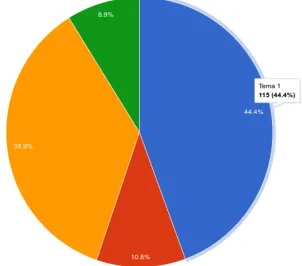
A second example is presented in figure 7; this visualization is a pie chart displaying the time spent per each chapter of the course. This is an aggregated visualization for instructors, representing the total time spent by all of the students enrolled in the course. This gives teachers an insight of the most time consuming chapters and help them determine balance irregularities among different chapters. The natural distribution of this chart would be a decreasing percentage of time when moving from first to last chapter. This is due to the fact that MOOCs have a very high drop-out rate, so many students will not finish the course. As a result of interactivity, by clicking in any chapter, for example in
the blue area corresponding to the first chapter, the graph takes the form showed in figure 8. The time spent in the clicked chapter is split into graded problems (which appears in blue) and the rest of activities where grading does not make sense (which appears in red) like videos, theoretical explanations, textbook readings. The rest of the chapters (which are the grey portions) remain the same.
Figure 7. Distribution of time per course chapter
Figure 8. Distribution of time in the different activities (graded and non-graded) of a chapter
These visualizations are about the entire class but individual users might show different time behaviors. You can find students who drop-out but also others who finish the course and spend more time per chapter as course progresses, mainly driven by motivation and contents complexity, which tends to increase in most courses. A different type of student can be for those who only visit the chapters that are attractive for them, they do not complete the entire course but only parts of it. In any case, instructors should take their own conclusions taking into account more information provided by these visualizations.
6.
CONCLUSIONS AND FUTURE WORK
MOOCs have acquired a very high level of importance in the last few years. However, most of the MOOC platforms do not have a powerful learning analytics support, which makes very difficult for instructors and students to make sense of raw data and learn about what is happening. EdX's current support for learning analytics is insufficient. In this paper we have presented our first steps towards our learning analytics extension to edX. We have provided some guidelines, technical issues, lessons learned and visualizations towards a new learning analytics extesion on Open edX. The development on Open edX is quite challenging due to the fact that is a very fast changing platform which combines different technologies.As a near future work, we aim at defining and calculating some interesting higher level indicators on the edX platform about the learning process, as well as the correspondent visualizations based on these indicators. We will use other related works about indicators but also our new ideas to analyze which indicators and visualizations will be implemented for edX.
We are still working on developing new visualizations that can improve the learning process for students and teachers when taking MOOC courses using Open edX. In the future we would also like to obtain feedback by making an evaluation of our tool with instructors and students taking MOOC courses. In addition, we want to carry out some statistical analysis using the data provided by our learning analytics extension. Finally, we would like to implement a recommender system which for example could prevent students from dropping out or encourage good behaviors for learning.
7.
ACKNOWLEDGMENTS
Work partially funded by the EEE project, "Plan Nacional de I+D+I TIN2011-28308-C03-01" and the "Emadrid: Investigación y desarrollo de tecnologías para el e-learning en la Comunidad de Madrid" project (S2009/TIC-1650)".
8.
REFERENCES
[1] Bach, C. (2010). Learning analytics: Targeting instruction, curricula and student support. Drextrel University. Retrieved from
http://www.iiis.org/CDs2010/CD2010SCI/EISTA_2010/Pap ersPdf/EA655ES.pdf
[2] McAuley, A., Stewart, B., Siemens, G., & Cormier, D. (2010). The MOOC model for digital practice. Retrieved from
https://oerknowledgecloud.org/sites/oerknowledgecloud.org/f iles/MOOC_Final_0.pdf
[3] O’Donnell, J.J. (2012). The future is now, and has been for years. The Chronicle of Higher Education, 59(2). Retrieved from http://search.proquest.com/docview/1038136427 [4] Shumski, D. (2013, August 15). MOOCs by the numbers:
How do EdX, Coursera and Udacity stack up?. Retrieved from http://www.educationdive.com/news/moocs-by-the-numbers-how-do-edx-coursera-and-udacity-stack-up/161100/ [5] Wikipedia page for edX- http://en.wikipedia.org/wiki/EdX [6] Breslow, L. Pritchard, D. E. DeBoer, J. Stump, G. S. Ho, A.
D. and Seaton D. T. Studying Learning in the Worldwide
Classroom: Research Into edX's First MOOC, RPA Journal, June 14, 2013
[7] Dyckhoff, A.L., Lukarov, V., Muslim, A., Chatti, M.A., Schroeder, U. (2013) Supporting Action Research with Learning Analytics. Proceedings of the Third International Conference on Learning Analytics and Knowledge (LAK 2013), 220-229
[8] Muñoz-Merino, P. J. Ruipérez, J. A. & Delgado, C. (2013). Inferring higher level learning information from low level data for the Khan Academy platform. Proceedings of the Third International Conference on Learning Analytics and Knowledge (LAK 2013), 112–116
[9] Govaerts, S., Verbert, K., Klerkx, J., Duval, E. (2010). Visualizing Activities for Self-reflection andAwareness.
Proceedings of the 9th international conference on Web-based Learning, pages 91–100.Springer, 2010
[10]Schmitz, H., Schefel, M., Friedrich, M., Jahn, M., Niemann, K., & Wolpers, M., (2009). CAMera for PLE. Learning in the Synergy of Multiple Disciplines. Proceedings of the 4th European Conference on Technology Enhanced Learning: Learning in the Synergy of Multiple Disciplines, 507-520. Berlin, Heidelberg: Springer-Verlag. doi:10.1007/978-3-642-04636-0_47
[11]Moodle, https://moodle.org/
[12]García-Peñalvo, F. J., Conde, M. Á., Bravo, S., Gómez, D. A., & Therón, R. (2011). Visual Analysis of a Moodle-based Object Oriented Programming Course. International Journal of Computers Applications. Proceedings on Design and Evaluation of Digital Content for Education (DEDCE), 8-14. Retrieved from
http://www.ijcaonline.com/dedce/number1/dece002.pdf [13]Khan Academy, https://www.khanacademy.org/ [14]Ruiperez-Valiente, J.A., Muñoz-Merino, P.J., Leony, D.,
Delgado Kloos, C. (2014). ALAS-KA: A Learning Analytics Extension for Better Understanding the Learning Process in the Khan Academy Platform. Computers in Human Behavior, Accepted for publication
[15]Ruipérez-Valiente, J. A. Muñoz-Merino, P. J., Delgado, C. (2013). An architecture for extending the learning analytics support in the Khan Academy framework. Proceedings of the 1st International Conference on Technological Ecosystem for Enhancing Multiculturality, 277–284. ACM, Salamanca [16]Freire, M., del Blanco, A., Fernández-Manjón, B. (2014).
Serious Games as edX MOOC Activities. Proceedings of the IEEE Global Engineering Education Conference
(EDUCON), 867—871
[17]edX A/B Testing, https://github.com/edx/edx-platform/wiki/Split-Testing
[18]Seaton, D.T., Bergner, Y., Chuang, I., Mitros, P., Pritchard, D.E. Towards Real-Time Analytics in MOOCs (2013) IWTA@LAK, volume 985 of CEUR Workshop Proceedings, CEUR-WS.org