J. A. Ruipérez-Valiente; P. J. Muñoz-Merino; J. A.
Gascón-Pinedo; C. D. Kloos, "Scaling to
Massiveness With ANALYSE: A Learning
Analytics Tool for Open edX," in IEEE
Transactions on Human-Machine Systems,
vol.PP, no.99, pp.1-6
DOI: 10.1109/THMS.2016.2630420
http://ieeexplore.ieee.org/document/7774979/
Scaling to Massiveness with ANALYSE:
A Learning Analytics Tool for Open edX
Jos´e A. Ruip´erez-Valiente, Pedro J. Mu˜noz-Merino,
Senior Member, IEEE
, Jos´e A. Gasc´on-Pinedo and
Carlos Delgado Kloos,
Senior Member, IEEE
Abstract—The emergence of Massive Open Online Courses (MOOCs) has caused a major impact on online education. However, learning analytics support for MOOCs still needs to improve to fulfill requirements of instructors and students. In addition, MOOCs pose challenges for learning analytics tools due to the number of learners, such as scalability in terms of computing time and visualizations. In this work, we present different visualizations of our ‘Add-on of the learNing AnaLYtics Support for open Edx’ (ANALYSE), which is a learning analytics tool that we have designed and implemented for Open edX, based on MOOC features, teacher feedback and pedagogical founda-tions. In addition, we provide a technical solution that addresses scalability at two levels: first in terms of performance scalability, where we propose an architecture for handling massive amounts of data within educational settings; and, second, regarding the representation of visualizations under massiveness conditions, as well as advice on color usage and plot types. Finally, we provide some examples on how to use these visualizations to evaluate student performance and detect problems in resources.
Index Terms—Learning Analytics, Human Machine System, Open edX, MOOCs, Information Visualization
I. INTRODUCTION
O
NLINE education has been gaining importance over the last decade. In this context, edX is a non-profit venture with the general objective of improving online learning. More than 500 MOOCs have been delivered in edX with more than 5 million students. In June 2013, they open sourced the software as Open edX1and at the moment it is being used by more than150 external institutions [1]. However, the learning analytics support for the platform is still in its first steps. The main initiative developed by edX team is Insights, which provides an external source of analytics for instructors. Additionally, the community is starting to develop their own approaches such as real time analytics of the raw events using a ELK stack [2]. Since the MOOC phenomenon started, there has been a lot of retrospective analysis on how students did on a MOOC, e.g. on the very first MOOC delivered by edX on “Circuits and Electronics” [3]. The objectives of the research on MOOCs have been very diverse and trying to delve into how students learn, for example predicting MOOC performance using click-stream data [4] or to measure the effectiveness of students
Jos´e A. Ruip´erez-Valiente, Pedro J. Mu˜noz-Merino, Jos´e A. Gasc´on-Pinedo, and Carlos Delgado Kloos are with the Telematics Departament, Universidad Carlos III de Madrid, Av. Universidad, 30, 28911, Legan´es (Madrid) Spain, e-mail:{jruipere@it, pedmume@it, jgascon@pa, cdk@it}.uc3m.es
Jos´e A. Ruip´erez-Valiente is also with IMDEA Networks Institute, Av. del Mar Mediterr´aneo 22, 28918, Legan´es (Madrid) Spain
Manuscript received June 16, 2016; revised September 26, 2016.
1https://open.edx.org/
with educational resources and activities [5]. However there are also well-known problems in MOOC teaching that have been explored, such as the very high dropout ratios and how these can be reduced based on machine learning methods [6], and academic dishonest behaviors [7].
The work hereby presented goes into the direction of visual analytics. We can find in the literature many visualization tools for different virtual learning environments and distinct types of visualizations and learning indicators. For example, TrAVis [8] is a tool that helps students to analyze and eval-uate their own activities while learning online with computer mediated communication tools. TrAVis displays indicators in radar charts where students can compare their activity with others, which is different from our approach, where students can access only their own data. Another visualizations tool is GISMO for Moodle [9], which provides visualizations related to students activity in quizzes, forums and other learning resources. CourseVis [10] is another visualization tool, in this case for the WebCT; instructors can visualize different indicators, some of which are also similar to ours, such as number of accesses to each page of a course or progress with the course schedule. There are not many visualization tool initiatives on MOOC platforms. The main reasons for this may be that these platforms are fairly new and also the massiveness of these courses makes the processing of vast amounts of data more challenging. In this direction, we can find ALAS-KA platform [11], which extends the learning analytics function-ality of the Khan Academy platform with more than 20 new visualizations. Some ALAS-KA visualizations are similar to ours, such as the idea of video progress.
MOOCs are a new paradigm and new scalability issues arise in these environments, which should be addressed in visual an-alytic modules. In this paper we present our learning anan-alytics tool ANALYSE2 for Open edX and describe its architecture
and design. More specifically our main contributions are the following:
1) We provide a technical solution of a learning analytics module for MOOCs which addresses scalability at two levels: processing tasks and visualizations.
a) Provides a performance scalability solution, in which an architecture is proposed for handling massive amounts of data within the educational context.
b) Provides an interface scalability solution for representing the visualizations under massiveness conditions in educational environments, as well as advice on color usage and plot types.
features, teachers feedback, pedagogical foundations and re-lated work.
3) Open edX did not have an integrated learning analytics module, we have open sourced ANALYSE so that it can be used by stakeholders within the Open edX community.
II. SELECTION OFVISUALIZATIONS
The first step for the implementation of ANALYSE was the selection of visualizations for the dashboard. This decision has been based on several aspects and we follow the following order of steps for making the decisions:
• An analysis of the main components and features in xMOOCs (which have a traditional and clear syllabus structure with recorded lectures and problems), as well as other possible measures of activity such as time or accesses. The two main components in xMOOCs, which are,were identified, these are videos and exercises. Therefore, the indicators are focused mainly on these two elements.
• The feedback received by teachers about what they need about these two components (videos and exercises) and related to the activity of students. Overall instructors want to know about the students’ performance, their effort on the platform, the videos that were accessed more frequently, the number of videos completed by the students, and being able to combine different indicators and analyze the activity of students to enable the detection of problems in students, educational resources and sections of a course.
• Our own analysis of why these visualizations might be useful according to pedagogical guidelines as well as based on our previous experience analyzing and visualizing educational data in virtual learning environments. As general guidelines we decided to have different separated indicators for videos and exercises that give insights about the amount of use of the resources but also about how well the student interacted with the resources. In addition, we included visualizations that combine several indicators of videos and exercises to be able to extract conclusions as a result of that combination.
• An analysis of learning analytics dashboards in MOOC
platforms such as Khan Academy or edX Insights and also research studies showing learning analytics dashboards such as TrAVis [8], GISMO [9], CourseVis [10] or ALAS-KA [11].
III. ARCHITECTURE FORPERFORMANCESCALABILITY
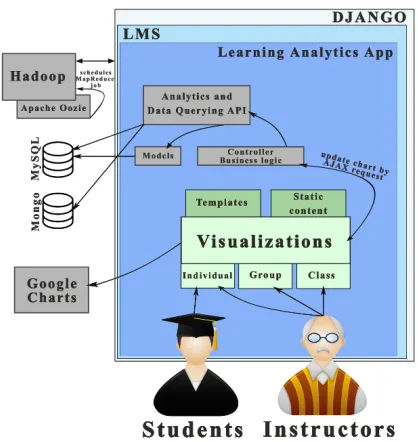
Open edX is a project built using Django web framework, which is composed of a mix up of technologies. There are two main Django projects, which supply different functions: the CMS and the learning management system (LMS). MySQL and MongoDB engines are used for data persistence.
A. Overview of the System
ANALYSE is included within the LMS as a new Django ap-plication with its own templates and static content files. Figure 1 presents an overview of ANALYSE and how is connected with other components within the Open edX ecosystem. The main components are:
Fig. 1. Overview of the architecture of ANALYSE tool.
• Users: Students are the ones who interact with the learning contents and generate the raw data. Instructors are in charge of creating the learning contents and the course, as well as keeping track of how students are progressing.
• Analytics: Due to the massiveness of MOOC environments and the large amount of metrics, the processing cannot be per-formed in real time whenever there is a request. The solution is a system that can perform the processing of indicators as a background task and store the results, as it is further explained in Subsection III-B.
• Visualizations: The last step is to provide useful and
effective visualizations to students and instructors, regarding the information of the indicators that have been processed. Students can only access information related to them while instructors can access the information of each student individ-ually or aggregates of the entire course. We use the Google Charts API3 for visualizations.
B. Computing Time Scalability
We use a Hadoop4 pipeline with a MapReduce job for parallel processing and it is optimized for the educational setting that we are dealing with. We use Apache Oozie5 to periodically run the MapReduce job in Hadoop which processes all the indicators for each course. We have designed two main techniques for improving computing time scalability which are a specific method to acquire new events and a MapReduce job as we describe next:
Acquisition of new events: The first step is the acquisition of new events (tracking logs) that require processing. We acquire only the new events that have been generated since the last time the MapReduce job was triggered. Many of the metrics provided by ANALYSE are aggregates that can be
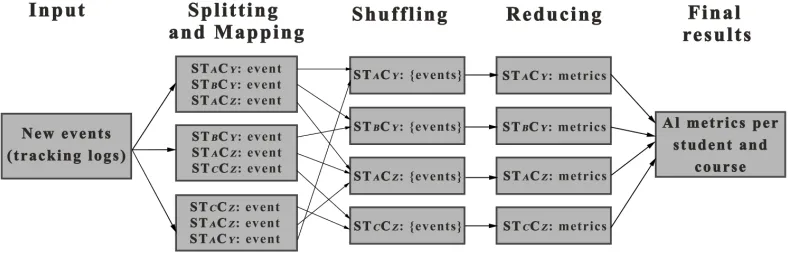
Fig. 2. Overview of the MapReduce job executed by Hadoop that processes each metric per student and course.
calculated without information regarding the previous events of students, e.g. number of accesses to each section of the course does not need previous events, only the previous number of accesses calculated by the last execution of the job. However some metrics might need previous events, e.g. to calculate the progress in videos you need to know the previous intervals watched by students, so specific mechanisms need to be addressed for these metrics. If we would process all events each time the job is triggered, we would see how the analytics computing time would significantly increase over time at a similar pace as the number of events within the system increases, while this way we manage to maintain the processing time almost stable over time.
MapReduce job: Where there is a large problem pattern that can be split in smaller isolated problems, then MapReduce is often a good candidate to solve the problem. In our case scenario, we can use MapReduce to divide the processing of the metrics per student and per course, thus this provides the possibility of distributed and parallel computing. The job is executed in regular intervals and the execution is controlled by the scheduler Apache Oozie. Once the job is finished, the final results are stored in MySQL each time the job is executed, so that the visualizations module can retrieve the needed information for a quick display. Figure 2 represents an overview the process cycle that follows the MapReduce job, we describe the specific steps next:
1) Input: New events as explained previously.
2) Splitting and mapping: This second steps first splits the data into the different Hadoop clusters. The Map function receives the raw tracking logs and its job is to clean the events, i.e. remove unnecessary data from the logs and put them into an adequate format to facilitate the later processing, as well as remove not valid or not needed tracking logs. Finally it outputs the data in the necessary{key, value}format for MapReduce, in which the key is generated as the student i and course j
(STiCj) andvalueis the event.
3) Shuffling: The output of the Map function is shuffled so that all events belonging to the same key STiCj go to the same Reduce function.
4) Reducing: The Reduce function receives all the events be-longing toSTiCjand processes all the metrics that ANALYSE provides in the visualization dashboard, eventually emitting the results of all metrics forSTiCj.
5) Final results: The final results from all students provided by the Reduce functions are stored in the MySQL database to be quickly retrieved when required by the visualization dashboard.
IV. INTERFACESCALABILITYDESIGN
The MOOC phenomenon implies a new paradigm of mas-siveness, which has implications in the way that visualizations need to be designed because they must be useful under massiveness conditions. Next, we analyze the implications of this massiveness for the proposed visualizations and the actions and design criteria based on them:
• Resources: The main MOOC resources are videos and exercises. Typical MOOCs have a total number of videos and exercises between 20 and 100. Therefore, it is not practical that a visualization includes all the details of all videos and exercises at the same time since this is too much simultaneous information for the users of the tool and because of the space limit on the screen. Studies have shown that the amount of items that can be perceived and compared in information visualization is limited, reporting seven (plus or minus two) as a good choice [12], we have established an initial maximum number of eight resources to be represented in the same graph. For a more flexible approach, we enable that the number of resources represented in each graph can also be selected by the teacher or the student. We apply the same idea when showing other measures of activity such as the time per day. Additionally, we plan to enable in the future sorting by different variables in some visualizations, e.g. to show the ‘Top 10’ problems where students spent more time.
• Sections/subsections: The total number of sections or sub-sections is not usually high and often ranges from 3 to 12. In this case, we can represent all the information for each of these elements at the same time since the total number is not too high and the information can be represented in one graph.
efficient with that many students; this search can be seen in Figure 3d.
• Video time: To effectively represent information regarding
video use can become a challenge taking into account that each video can have a different duration. This issue is solved by scaling the maximum length of a video to a percentage, and fitting it to a graphical representation that allows comparison among videos.
• Video events: The events that a learner performs on a video (play, pause, rewind, etc) are stored and represented. Our experience pointed out that a precise and clear representation of the events for just an individual learner is feasible since the generated events are not too many and this is understandable in a graph. But when there are many students, the aggregated data becomes hardly understandable when represented as in-dividual events. The proposed solution is to estimate a density distribution per each type of event, and then represent it over the video length.
V. INTERFACEDESIGNPRINCIPLES
This section presents an overview of the interface and the criteria applied for its design. We follow the general principle that “Everything should be made as simple as possible, but not simpler” [13]. We note out that this dashboard is used by instructors and students, not researchers, thus we want them to easily interpret and use the information provided effectively. We have developed 12 visualizations that have been divided into three different sections that match the main components and features in xMOOCs explained in Section II, those are related to exercises (3), videos (4) and course activity (5). We have implemented a similar selection interface that is also used in the ‘Instructor’ page at Open edX so that the theme does not stand out with respect the rest of the platform. An example of the interface showing the Course Summary graphic and the sections of a visualization is provided in Figure 3a. The interface divides each visualization into the following three sections:
• Description and selection of options: This section includes a description of the information that is transmitted by the visu-alization. In addition, we can find selection boxes, which allow for the selection of different options for the visualizations.
• Visualization: The graphics are generated using Google
Charts library. This API provides a certain level of interaction, for example, popping up information when passing a mouse over a visualization. We have configured tooltips that are dis-played to provide information such as units, which facilitates the understanding by instructors and learners.
• Legend: The last section is the legend of the visualization. We have generated the legends using HTML elements since this allows a higher degree of flexibility upon changes.
Additionally, there are two main areas of design principles that have been addressed based on existing research literature as well as our previous experience with MOOCs:
• Graph type selection: We have prioritized the use of the same type of graphs as often as possible. In the case that there is a time dimension, this is represented by the x-axis,
evolves over time. The other situation is when we wish to compare an indicator across different categories (e.g. time spent in different exercises), in that case we always use bar charts where each bar represents a category, and the categories are ordered by the course location; this is considered as a good practice in several data visualization guides [14], [15]. This graph selection allows us to display the different categories within a plot under the same colors, and then we are able to distinguish different sources of information across the entire interface by using different colors. This strongly helps instructors and learners to understand with a quick glance which source of information is being visualized in each plot.
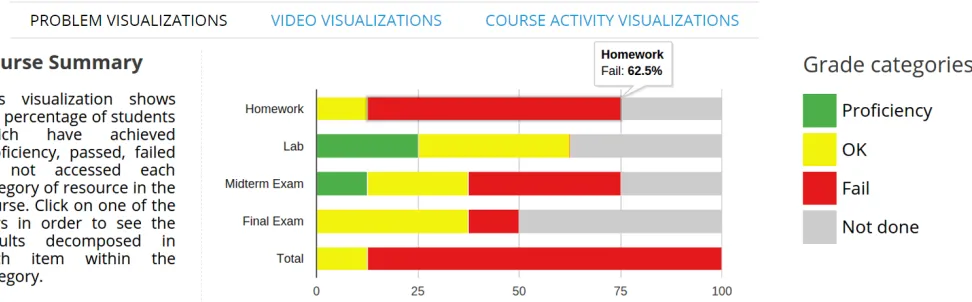
• Color criteria: A good choice of colors can help the users of a system to detect interrelations and patterns within data easily [16]. We have defined a qualitative color palette based on complementary colors to distinguish different sources of information, this is usually a good choice since is both aesthetically pleasing and functional [17]. We have selected 6 different primary colors for the palette and one additional neutral color, which are for the following sources of informa-tion: Green for proficient exercises (#4DAF4A, grade above 0.75), yellow for OK exercises (#F2F20D, grade between 0.75 and 0.5), red for failed exercises (#E41A1C, grade below 0.5), blue for exercise activity indicators (#377EB8), orange for video activity indicators (#FF7F00), purple for course activity indicators (#984EA3) and gray for neutral information (#CCCCCC). The use of colors to connect different types of information presented in an interface is recommended [18]. For variations across the same source of information, we slightly modify the hue of the primary color representing that source of information. Additionally, for completely different information in some cases, we have used independent colors.
VI. VISUALIZATIONS
We present here some examples (Figure 3) of the visu-alizations and how to interpret this information under the pedagogical context of online courses using Open edX. We note out again that instructors can access information for all students, and also select the information of each student individually in all the visualizations. Students can access only their own information for self-awareness.
• Course Summary: This visualization shows the percentage of students that achieved proficiency, passed OK, failed or have not done the graded sections of each chapter of the course. Figure 3a shows an example of the visualization, which main pedagogical contribution is to be able to analyze how the class is progressing in each one of the chapters of the course. It is also possible to click in and get the same information for each assignment within the chapter separately. This could be used also to detect problems in different chapters or specific graded resources.
(a) Example of the dashboard for instructors of ANALYSE showingCourse Summaryvisualization for all students within the course.
(b) Eight problems selected for all students. (c) Three videos selected for student ‘Paloma’. (d) Intervals for ‘Video 1’ by student ‘Paloma’.
(e) Events for all students in a certain video. (f) Selection of dayly time for a certain student. (g) Distribution of chapter time for all students.
Fig. 3. Examples of different visualizations provided by ANALYSE. Visualization for exercises a) and b) showCourse SummaryandProblem Time Distribution
respectively, visualizations for videos c), d) and e) showVideo Time Watched,Repetition of Video Intervals, andVideo Events Distributionplots respectively, finally visualizations for course activity f) and g) showDaily Time on Problems and VideosandChapter Timeplots respectively.
in which problems students invest more time, e.g. Figure 3b shows an example in which students have invested a lot of time in ‘Problem 3’ whereas students can use it for self-reflection.
• Video Time Watched: This visualization shows for each video resource the percentage of ‘total video time’ (orange) which measures all the time spent in the video, and ‘different video time’ which takes into account only different parts (light orange). The rationale is to compare both metrics to have an idea about if students are repeating certain parts of a video, since that might indicate difficulties in understanding the material. Figure 3c shows an example where for student ‘Paloma’ in ‘Video 1’ some parts have been rewatched since ‘total video time’ is much higher than ‘different video time’
whereas in the other two videos no parts were rewatched since both metrics are the same.
• Repetition of Video Intervals: This visualization shows the number of times that each second of a video has been watched. When showing information regarding all the class, it can be used to detect problems in videos. When analyzing each student individually, instructors can infer that some students might be having problems, e.g. Figure 3d shows that student ‘Paloma’ has a peak of visualizations in the middle of ‘Video 1’, that might indicate that the student is struggling with a concept there and she has repeated that interval several times.
Instructors can use this information to detect problems in resources, e.g. in Figure 3e we can see a high density of ‘seek from’ around second 60, and a high density of ‘seek to’ around second 45, which means that students often seek backwards around that time, and it can be related to some issue with the video. This visualization uses a different palette of colors so that they can be distinguished from the primary colors used in the rest of the visualizations.
• Daily Time on Problems and Videos: This visualization shows the amount of time per day split by exercise and video time. Learners and students can select the range of dates that they wish to plot. This can be used to control the amount of time invested by all students or each one individually, as well as for self-awareness in the case of students. An example can be seen in Figure 3f where we can see that in some days the student tends to spend more time watching videos than solving exercises, and vice versa.
• Chapter Time: This visualization shows with a stacked bar
chart the amount of time spent in each one of the chapters of the course and it is split in graded, ungraded and chapter time. The idea is to be able to see the distribution of time by chapter and type of resource done by students. Figure 3g represents an example of this visualization for all the students within the class where we can see that most of the time in each chapter has been invested in graded items.
VII. CONCLUSIONS
In this work we have presented the specific architecture of ANALYSE, a learning analytics dashboard for Open edX which includes 12 new visualizations and is one of the first visual analytics modules for MOOCs. The main contributions are regarding the specific design we have implemented in order to scale to the massive amount of students often found in MOOCs; this includes both solutions in terms of the analytics but also interface and visualizations design. In addition, we have provided initial guidelines and examples for how these visualizations can be used to control the status of a class and all students in a class and also detect problems in resources such as videos.
Finally, we are releasing the tool as open source so that it can be used by the large community using Open edX for their educational experiments. We have made minor changes in the Open edX source code, for example, adding a new learning analytics tab in the LMS interface. Therefore, the installation of the learning analytics application is easy, and it does not have implications regarding the base functionality of Open edX. ANALYSE has been released under an AGPL license in a public GitHub repository6. Our expectations are to keep this learning analytics application updated and also to receive participation from other Open edX developers to keep improving the learning analytics module. A video of our last release can be consulted online7.
6https://github.com/analyseuc3m/ANALYSE-v1 7https://youtu.be/4zO3Z0fcgmw
This work has been supported by the “eMadrid” project (Regional Government of Madrid) under grant S2013/ICE-2715, the “RESET” project (Ministry of Economy and Com-petiveness) under grant RESET TIN2014-53199-C3-1-R, the “COMINN” project (Spanish Ministry of Economy and Com-petiveness) under grant IPT-2012-0883-430000 and the Eu-ropean Erasmus+ SHEILA project under grant 562080-EPP-1-2015-BE-EPPKA3-PI-FORWARD. We would also like to thank H´ector Pijeiera, Javier Santofimia and Javier Orcoyen who participated in the development of the first version of ANALYSE
REFERENCES
[1] B. Porter, M. Haseltine, and N. Batchelder, “The state of Open edX,” inThe Open edX Conference, 2015.
[2] F. Montoya, “Real Time Analytics Using the ELK stack,” inThe Open edX Conference, 2015.
[3] L. Breslow, D. E. Pritchard, J. DeBoer, G. S. Stump, A. D. Ho, and D. T. Seaton, “Studying Learning in the Worldwide Classroom: Research into edX’s First MOOC,”Research and Practice in Assessment, pp. 13–25, 2013.
[4] C. Brinton and M. Chiang, “MOOC Performance Prediction via Click-stream Data and Social Learning Networks,” in IEEE Conference on Computer Communications. IEEE, 2015, pp. 2299 – 2307.
[5] P. J. Mu˜noz-Merino, J. A. Ruip´erez-Valiente, C. Alario-Hoyos, M. P´erez-Sanagust´ın, and C. Delgado Kloos, “Precise Effectiveness Strategy for analyzing the effectiveness of students with educational resources and activities in MOOCs,”Computers in Human Behavior, vol. 47, pp. 108– 118, 2015.
[6] M. Kloft, F. Stiehler, Z. Zheng, and N. Pinkwart, “Predicting MOOC dropout over weeks using machine learning methods,” inWorkshop on Analysis of Large Scale Social Interaction in MOOCs, 2014, pp. 60–65. [7] J. A. Ruiperez-Valiente, G. Alexandron, Z. Chen, and D. E. Pritchard, “Using Multiple Accounts for Harvesting Solutions in MOOCs,” in
Learning at Scale, 2016, pp. 63–70.
[8] M. May, S. George, and P. Pr´evˆot, “TrAVis to Enhance Students ’ Self-monitoring in Online Learning Supported by Computer-Mediated Communication Tools,”International Journal of Computer Information Systems and Industrial Management Applications, vol. 3, pp. 623–634, 2011.
[9] R. Mazza and C. Milani, “Exploring Usage Analysis in Learning Systems: Gaining Insights From Visualisations,” inWorkshop on Usage Analysis in Learning Systems., 2005.
[10] R. Mazza and V. Dimitrova, “Visualising student tracking data to support instructors in web-based distance education,” in 13th International Conference on World Wide Web. New York, NY, USA: ACM Press, 2004, pp. 154–161.
[11] J. A. Ruip´erez-Valiente, P. J. Mu˜noz-Merino, D. Leony, and C. Delgado Kloos, “ALAS-KA: A learning analytics extension for better understand-ing the learnunderstand-ing process in the Khan Academy platform,”Computers in Human Behavior, vol. 47, pp. 139–148, 2015.
[12] G. a. Miller, “The magical number seven, plus or minus two: some limits on our capacity for processing information.”Psychological review, vol. 101, no. 2, pp. 343–352, 1956.
[13] C. Kelleher and T. Wagener, “Ten guidelines for effective data visualization in scientific publications,” Environmental Modelling and Software, vol. 26, no. 6, pp. 822–827, 2011. [Online]. Available: http://dx.doi.org/10.1016/j.envsoft.2010.12.006
[14] HubSpot and Visage, “Data Visualization 101: How to Design Charts & Graphs,” Tech. Rep., 2015.
[15] Sunlight Foundation, “Data Visualization Style Guidelines,” Tech. Rep., 2014.
[16] C. Brewer, “Color Use Guidelines for Mapping and Visualization,”