DOI: 10.30954/0424-2513.1.2019.25
©2019 New Delhi Publishers. All rights reserved
Child Immunizations: A Comparative Study Across States in
India
Kingsuk Maity
1 *, Pinaki Das
2and Shama Firdaush
21Department of Economics, Shibpur Dinobundhoo Institution (College), West Bengal, India 2Department of Economics with Rural Development, Vidyasagar University, West Bengal, India
*Corresponding author: [email protected]
ABSTRACT
Childhood immunization programs have been suggested as an infrastructure to deliver vitamin, a supplement to children in developing countries. Health education and vaccinations prevent the spread of infectious disease. In long term, they can even lead to the end of those diseases in a given country. Thus, in this paper we have considered those vaccinations which are must for children against different types of serious disease suffered by them during their childhood days and have analyzed its coverage across states in India. The conclusion which we are able to draw is that the considered indicators have shown an improvement over the considered period i.e. from 2005-06 to 2015-16. Moreover, increment in the percentage of children who received most of the vaccinations by the public health facility over the decade has also increased in case of all the considered states.
Keywords: Childhood immunization, vitamin, diseases, vaccinations, public health facility
Childhood immunization programs have been suggested as an infrastructure to deliver vitamin, a supplement to children in developing countries. Immunization services provide an efficient and sustainable delivery channel for vitamin A supplements. Immunizing children against vaccine preventable diseases can greatly reduce childhood morbidity and mortality. To protect
against the consequences of vitamin A deficiency,
the World Health Organization recommends that high-dose vitamin A supplements should be given together with routine vaccines to children. Studies show that combining delivery of vitamin A supplementation with immunization is safe and does not have a negative effect on sero conversion of childhood vaccines. Vitamin A supplements are also given to treat sick children and xerophthalmia, and is recommended in the treatment of malnutrition. These time windows are
dominated by three different childhood vaccines:
BCG vaccine given at birth, diphtheria-tetanus-pertussis (DTP) vaccine given between 1-5 months of age, and measles vaccine given at 9 months of
age. These vaccines have been shown to have strong effects on mortality from infectious diseases in
general, so-called non-specific effects. The live BCG
and measles vaccine protect against more mortality than can be ascribed to the prevention of tuberculosis and measles, respectively. The inactivated DTP vaccine worryingly has been associated with increased mortality from other infectious diseases.
Both positive and negative effects are strongest for
girls. Thus, to optimize the child health intervention
policy in low-income countries a shift in paradigm
is needed. Health interventions should no longer be
seen as merely specific and independent, and the
policy should probably not be the same for boys and girls. Information on vaccination coverage was collected from the child’s health card and direct reporting from the mother.
Bhatia M.R., Yesudian C.A.K., Gorter A. and K.R. Thankappan(2006) analyzed the concept of
demand side financing and recommends piloting
subsidies not only overcome many drawbacks of the supply side financing but also provide the right incentives for efficiency. Borooah Vani K, Dilip Diwakar, and Nidhi Sadana Sabharwa (2014) presents econometric estimates regarding the relative strength of personal and household circumstances in determining the likelihood of utilizing the programmer’s services and suggests a trade-off between quality and utilization by hypothesizing that the poor quality of services leads upper-caste mothers to exit the ICDS market and seek these services elsewhere. Ghoshal Rakhi and Anup Dhar(2012) explained that India’s child sex ratio has gone awry despite several monitoring and corrective mechanisms and considered “undesirableness” of daughters as the root cause. Padhi Sakti(2001) explained that Infant and child mortality was not a simple function of the level of economic development, pace of economic growth or material prosperity. Further he continues that Proximate conditions have a direct bearing on infant and child mortality which cannot be influenced through increases in income and purchasing power alone and were outside the market domain. Shantha Sinha (2006) explained that in a democracy, every child must be regarded as indispensable and the government must be accountable for the deaths of children and mothers. Sinha Dipa(2015)explained that the Rapid Survey on Children conducted in
2013–14, released after an inexplicable delay and
still in a summary fashion, show some but patchy progress between 2005–06 and 2013–14 in maternal and child health indicators. A preliminary analysis made by them indicates that in areas where special efforts, some results are seen. Thus, calling for greater investments in health and nutrition within a more comprehensive approach.
In this paper we have considered the basic vaccinations which are must for children against
different types of serious disease suffered by a child
during his childhood days and have analyzed its coverage across states in India. For this purpose, we have used the NFHS data. The basic vaccines
which are must are given as follows:
One dose of Bacillus Calmette–Guérin (BCG) vaccine, which protects against tuberculosis.
Three doses of DPT vaccine, which protects
against diphtheria, pertussis (whooping cough), and tetanus.
Three doses of polio vaccine One dose of measles vaccine
DEMOGRAPHIC PROFILE OF CHILDREN
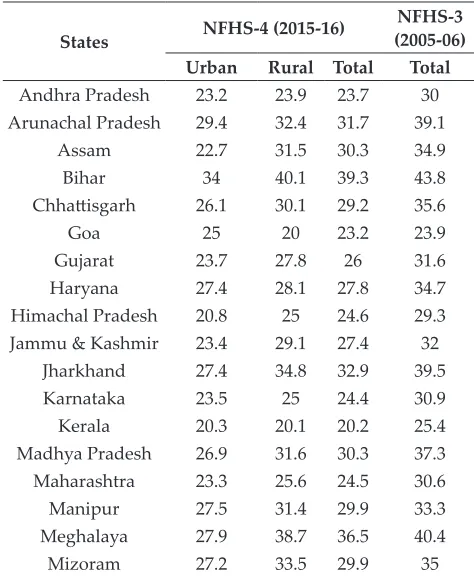
Percentage of population below the 15 years of agePercentage of population below 15 years of age have been shown in Table 1. In India, there are 34.9 per cent people who were below 15 years of age in 2005-06 whereas this percentage has declined to 28.6 per cent in 2015-16. Across the states, this percentage varied from 23.9 per cent to 43.8 per cent in 2005-06 and 20.2 per cent to 39.3 per cent in
2015-16. In 2005-06 and 2015-16, the top five states
in terms of children under 15 year’s age were Bihar, Meghalaya, Nagaland, Jharkhand and Arunachal Pradesh while the bottom five states were Goa, Kerala, Tamil Nadu, Delhi and Madhya Pradesh. The percentage of population below 15 years age have decreased in all the states over the decade but the highest decrease was in Nagaland, Rajasthan, Sikkim, Arunachal Pradesh and Madhya Pradesh whereas the least decrease was in Goa, Tamil Nadu and Meghalaya.
Table 1: Percentage share of Population below age 15 years across State in India
States NFHS-4 (2015-16)
NFHS-3 (2005-06) Urban Rural Total Total Andhra Pradesh 23.2 23.9 23.7 30 Arunachal Pradesh 29.4 32.4 31.7 39.1
Assam 22.7 31.5 30.3 34.9
Bihar 34 40.1 39.3 43.8
Chhattisgarh 26.1 30.1 29.2 35.6
Goa 25 20 23.2 23.9
Gujarat 23.7 27.8 26 31.6
Haryana 27.4 28.1 27.8 34.7
Himachal Pradesh 20.8 25 24.6 29.3 Jammu & Kashmir 23.4 29.1 27.4 32
Jharkhand 27.4 34.8 32.9 39.5
Karnataka 23.5 25 24.4 30.9
Kerala 20.3 20.1 20.2 25.4
Madhya Pradesh 26.9 31.6 30.3 37.3
Maharashtra 23.3 25.6 24.5 30.6
Manipur 27.5 31.4 29.9 33.3
Meghalaya 27.9 38.7 36.5 40.4
Nagaland 30 33.1 32 39.9
Odisha 23.5 27.2 26.6 32.1
Punjab 23.1 23.3 23.2 29.6
Rajasthan 27.1 32.6 31.2 38.9
Sikkim 22.2 23.5 23.1 30.7
Tamil Nadu 22.4 24.1 23.3 26.6
Tripura 20.8 26 24.5 30
Uttarakhand 26.9 29.9 28.9 34.6 Uttar Pradesh 29.1 35.4 33.8 42.3
West Bengal 22.6 26.8 25.4 31.9
India 24.9 30.5 28.6 34.9
Mean 25.1 28.3 27.6 33.3
SD 3.1 5.1 4.4 4.9
Sources: NFHS (2005-06) and (2015-16).
Percentage of Children under age 5 years whose birth was registered across State in India, 2005-06 and 2015-16
Information on birth registration of children under age five years is present in Table 2. At the time of the survey, 80 percentages of children under
age five years had birth registered with the civil
authority; this includes 62 per cent of children
with birth certificates. Female and male children
are equally likely to have their birth registered. Children in urban areas (89 per cent) are more likely then children in rural areas (76 per cent) to have their birth registered. Birth registration is
lowest in Uttar Pradesh (60 per cent) and Bihar (61
per cent). Birth registration among children under
age five years doubled over the considered decade
(from 41 per cent to 80 per cent). The percentage of births that were registered increased by more than 50 percentage points over the decade in
Jharkhand, Bihar, Uttar Pradesh, Madhya Pradesh,
and Rajasthan.
Table 2: Percentage of Children under age 5 years whose birth was registered across State in India.
2005-06 and 2015-16
States NFHS-4 (2015-16)
NFHS-3 (2005-06) Urban Rural Total Total Andhra Pradesh 90.1 79.9 82.7 41.3
Arunachal
Pradesh 80.0 58.3 62.9 32.4
Assam 97.4 93.8 94.2 43
Bihar 64.5 60.3 60.7 5.8
Chhattisgarh 92.6 84.4 86.1 73
Goa 98.9 99 98.9 94.7
Gujarat 97.2 94.8 95.8 85.6
Haryana 94.0 94.3 94.2 71.7
Himachal Pradesh 97.7 95.1 95.3 89 Jammu & Kashmir 90.5 73.3 77.4 35.8
Jharkhand 77.7 61.9 65 9.1
Karnataka 95.0 94.9 94.9 58.3
Kerala 97.3 98.1 97.7 88.6
Madhya Pradesh 92.2 78.4 81.9 29.7
Maharashtra 95.8 94.6 95.1 80
Manipur 74.8 59.7 64.8 30.4
Meghalaya 89.2 78.4 79.8 43.3
Mizoram 97.8 98 97.9 93.3
Nagaland 80.2 63.8 68.3 36.9
Odisha 90.0 80.7 82.1 57
Punjab 97.3 99 98.3 76.8
Rajasthan 81.5 62.5 66.6 16.4
Sikkim 98.6 98.4 98.5 85.7
Tamil Nadu 98.5 98.2 98.3 85.8
Tripura 96.8 89.9 91.6 74.4
Uttarakhand 81.8 74.2 76.7 38.4 Uttar Pradesh 67.9 58.1 60.2 7.1
West Bengal 97.3 96.7 96.9 75.8
India 88.8 76.1 79.7 41.2
Mean 90.4 77.5 85.3 58.3
SD 8.70 35.1 12.7 27.4
Sources: NFHS (2005-06) and (2015-16).
Sex ratio at birth for children born in the last
five years
Sex ratio at birth for children represents the sex ratio at birth of female for every thousand males
born within the last five years. Sex ratio at birth is
less than 1000 in most of the states i.e. more male child has been born than female child. Kerala and Meghalaya are only in exception. That is the serious concern of the society. As many as 14 states have showed a decline in the sex ratio at birth. North-Eastern part of India is in crucial stage. Manipur, Mizoram and Sikkim have shown a tremendous fall in female sex ratio at birth per thousand males. In India, Sex ratio at birth for children born in the
last five years (females per 1,000 males) has been
shown in Table 3.
It was increased from 914 (in 2005-06) to 919 (in 2015-16) in India. Across the states, this ratio varies between 734 to 1091in 2005-06 and 809 to 1047
children born in the last five years sex ratio were
Jharkhand, Arunachal Pradesh, Andhra Pradesh,
Assam, Mizoram. And the bottom five position in
2015-16 namely Punjab, Haryana, Delhi, Rajasthan, Maharashtra in 2005-06. Among them four states retained in the bottom five position in 2015-16 namely Delhi, Haryana, Punjab, Rajasthan and Sikkim.
Table 3: Sex ratio at birth for children born in the last
five years (females per 1,000 males) across State in
India, 2005-06 and 2015-16
State NFHS-4 (2015-16)
NFHS-3 (2005-06) Urban Rural Total Total Andhra Pradesh 1,010 880 914 1035
Arunachal
Pradesh 848 941 920 1,071
Assam 794 945 929 1,033
Bihar 942 933 934 893
Chhattisgarh 922 992 977 972
Goa 894 1,109 966 921
Gujarat 835 960 907 906
Haryana 785 867 836 762
Himachal Pradesh 1,151 920 936 913 Jammu & Kashmir 902 928 922 902
Jharkhand 893 926 919 1,091
Karnataka 875 935 910 922
Kerala 1,062 1,032 1,047 925
Madhya Pradesh 899 937 927 960
Maharashtra 920 927 924 867
Manipur 962 962 962 1,014
Meghalaya 891 1,030 1,009 907
Mizoram 926 970 946 1,025
Nagaland 1,014 935 956 984
Odisha 966 927 933 963
Punjab 792 909 860 734
Rajasthan 845 899 887 847
Sikkim 632 911 809 984
Tamil Nadu 972 939 954 896
Tripura 1,100 925 966 959
Uttarakhand 817 924 888 912 Uttar Pradesh 896 905 903 922
West Bengal 902 984 960 976
India 899 927 919 914
Mean 905 943.3 923.8 932.6
SD 104.2 182.3 52.3 82.2
Sources: NFHS (2005-06) and (2015-16).
COVERAGE OF VACCINATION ACROSS
STATES IN INDIA
The coverage BCG vaccine among children age 12-23 months is shown in Table 4. The percentage of children age 12-23 months who have received BCG vaccination increased from 78.2 per cent in 2005-06 to 91.9 per cent in 2015-16. Across the state, this percentage varies between 77.2 per cent 98.9 per cent in urban areas, 65 per cent and 100 per cent in rural areas. The top five states are Goa,
Jharkhand, Jammu & Kashmir, Kerala, Sikkim, and bottom five states are Nagaland, Mizoram, Arunachal Pradesh, Himachal Pradesh, Uttar Pradesh in urban areas Among them three states
were retained in the bottom five position in rural
areas namely Nagaland, Arunachal Pradesh and Mizoram. The other two states were Tripura, Assam. The percentage of children who received BCG vaccine have increased in all states from 2005-06 to 2015-16 but it increased the most in Assam, Madhya
Pradesh, Jharkhand, Bihar, Uttar Pradesh where
as it increased the least in Goa, Mizoram, Gujarat, Kerala, Himachal Pradesh.
Table 4: Percentage Children (12-23 months) have received BCG vaccine across State in India, 2005-06
and 2015-16
States NFHS-4 (2015-16) (2005-06)NFHS-3 Urban Rural Total Total Andhra Pradesh 97.7 97.1 97.3 93
Arunachal
Pradesh 80.4 68 70.9 57.7
Assam 94.3 81 82.3 62.4
Bihar 91.5 91.7 91.7 64.7
Chhattisgarh 97.1 98.7 98.4 84.6
Goa 100 100 100 96.8
Gujarat 90.6 85.9 87.9 86.4
Haryana 93.8 92.3 92.8 84.9
Himachal Pradesh 88.1 95.3 94.8 97.2 Jammu & Kashmir 98.5 94.7 95.6 90.9
Jharkhand 98.7 95.1 95.8 72.7
Karnataka 89.2 95.2 92.5 87.8
Kerala 98.3 97.9 98.1 96.3
Madhya Pradesh 95 90.3 91.6 80.5
Maharashtra 90.3 89.8 90 95.3
Manipur 95.5 89.1 91.2 80
Meghalaya 96.2 84.4 86 65.9
Nagaland 77.2 65 68.4 46.3
Odisha 93.3 94.2 94.1 83.6
Punjab 97.7 98.5 98.2 88
Rajasthan 95.3 87 88.8 68.5
Sikkim 98.2 99.2 98.9 95.9
Tamil Nadu 96.2 93.9 94.9 99.5
Tripura 89.5 80 82.4 81.1
Uttarakhand 90.4 94 92.9 83.5 Uttar Pradesh 88.3 87.4 87.6 61
West Bengal 95.1 98.5 97.5 90.1
India 93.2 91.4 91.9 78.2
Mean 73.0 82.7 90.7 81.7
SD 58.5 39.4 8.1 13.7
Sources: NFHS-3 (2005-06) and NFHS-4 (2015-16).
The coverage for each of the basic vaccination among children age 12-23 months is shown for the year 2005-06 and 2015-16 in Table 5. Coverage was least for the third dose of polio vaccine (73 per cent).
Although, more children received the first doses of
the DPT and polio vaccines than the second or third doses, the dropout rates were higher for polio. The percentage of children age 12-23 months who have received 3 doses of polio vaccination decreased from 78.2 per cent in 2005-06 to 72.8 per cent in 2015-16. Across the state, this percentage varies between 93.7 per cent and 92 per cent in urban areas, 59.1 per cent and 94.8 per cent in rural areas. The top
five states are Manipur, Punjab, Jammu & Kashmir, Chhattisgarh, Kerala and bottom states are Goa,
Sikkim, Himachal Pradesh, Gujarat, Nagaland, in urban areas. Among them two states which retained in the bottom five position in rural areas were Goa, Nagaland. The percentage of children who received 3 doses of polio vaccine have increases for some states namely Madhya Pradesh, Kerala, West Bengal, Maharashtra, and Andhra Pradesh in 2015-16.
Table 5: Percentage of Children (12-23 months) who received 3 doses of polio vaccine across State in India,
2005-06 and 2015-16
States NFHS-4 (2015-16)
NFHS-3 (2005-06) Urban Rural Total Total Andhra Pradesh 64.9 75.2 72.3 79 Arunachal Pradesh 62.8 51.0 53.7 55.8
Assam 76.4 53.7 56.0 59
Bihar 71.6 73 72.9 82.4
Chhattisgarh 87.5 80.2 81.7 85.1
Goa 93.7 91.4 92.9 87.2
Gujarat 61.5 63 62.3 65.3
Haryana 72.1 77 75.3 82.8
Himachal Pradesh 67.3 83.6 82.4 88.6 Jammu & Kashmir 85.9 83.1 83.8 82.2
Jharkhand 79.9 72.4 73.8 79.3
Karnataka 70.0 78.2 74.6 73.8
Kerala 89.6 87.6 88.5 83.1
Madhya Pradesh 69.5 61.5 63.6 75.6
Maharashtra 64.4 69.1 67 73.4
Manipur 84.7 72.7 76.6 77.5
Meghalaya 84.2 69 71.0 56.6
Mizoram 64.2 59.1 61.7 63.5
Nagaland 58.8 50.1 52.5 46.2
Odisha 79.9 83.3 82.8 65.1
Punjab 92.0 94.8 93.7 75.9
Rajasthan 68.5 64.5 65.4 65.2
Sikkim 87.1 88 87.7 85.6
Tamil Nadu 84.4 80.7 82.3 87.8
Tripura 78.9 67.2 70.1 65.3
Uttarakhand 67.2 68.4 68 80.3 Uttar Pradesh 69.8 67.8 68.3 87.6 West Bengal 82.5 90.1 87.9 80.8
India 73.4 72.6 72.8 78.2
Mean 58.6 66.9 74.0 74.8
SD 49.8 34.8 11.2 11.2
Sources: NFHS-3 (2005-06) and NFHS-4 (2015-16).
The percentage of children age 12-23 months who have received 3 doses of DPT vaccine increases from 55.3 per cent in 2005-06 to 78.4 per cent in 2015-16. Across the state, this percentage varies from 58 per cent to 94 per cent in urban areas while 49.7 per cent to 95.7 per cent in rural areas. The top five states were Goa, Chhattisgarh, Punjab, Jammu & Kashmir, Kerala and bottom states are Nagaland, Arunachal Pradesh, Mizoram, Uttar Pradesh, Haryana in urban areas Among them four states retained in the bottom five position in case of rural areas namely Nagaland, Arunachal Pradesh, Mizoram, Uttar Pradesh. The
percentage of children who received 3 doses of DPT vaccine was highest in Manipur, Nagaland,
Tripura, Tamil Nadu, Uttarakhand whereas the least
was in Bihar, Himachal Pradesh, Goa, Haryana and
Chhattisgarh (Table 6).
Across the state, this percentage varies from 58 per cent to 94 per cent in urban areas whereas from 49.7 per cent to 95.7 per cent in rural areas.
Table 6: Percentage of Children (12-23 months) received 3 doses of DPT vaccine across State in India,
2005-06 and 2015-16
States NFHS-4 (2015-16)
NFHS-3 (2005-06) Urban Rural Total Total
Andhra Pradesh 84.9 90.6 89 61
Arunachal
Pradesh 60 49.9 52.3 39.3
Assam 82.8 64.6 66.5 44.9
Bihar 79.3 80.2 80.2 46.1
Chhattisgarh 93.2 91 91.4 62.8
Goa 94 94.7 94.2 87.5
Gujarat 77.6 69.1 72.7 61.4
Haryana 71.6 79.2 76.5 74.2
Himachal
Pradesh 74.8 85.8 85 85.1
Jammu &
Kashmir 92.4 86.7 88.1 84.5
Jharkhand 87.1 81.3 82.4 40.3
Karnataka 72.7 82.1 77.9 74
Kerala 90.5 90.3 90.4 84
Madhya Pradesh 80.8 70.7 73.4 49.8
Maharashtra 75 74.8 74.9 76.1
Manipur 84.9 74.3 77.8 61.2
Meghalaya 88.1 71.8 74 47.3
Mizoram 63 60.4 61.7 66.8
Nagaland 58 49.7 52 28.7
Odisha 87.4 89.6 89.2 67.9
Punjab 92.6 95.7 94.5 70.5
Rajasthan 78.4 69.8 71.6 38.7
Sikkim 88.4 95 93 84.3
Tamil Nadu 86.3 83.1 84.5 95.7
Tripura 77.4 68.9 71.1 60.2
Uttarakhand 81 79.6 80 67.1
Uttar Pradesh 68.8 65.9 66.5 30
West Bengal 87.8 94.7 92.7 71.5
India 80.2 77.7 78.4 55.3
Sources: NFHS-3 (2005-06) and NFHS-4 (2015-16).
The top five states were Goa, Chhattisgarh, Punjab, Jammu & Kashmir, Kerala and the bottom states
were Nagaland, Arunachal Pradesh, Mizoram,
Uttar Pradesh and Haryana in urban areas. Among them, four states who retained in the bottom five
position in rural areas were Nagaland, Arunachal
Pradesh, Mizoram and Uttar Pradesh. The states
with highest percentage of children who received measles vaccine were Tripura, Sikkim, Rajasthan, Odisha, Tamil Nadu whereas the percentage was least in Chhattisgarh, Bihar, Goa, Assam, and Gujarat (Table 7).
Table 7: Percentage of Children (12-23 months) received Measles Vaccination across State in India,
2005-06 and 2015-16
States NFHS-4 (2015-16)
NFHS-3 (2005-06) Urban Rural Total Total
Andhra Pradesh 92 88.4 89.4 69
Arunachal Pradesh 63.4 51.9 54.6 38.3
Assam 86.1 69.7 71.4 37.4
Bihar 77.3 79.6 79.4 40.4
Chhattisgarh 96.3 93.3 93.9 62.5
Goa 95.6 -98.2 96.5 91.2
Gujarat 76.7 73.7 75 65.7
Haryana 78.8 79.1 79 75.5
Himachal Pradesh 89.2 87.4 87.5 86.3 Jammu & Kashmir 92.1 84.2 86.2 78.3
Jharkhand 85.4 82 82.6 47.6
Karnataka 80.7 83.8 82.4 72
Kerala 90.3 88.6 89.4 82.1
Madhya Pradesh 85.1 77.7 79.6 61.4 Maharashtra 82.6 82.9 82.8 84.7
Manipur 81.8 70.4 74.2 52.9
Meghalaya 86.6 69.7 71.9 43.8
Mizoram 60.4 61.9 61.1 69.5
Nagaland 57 47.8 50.4 27.3
Odisha 84.7 88.5 87.9 66.5
Punjab 92.7 93.3 93.1 78
Rajasthan 86.5 75.8 78.1 42.7
Sikkim 90 94.8 93.3 83.1
Tamil Nadu 85.9 84.4 85.1 92.5
Tripura 76.9 67.3 69.7 59.9
Uttarakhand 77.7 81.8 80.6 71.6 Uttar Pradesh 70.8 70.8 70.8 37.7 West Bengal 88.4 94.5 92.8 74.7
India 83.2 80.3 81.1 58.8
Mean 63.9 72.3 80.3 64.5
SD 54.6 37.3 11.6 18.4
Sources: NFHS-3 (2005-06) and NFHS-4 (2015-16).
state, this percentage varies from 41.6 per cent to 88.7 per cent in urban areas and from 33.4 per cent to 90.1 per cent in rural areas. The top five states were Punjab, Goa, Chhattisgarh, Kerala and Jammu & Kashmir whereas the bottom states were
Nagaland, Arunachal Pradesh, Mizoram, Gujarat,
Uttar Pradesh in urban areas Among them three states which retained in the bottom five position in
rural areas were Nagaland, Arunachal Pradesh and Gujarat. The other two states were Madhya Pradesh, Assam. The states with the highest percentage of children who were fully immunized were Gujarat, Assam, Punjab, West Bengal and Mizoram whereas the least percentage was in Manipur Arunachal
Pradesh, Chhattisgarh, Meghalaya, and Maharashtra
(Table 8).
Table 8: Percentage of Children (12-23 months) fully immunized (BCG, measles, and 3 doses each of polio and DPT) Across State in India, 2005-06 and 2015-16
State NFHS-4 (2015-16)
NFHS-3 (2005-06) Urban Rural Total Total Andhra Pradesh 60.4 67.2 65.3 46 Arunachal Pradesh 44.2 36.4 38.2 28.4
Assam 70.9 44.4 47.1 31.4
Bihar 59.7 61.9 61.7 32.8
Chhattisgarh 84.9 74.3 76.4 48.7
Goa 87.7 90.1 88.4 78.6
Gujarat 50.4 50.4 50.4 45.2
Haryana 57 65.1 62.2 65.3
Himachal Pradesh NA NA 69.5 74.2 Jammu & Kashmir 81.6 72.9 75.1 66.7
Jharkhand 67 60.7 61.9 34.2
Karnataka 59.8 64.8 62.6 55
Kerala 82.2 82 82.1 75.3
Madhya Pradesh 63 50.2 53.6 40.3
Maharashtra 55.8 56.7 56.3 58.8
Manipur 74.3 61.7 65.9 46.8
Meghalaya 81.4 58.5 61.5 32.9
Mizoram 49.8 51.3 50.5 46.5
Nagaland 41.6 33.4 35.7 21
Odisha 75 79.2 78.6 51.8
Punjab 88.7 89.3 89.1 60.1
Rajasthan 60.9 53.1 54.8 26.5
Sikkim 81.4 83.7 83 69.6
Tamil Nadu 73.3 66.8 69.7 80.9
Tripura 64.2 51.2 54.5 49.7
Uttarakhand 56.5 58.2 57.7 60
Uttar Pradesh 53.6 50.4 51.1 23
West Bengal 77.7 87.1 84.4 64.3
India 63.9 61.3 62 43.5
Mean 54.7 56.3 63.9 50.9
SD 41.2 33.8 14.1 17.4
Sources: NFHS-3 (2005-06) and NFHS-4 (2015-16).
COVERAGE OF VITAMIN- A
SUPPLEMENTATION ACROSS STATES
IN INDIA
The percentage of children age 9-59 months who received Vitamin A dose in last 6 months increases from 16.5 per cent in 2005-06 to 60.2 per cent in 2015-16. Across the state, this percentage varied from 36.4 per cent to 88.3 per cent in urban areas whereas from 22.9 per cent and 91.7 per cent in rural areas. The top five states in this regard were
Goa, Sikkim, Mizoram, Karnataka, Odisha and
bottom states were Rajasthan, Manipur, Nagaland,
Uttarakhand, and Uttar Pradesh in urban areas. Among them the three states who retained in the
bottom five position in rural areas were Nagaland, Manipur, Uttarakhand, Rajasthan.
Table 9: Percentage of Children (9-59 months) who received Vitamin A dose in last 6 months across State
in India, 2005-06 and 2015-16
States NFHS-4 (2015-16) (2005-06) Urban Rural Total Total Andhra Pradesh 73.5 71.6 72.1 21.1 Arunachal Pradesh 49 36.8 39.4 15.8
Assam 58.5 50.5 51.3 12.2
Bihar 58.6 62.7 62.3 25.1
Chhattisgarh 73.3 69.4 70.2 8.9
Goa 88.3 91.7 89.5 31
Gujarat 69.9 72.2 71.2 12.8
Haryana 65.7 67.3 66.7 10.5
Himachal Pradesh 51 65.4 64.3 26.7 Jammu & Kashmir 68.1 63.6 64.7 12.6
Jharkhand 48.8 53.8 52.9 18
Karnataka 75.1 81.3 78.7 13.6
Kerala 74.3 74.5 74.4 31.5
Madhya Pradesh 65.6 58.6 60.4 12.5
Maharashtra 72.2 69.2 70.5 23.3
Manipur 39.1 28.4 32.1 11.2
Meghalaya 63.7 52.9 54.4 14.9
Mizoram 75.2 61.1 68.6 40.2
Odisha 74.8 68.1 69.1 20.4
Punjab 69.3 71.5 70.6 14.6
Rajasthan 47.3 37.5 39.6 8.6
Sikkim 80.5 86.2 84.3 18
Tamil Nadu 65.9 70.5 68.3 33.1
Tripura 69.1 60.7 62.8 28.3
Uttarakhand 36.9 36.9 36.9 12.8 Uttar Pradesh 36.4 40.4 39.5 5.6
West Bengal 65.7 69.6 68.4 31.7
India 62.9 59.1 60.2 16.5
Mean 62.3 55.9 60.8 18.4
SD 14 30.2 15.6 9.1
Sources: NFHS-3 (2005-06) and NFHS-4 (2015-16).
The state where there was the highest increase in the percentage of children who received Vitamin-A
were Manipur, Odisha, Jharkhand, Uttarakhand,
and Punjab. Whereas the least increment was in
Chhattisgarh, Bihar, Assam, Arunachal Pradesh and
Andhra Pradesh (Table 9).
CHILD VACCINATIONS THROUGH
PUBLIC HEALTH SECTOR ACROSS
STATES IN INDIA
The percentage of children age 12-23 months who received most of the vaccinations in public health facility increased from 82 per cent in 2005-06 to 90.7 per cent in 2015-16. Across the state, this percentage varied from 72.6 per cent to 94.7 per cent in urban areas, and from 81.7 per cent to 99.2 per cent in rural areas over the decade.
Table 10: Percentage of Children (12-23 months) received most of the vaccinations through public health facility across State in India, 2005-06 and
2015-16
States NFHS-4 (2015-16) (2005-06) Urban Rural Total Total Andhra Pradesh 83.4 94.9 91.6 43.4
Arunachal
Pradesh 90.3 95.1 93.9 95.4
Assam 77.3 95.3 93.3 87
Bihar 87 96.4 95.5 73.2
Chhattisgarh 87.6 98.6 96.4 93.8
Goa 72.7 86.4 77.2 83.2
Gujarat 78.2 93.9 87.1 82.2
Haryana 91.4 96.6 94.8 92.6
Himachal Pradesh 94.7 98.1 97.9 96.3
Jammu &
Kashmir 93.9 98.8 97.5 91.5
Jharkhand 81.5 98.3 95.3 83
Karnataka 77.8 96.1 88.2 74.8
Kerala 72.6 81.7 77.6 66
Madhya Pradesh 88.9 98.3 95.7 86.7
Maharashtra 78.5 92.3 86.2 79.6
Manipur 92.8 92.9 92.9 92.7
Meghalaya 81.1 94.3 92.4 87
Mizoram 86.8 98.3 92.2 93.7
Nagaland 84.6 94.7 91.7 93.1
Odisha 93.2 99.2 98.3 86.4
Punjab 80.4 94.3 89 85.5
Rajasthan 88.8 96 94.4 87.2
Sikkim 91.9 95.1 94.1 98.6
Tamil Nadu 78.7 91.9 86.1 75
Tripura 92.6 99.2 97.4 87.2
Uttarakhand 87.6 92.4 91 81.7 Uttar Pradesh 77.5 86.4 84.5 80.5
West Bengal 90.4 99 96.6 92.5
India 82.1 94.2 90.7 82
Mean 67.4 88.6 91.8 84.4
SD 53.6 37.7 5.5 11.1
Sources: NFHS-3 (2005-06) and NFHS-4 (2015-16).
The top five states were Himachal Pradesh, Jammu
& Kashmir, Tripura, Manipur and Odisha while
the bottom states were Kerala, Goa, Assam, Uttar
Pradesh and Karnataka in urban areas. Among
them the three states which retained in the bottom five position in rural areas were Kerala, Goa, Uttar
Pradesh, Maharashtra, and Tamil Nadu. The states showing highest increase in the percentage of children who received most of the vaccinations in public health facility were Andhra Pradesh,
Arunachal Pradesh, Bihar, Assam, and Chhattisgarh whereas the least occurred in West Bengal, Uttar
Pradesh Odisha, Tamil Nadu and Uttarakhand (Table 10).
CONCLUSION
Percentage of population below 15 years of age has experienced reduction over the decade. In case of all the indicators considered to analyze child immunization it was observed that all the them namely birth registration among children under the
age of five years, sex ratio at birth for the children
doses of polio vaccine, coverage of DPT vaccine and measles vaccine, percentage of children who received Vitamin-A and the percentage of children who received most of the vaccinations by the public health facility has shown an improvement over the considered period i.e. from 2005-06 to 2015-16.
Jharkhand, Bihar, Uttar Pradesh, Madhya Pradesh,
and Rajasthan showed highest increment in case of birth registration. Assam, Madhya Pradesh,
Jharkhand, Bihar, Uttar Pradesh showed the highest
increment in the percentage of children who received BCG vaccine. Madhya Pradesh, Kerala, West Bengal, Maharashtra, and Andhra Pradesh showed the highest increase in the percentage of children who received 3 doses of polio vaccine. Coverage of DPT vaccine was highest in Manipur,
Nagaland, Tripura, Tamil Nadu and Uttarakhand
and the states showing highest increment in coverage for measles vaccine for children were Tripura, Sikkim, Rajasthan, Odisha and Tamil Nadu whereas the increment in the percentage of children who received most of the vaccinations by the public health facility over the decade has also increased in case of all the states.
REFERENCES
Bhatia, M.R., Yesudian, C.A.K., Gorter, A. and Thankappan, K.R. 2006, “Demand Side Financing for Reproductive and Child Health Services in India”, Economic and Political Weekly, January 2006.
Borooah, V.K., Dilip Diwakar, and Nidhi Sadana Sabharwa 2014. Economic & Political Weekly,49(12).
Ghoshal, R. and Anup Dhar, 2012. “Child Sex Ratio and the Politics of ‘Enemisation”, Economic & Political Weekly, 47(49).
Government in India, ministry of health and family welfare, (1997 and 1991), Reproductive and child health programme.
India Health Care: Inspiring Possibilities. Challenging journey, McKinney and company, 2012.
NCPCR, Policy document on protection of children’s Right in Areas of Civil Unrest.
Padhi, S. 2001. “Infant and Child Survival in Orissa: An Analysis with NFHS Data”, Economic and Political Weekly, August 2001.
Sinha, D. 2015. “Maternal and Child Health Inching Ahead, Miles to Go”, Economic& Political Weekly, 50(49).
Sinha, S. 2006. “Infant Survival: A Political Challenge”, Economic and Political Weekly, August 2006.