http://www.sciencepublishinggroup.com/j/ajai doi: 10.11648/j.ajai.20180202.11
ISSN: 2639-9717 (Print); ISSN: 2639-9733 (Online)
Methodology Article
Evaluation of Spatial Filtering Techniques in Retinal Fundus
Images
Arwa Ahmed Gasm Elseid
1, Mohamed Eltahir Elmanna
2, Alnazier Osman Hamza
31Department of Biomedical Engineering, Sudan University, Khartoum, Sudan
2Department of Biomedical Engineering, Almughtaribeen University, Khartoum, Sudan 3
Department of Radiology, Medical Sciences and Technology University, Khartoum, Sudan
Email address:
To cite this article:
Arwa Ahmed Gasm Elseid, Mohamed Eltahir Elmanna, Alnazier Osman Hamz. Evaluation of Spatial Filtering Techniques in Retinal Fundus Images. American Journal of Artificial Intelligence. Vol. 2, No. 2, 2018, pp. 16-21. doi: 10.11648/j.ajai.20180202.11
Received: September 24, 2018; Accepted: October 6, 2018; Published: October 27, 2018
Abstract:
The denoising of the fundus images is an essential pre-processing step in glaucoma diagnosis to ensure sufficient quality for the Computer Aided Diagnosing (CAD) system. In this paper, we present an evaluation approach for different denoising filters of eye fundus images that suffer from two different types of noises (Gaussian noise and Salt & Pepper noise), which had been applied to the retinal images and then various Spatial filtering techniques like linear (Gaussian, mean), nonlinear filtering (median) and adaptive filtering have been implemented to three types of images (original images, images with salt and pepper noise and images with Gaussian noise) and their performance are compared to each other based on evaluation parameters: Mean Squared Error (MSE), Peak Signal Noise Ratio (PSNR) and Structural Similarity (SSIM). The results showed that the adaptive median filter has the best performance in salt & paper noise and the adaptive filter has the best performance for Gaussian noise, but their performance is close to each other. In conclusion, six spatial filters applied to RIM-ONE fundus image database and found that, the adaptive median filter has the best performance compared to other filters to remove these noises and increase the quality of the resulting images, which can be implemented to the CAD system.Keywords:
Fundus Images, Spatial Filtering, MSE, PSNR, SSIM1. Introduction
Early diagnosis is crucial in many sight-threatening diseases like glaucoma, hypertension and diabetic retinopathy which cause blindness among working age people. Therefore retinal image analysis has become one major diagnosis method in modern ophthalmology. Retinal image analysis typically involves in blood vessel segmentation, optical disc segmentation and fovea segmentation for detecting and analyzing any abnormalities. The restoration of noisy fundus images is an essential pre-processing step in any of the related image analysis approaches [1].
Retinal imaging has become a significant tool in medical imaging technology, due to its capability to extract many data can be used in various eye diseases diagnosis.
Digital images like fundus image are often corrupted by different types of noise during its acquisition and transmission
phase. Such degradation negatively influences the performance of many image processing techniques and CAD system performance based on this images, for that a preprocessing module to filter the
images is often required [2, 3], That accuracy of disease detection depends on the quality of acquired retinal fundus image as some times it contains uneven illumination, blurry and noisy areas. So, Illumination equalization and noise removal are required to enhance the image quality and increase CAD system accuracy.
pre-processing in retinal fundus images and discussed principles, advantages and disadvantages, Here adaptive median filter is found to be better compared to other preprocessing methods, because it have higher PSNR value and lower MSE value in 3 diabetic retinopathy retinal images, and authors in [6], [7] at HRT database and [8] used the median filter for noise removed in fundus retinal images. But the authors at [9] proposed denoising method based on image sequences and an adaptive frame averaging approach.
Filtering is a technique for modifying or enhancing an image via smoothing, sharping and deblurring. For example, you can filter an image to emphasize certain features or remove other features. Image processing operations implemented with filtering include smoothing, sharpening, and edge enhancement. Noise removal is one of the major concerns in the field of computer vision and image processing. Images are often contaminated by impulsive noise due to noisy sensors or channel transmission errors or faulty storage hardware. The goal of removing impulsive noise is primarily to suppress the noise as well as to preserve the integrity of edges and detailed information see section (3.1.1). In digital image processing field, two applications of great importance are noise filtering and image enhancement.
Noise sources: Image acquisition. Image transmission Noise models:
Spatially independent noise models Gaussian noise
Rayleigh noise Erlang (Gamma) noise Exponential noise
Impulse (salt-and-pepper) noise Spatially dependent noise model Periodic noise [10].
In fundus image first step was to evaluate the noise in the image, then to estimate noise type.
Salt and pepper noise, Gaussian noises are the main noises effects in retinal image. In salt and pepper noise random occurrence of black and white pixel and in gaussian noise variation of intensity value with the gaussian normal distribution occur [5].
The rest of this paper is organized as follows. In Section 2, the material and method is introduced in detail. In Section 3, experimental results and discussion. Finally, in Section 4, the conclusion is presented.
2. Materials and Methods
The database used is from An Open Retinal Image Database for Optic Nerve Evaluation (RIM-ONE) is a fundus image database that is related to glaucoma disease. It consists of 169 ONH images, where the images are divided into five classes as follows: normal 118 images, early glaucoma 12 images, moderate glaucoma 14 images, deep glaucoma 14 images and ocular hypertension (OHT) 11 images [11].
2.1. Different Types of Filters Used to RemoveNoises
2.1.1. Median Filter
Median Filtering Seems Almost Tailor-Made for Removal of Salt and Pepper Noise. Recall that the Median of a Set is the Middle Value When They are Sorted. If There are an Even Number of Values, the Median is the Mean of the Middle two. A median Filter is an Example of a Non-Linear Spatial Filter [12].
( , )={ ( , )}, , ⋲ (1)
Let represents a set of rectangular sub image with window size ( ) centered at ( , ).
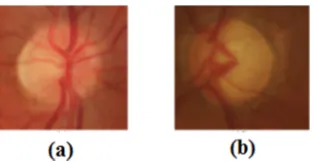
Figure 1. Eye RIM-ONE database images: (a) Normal image, (b) Glaucoma image (abnormal).
2.1.2. Adaptive Filter
Adaptive Filters Are a Class of Filters Which Change Their Characteristics According to the Values of the Greyscales Under the Mask, Is Implemented by Applying a Function to the Grey Values Under the Mask.
2.1.3. Mean Filter
The Mean Filter is a Simple Sliding-Window Spatial Filter that Replaces the Center Value in the Window with the Average (Mean) of All the Pixel Values in the Window. The Window, Or kernel, Is Usually Square But Can be Any Shape [13].
( , )=1/ £ ( ,) (2)
2.1.4. Guided Filter
The guided filter function performs edge-preserving smoothing on desired image, based on the content of a second image, called a guidance image, to influence the filtering. The guidance image can be the image itself, a different version of the image, or a completely different image, but the operation takes into account the statistics of a region in the guidance image when calculating the value of the output pixel. If the guidance and image to be filtered is the same the structures are the same an edge in the original image is the same in the guidance image. If the guidance is different, structures in the guidance image will affect the filtered image, in effect, imprinting these structures on the original image his effect is called structure transference.
2.1.5. Gaussian Filter
, (3)
The value of the sigma or the variance affect inversely to the filtering, smaller values of sigma means more frequencies are suppressed and vice versa.
2.1.6. Adaptive Median Filter
The Adaptive Median Filter performs spatial filtering to preserve detail and smooth non-impulsive noise. The main advantage to this adaptive against the median filtering is that repeated applications of this Adaptive Median Filter do not erode away edges or other small structure in the image.
2.2. Performance Evaluation
To evaluate the performance of these five filters, four measures are computed from the original image and filtered image, these measures are:
2.2.1. Mean-Squared Error (MSE):
, ∑ (4)
The error signal ! ! ! is the difference between the original and distorted image [14].
2.2.2. Mean Peak Signal to Noise Ratio (PSNR)
PSNR 10log + -./, (5)
Where L is the dynamic range of allowable pixel intensities. For example, for an 8-bit per pixel image, L = 2^8 −1 = 255. L is the dynamic range of allowable image pixel intensities [15].
2.2.3. Structural Similarity Index (SSIM)
SSIM x, y 4l x, y 56. 4c x, y 59. 4s x, y 5; (6) Where it combination of the luminance, contrast and structure similarity functions [16].
Luminance function:
< , =>= ?@
A > A ?@ (7)
Contrast function:
B , > ?
> ? (8)
Structure function:
, > CD
> CD (9)
Standard deviation (E :
E F G ∑G H I
@
(10)
Mean intensity (H :
H J ∑ z (11)
2.2.4. Signal-to-Noise Ratio (SNR)
KL MN
MO 〖(P ! Q<)〗^2/〖(P R! )〗^2 (12)
Where P ! Q< is the signal amplitude and P R! the noise amplitude.
3. Results and Discussions
In this paper, two different types of noises (Gaussian noise and Salt & Pepper noise) had been applied to the retinal images and then various filtering techniques like linear (Gaussian, mean), nonlinear filtering (median) and adaptive filtering have been implemented to three types of images (original image without noise, image with salt and pepper noise, image with Gaussian noise). Finally, we used MSE, PSNR, SNR, and SSIM parameters to measure performance of the filters.
Figures (3, 4 & 5) show results of applying the filters to the fundus images with Gaussian noise and salt & pepper noise.
Tables (1, 2, & 3) show results of the performance evaluation after applying Adaptive filter, Guided filter, Gaussian filter, Mean filter & Median filter to retinal image with Gaussian noise (density = 0.05), retinal image without noise, retinal image with salt & pepper noise (Density = 0.02) respectively.
Tables (4 & 5) show results of PSNR after applying spatial filters to retinal images with different densities of salt and pepper noise and Gaussian noise respectively (10% to 50 %). Figures (6 to 9) show results of performance evaluation using a bar chart.
The results showed that the adaptive median filter has the best performance in salt & paper noise and the adaptive filter has the best performance for Gaussian noise, but their performance is close to each other, based on our fundus image database noise. The results showed that the adaptive median filter has the best performance compared to other filters.
From the results, we can notice that the best performance to impulse noise is median filter and the best for Gaussian noise is an adaptive filter, but for retinal image without noise the Gaussian filter is superior, to get more accurate results the performance of five filtering methods was tested using retinal images with different noises level (Tables 4 & 5).
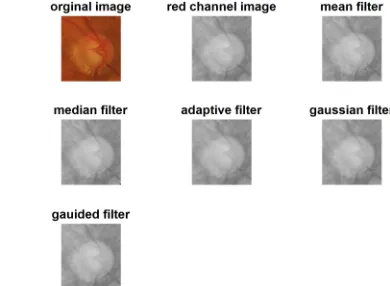
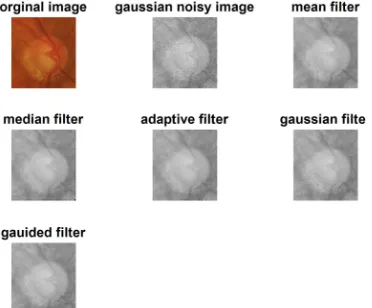
Figure 3. Different filters applied in Gaussian noisy glaucoma image show: the original image, mean, median, adaptive, Gaussian and guided filters..
Figure 4. Different filters applied in (salt& paper) noisy glaucoma image show: the original image, mean, median, adaptive, Gaussian and guided filters.
Table 1. Performance evaluation of retinal image with Gaussian noise (density = 0.05) using spatial filters.
Filters Name MSE PSNR SNR SSIM
Adaptive filter 0.00026 36.16 31.42 0.90
Guided filter 0.00073 31.36 26.62 0.62
Gaussian filter 0.0021 26.87 22.13 0.36
Mean filter 0.00058 32.38 27.65 0.70
Median filter 0.00040 33.96 29.23 0.81
Figure 5. Bar chart show the comparison between the different filters types applied to image corrupted by Gaussian noise.
Table 2. Performance evaluation of retinal image using spatial filters.
Filters Name MSE PSNR SNR SSIM
Adaptive filter 6.7E-05 42.60 37.87 0.95
Guided filter 4.4E-05 44.18 39.45 0.96
Gaussian filter 3.0E-06 56.17 51.44 1.00
Mean filter 2.2E-05 47.57 42.83 0.98
Median filter 4.9E-05 43.58 38.84 0.97
Adaptive median 0.90 50.04 45.31 0.99
Figure 6. Bar chart shows the comparison between the different filters types applied to the original image.
Table 3. Performance evaluation of retinal image with salt & pepper noise (Density = 0.02) using spatial filters.
Filters Name MSE PSNR SNR SSIM
Adaptive filter 0.00093 30.36 25.63 0.80
Guided filter 0.0024 26.24 21.51 0.61
Gaussian filter 0.0023 26.35 21.62 0.59
Mean filter 0.00066 31.84 27.11 0.75
Median filter 4.96E-05 43.48 38.75 0.97
Figure 7. Bar chart shows the comparison between the different filters types applied to the original image corrupted by salt & paper noise.
Table 4. PSNR of retinal image with different densities of salt & pepper noise using spatial filters.
Salt & pepper Noise 10% 20% 30% 40% 50%
Adaptive median filter 50.05 49.08 47.77 46.41 44.97
adaptive filter 26.57 24.50 22.86 21.42 20.14
Guided Filter 17.70 13.87 11.73 10.26 9.15
Gaussian filter 19.32 16.25 14.43 13.12 12.10
Mean filter 24.70 21.40 19.37 17.85 16.64
Figure 8. Bar chart shows results of fundus images filtration at different level of (Salt & Pepper) Noises.
Table 5. PSNR of retinal image with A different densities of Gaussian noise using spatial filters.
Gaussian Noise 10% 20% 30% 40% 50%
Adaptive median filter 18.53 13.89 10.99 9.17 8.09
adaptive filter 20.08 14.36 11.23 9.34 8.22
Guided filter 19.17 14.13 11.15 9.30 8.21
Gaussian filter 18.71 13.99 11.08 9.27 8.19
Mean filter 19.73 14.27 11.19 9.32 8.21
Median filter 19.79 14.13 10.98 9.07 7.99
Figure 9. Bar chart shows results of fundus images filtration at the different level of (Gaussian) Noises.
4. Conclusion
In conclusion, six spatial filters applied to (RIM-ONE) fundus images database which, contain 169 images and their
performance are compared to each other based on three parameters: mean squared error (mse), peak signal noise ratio (psnr) and structural similarity (ssim), our experiments have shown that the best performance founded for impulse noise is an adaptive median filter and for Gaussian noise is an adaptive filter. The novelty of this paper discussed two types of noises present in the fundus images and also discussed different types of filters which are used to remove these noises to increase the quality of the resulting images, which can be implemented to the CAD system.
Future work will be to evaluate other image filters or combinations of them to make the image filtering assessment more robust and accurate.
References
[1] Bandara, A. M. R. R., and P. W. G. R. M. P. B. Giragama. "A Retinal Image Enhancement Technique for Blood Vessel Segmentation Algorithm." Industrial and Information Systems (Iciis), 2017 Ieee International Conference On. Ieee, 2017. [2] Ba, Alper, and M. Emin Yüksel. "Impulse Noise Removal from
Digital Images by a Detail-Preserving Filter Based On Type-2 Fuzzy Logic." Ieee Transactions On Fuzzy Systems 16.4 (2008): 920-928.
[3] Mélange, Tom, Mike Nachtegael, and Etienne E. Kerre. "Fuzzy Random Impulse Noise Removal from Color Image Sequences." Ieee Transactions On Image Processing 20.4 (2011): 959-970.
[4] Gupta, Sayantan, and Sukanya Roy. "Medav Filter—Filter For Removal Of Image Noise With The Combination Of Median And Average Filters." Recent Trends in Signal and Image Processing. Springer, Singapore, 2019. 11-19.
[5] Mandar Sontakke, Meghana Kulkarni, “Different Types Of Noises In Images And Noise Removing Technique”, International Journal Of Advanced Technology In Engineering And Science, Volume No.03, Issue No. 01, January 2015 Issn (Online): 2348–7550.
[6] Swathi. C., Anoop B. K D Anto Sahaya Dhas S. Perumal Sanker, “Comparison Of Different Image Preprocessing Methods Used For Retinal Fundus Images”, Proc. Ieee Conference On Emerging Devices And Smart Systems (Icedss 2017), 3-4 March 2017, Mahendra Engineering College, Tamilnadu, India.
[7] Geetha Ramani, Sugirtharani S., Lakshmi B. “Automatic Detection of Glaucoma in Retinal Fundus Images through Image Processing and Data Mining Techniques”, International Journal of Computer Applications (0975 – 8887), Vol. 166, (No.8, May 2017).
[8] Sundari. B, Sivaguru. S. “Early Detection of Glaucoma from Fundus Images by Using MATLAB GUI for Diabetic Retinopathy”, International Journal of Innovative Research in Computer and Communication Engineering, An ISO 3297: 2007 Certified Organization, Vol. 5, Issue 1, (January 2017). [9] Thomas K¨ohler, Joachim Hornegger, MarkusMayer, Georg
Michelson. “Quality-Guided Image Denoising for Low-Cost Fundus Imaging”,
[10] Claro M., Leonardo Santos, Wallinson Silva, Fliavio Araiujo, Nayara MouraAutomatic. “Glaucoma Detection Based on Optic Disc Segmentation and Texture Feature Extraction”, CLEI ELECTRONIC JOURNAL, VOL. 19, (AUGUST 2016), NUM. 2, P. 4.
[11] Fumero, Francisco, et Al. "Rim-One: An Open Retinal Image Database for Optic Nerve Evaluation." Computer-Based Medical Systems (Cbms), 2011 24th International Symposium On. Ieee, 2011.
[12] Median Filter, Https://En.Wikipedia.Org/Wiki/Median_Filter [13] Mean Filter, Https://Www. Markschulze.Net/Java/Meanmed.
Html
[14] Wang, Zhou, and Alan C. Bovik. "Mean Squared Error: Love It Or Leave It? A New Look At Signal Fidelity Measures." Ieee Signal Processing Magazine 26.1 (2009): 98-117.
[15] Bahaghighat, Mahdi, and Seyed Ahmad Motamedi. "Psnr Enhancement in Image Streaming Over Cognitive Radio Sensor Networks." Etri Journal 39.5 (2017): 683-694. [16] Wang, Zhou, Alan C. Bovik, and Eero P. Simoncelli.