2706
Influence The Effect Of Cavity Size And Position
In High Voltage Cable By Using Finite Element
Method
D. Abarna, B. Vigneshwaran, M. Willjuice Iruthayarajan R.V. Maheswari
Abstract: In this paper, a three core submarine cable used for connecting the offshore farms to onshore stations analyzed using Finite Element Method (FEM). The primary source for the partial discharge activity is a cavity that can exist in the insulation of the cable. The repeated occurrence of partial discharges will lead to a complete breakdown of cable. The cavities have a significant effect on the electric field and potential distribution. In this proposed work, a 2D simulation model of a submarine cable designed using COMSOL multiphysics. In this model, cavities are created in the insulation of the cable at different positions with different sizes. The model has been used to study the effect of cavity size and location in high voltage cables by performing electrical analysis. Various statistical parameters evaluated in both the electric field and potential distribution for predicting the severity of stress inside the electric insulation.
Index Terms: cavity discharge, COMSOL multiphysics, Finite Element Method, field distribution, potential distribution, submarine HV Cable, statistical parameters
—————————— ——————————
1.
INTRODUCTION
in power system network submarine cables plays an important role because it transmit the power between countries as well as critical regions like bays, estuaries, rivers, etc. It also connects the offshore farms to onshore stations. In modern era, submarine cables are widely used in renewable energy schemes. In general, under operating condition HV cables should have the property of withstanding HV stress due to environmental factors. The results from the numerical and electrical analysis are used to access the lifetime of the HV cables. Due to the impact of cavities inside the HV cables, potential difference across the conductor may vary due to mechanical, electrical, and thermal properties. Generally, lifetime of the HV cable is investigated by evaluating electrical resistance in the conductor [1]. During manufacturing and installation process, the cable is subjected to severe mechanical stress. These stresses can affect the properties of the conductor as well as insulation of the cable [2]. At this condition formation of cavities in the insulation of the cable is unavoidable one. Such cavities are filled by air have a lower dielectric strength compare to electric insulation like Paper oil insulation, cross linked polyethylene (XLPE) and Ethylene propylene rubber (EPR) [3]. In recent years, the usage of XLPE is increases compare to other insulating materials. The properties of the
insulation can be degraded by various factors such as cavities, impurities, will reduce the life span of the cable.
Due to any circumstance, occurrence of cavities in between the semi-conductive compound and insulation layer which causes the PD in cables. The PD occurs in a cavity when the electric field exceeds the breakdown strength of the air filled by the cavity. The applied voltage and frequency is increased which causes more number of PDs [4]. After the first PD event, the temperature of the cavity is increased and the distribution becomes non-uniform. Then the repeated PD events lead to temperature rise of the cable. Prediction of the temperature rise is one of the important factor in cable design process [5-7]. In a cable, failure of temperature rise prediction can leads to failure of whole system [8]. In buried cables the thermal resistance of a cable is depending upon the temperature rise of the conductor. These temperature rise also affect the electrical properties of the insulation provided in the cables [9]. The space charge will distort the electric field distribution of the cable. The influence of homocharges on electric field is different from heterocharges. But the effect of heterocharges is high because it increases the electric stress and electrostatic pressure of the cavity [10]. The aim of this study is investigating the influence of cavity on electric field and potential distribution of high voltage cables using Finite Element Method. For analyzing 2D model of a submarine cable was designed with cavities at different positions with different size. Designed model is used to determine the electrical characteristics of HV cable under cavities using electric field and potential distribution evaluation. From the distribution plot, various parameters are calculated for predicting the severity of discharge in the dielectrics.
2
SUBMARINE
CABLE
SPECIFICATION
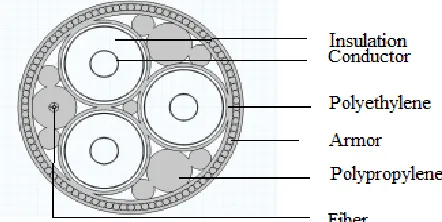
A submarine cable consists of one or more conductors with suitable insulation. Various types of cables are available but the type of cable to be used will depend upon the working voltage and service requirements. The general construction of a 3-core cable consists of conductors with insulation, metallic sheath, bedding, armoring, and serving. Copper or Aluminum strands are usually used for as conductor to provide flexibility to the cable. In this proposed work, copper is used as a conductor for investigation. The insulation thickness is ————————————————
Ms.D. Abarna is currently pursuing masters degree program in High Voltage Engineering in National Engineering College, India,
Mr.B. Vigneshwaran is currently working as a Assistant Professor (SG) in department of Electrical and Electronics Engineering in National Engineering College, India, E-mail: [email protected]
Dr.M.Willjuice Iruthayarajan is currently working as a Professor & Head in department of Electrical and Electronics Engineering in National Engineering College, India.
2707 depending upon the working voltage of the cable. The
insulating material of the cable should have high resistance to avoid the leakage current. In this design XLPE is used as insulating material for cable. Semi-conductive compound in the HV cable should be free from corona edges. Metallic sheath is provided over the insulation. Here, lead is used as metallic sheath of the cable. A layer of fibrous material provided over the metallic sheath is termed as bedding of the cable, which is used to protect the metallic sheath from corrosion and mechanical stress due to armoring. Over the bedding, armoring is provided to protect cable from mechanical injury during handling of the cable. Here, High-strength alloy steel is used for armoring purpose. Serving is similar to bedding, a layer of fibrous material provided over the armoring, which is used to protect the armoring from various atmospheric conditions. In this cable polyethylene is used for bedding and armoring purpose. Which is provide more flexible to cable while laying process. Polypropylene is used as fillers of cable. It has high tensile strength and high melting point. Dimensions of the cable are given in Table 1.
TABLE 1
DIMENSIONS OF THE CABLE
Parameters Values (mm)
Diameter of conductor 29.8
Thickness of insulation 23
Diameter of insulation 79.2
Semi-conductive compound thickness 0.85
Lead sheath thickness 3
Outer diameter of Cable 224
In addition to conductors, modern 3-core submarine cables contain optical fiber for data transmission and temperature measurement. Silica glass is used as core of the fiber optic cable and High- strength alloy steel is used for armouring purpose. Electrical properties of the materials involved in this cable design are given in Table 2.
TABLE2
ELECTRICAL PROPERTIES OF THE MATERIALS
Material εr σ [S/m]
Air 1 1e-14
Polyethylene 2.25 1e-18
Polypropylene 2.36 1e-18
Semi-conductive compound 2.25 2
XLPE 2.5 1e-18
Copper 1 5.96e7
Lead 1 4.55e6
High-strength alloy steel 1 4.032e6
3
NUMERICAL
METHOD
The cable model solves a 2D in-plane current conservation problem in the frequency domain. This includes the differential form for the electric field, Gauss's law, and current conservation also the current conversion law with partial differential equation for the dependent variable V are given below:
E = −∇V (1)
∇. D =ρ (2)
∇.J = - jωρ (3)
-∇.((σ+jωE)∇V) = 0 (4)
Where, E is the Electric field, D is the Electric flux density, ρ is the Charge density, J is the current density and V is the Electric potential. The value V for three phases in the domain can be determined by using Dirichlet boundary conditions are given below:
VR =V0 , VY = V0𝑒 , VB =V0𝑒 (5)
The 120° phase shift between the phases is set by using complex exponent ejϕ combined with V
g= 0 for ground.
4
SIMULATION
MODEL
OF
SUBMARINE
CABLE
4.1MODELING OF CABLE WITHOUT CAVITY
The design includes a 2D finite element model of a 3-core lead sheathed XLPE submarine cable without cavity, the nominal cross section of the conductor is 630 mm2, and a phase-to-phase operating voltage of 220 kV is shown in Fig. 1.
Fig. 1. 2D Model of submarine cable
In order to obtain accurate results from finite element analysis, the critical regions are divided into small areas called elements. This process is known as meshing. COMSOL multiphysics consist of advanced tools for meshing. The element size and other parameters in the meshing model is user defined is shown in Fig. 2.
Fig. 2. Meshing model of cable
The following parameters are given to the cable for obtaining the electric potential and electric field distribution of the cable. The input parameters of a cable are given in Table 3.
2708
TABLE 3
INPUT PARAMETERS OF A CABLE
Operating frequency, f0 50 Hz
Phase to ground voltage, V0 127kV
Rated current 655*√2 A
Conductor conductivity, 20°C (Phase) 5.96e7 [S/m] Lead sheath conductivity, 20°C (Phase) 4.55e6 [S/m] XLPE permittivity from IEC 60287 2.5
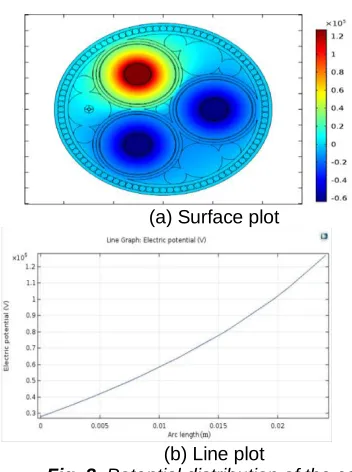
The applied potential is 127 kV and it goes on decreases from conductor surface to the outer layer of sheath is shown in Fig. 3.
(a) Surface plot
(b) Line plot
Fig. 3. Potential distribution of the cable
The electric field inside the conductor is zero but it should be maximum at conductor surface where the stress takes part. But, potential is a non zero quantity. The determination of electric field is most important in the insulating materials.. The electric fields exist outside the metallic sheath, when screens are not working properly. Furthermore, the field is much stronger than the electric fields caused by magnetic induction. The plot of electric field Distribution is shown in Fig. 4.
(a) Surface plot
(b) Line plot
Fig. 4. Electric field distribution of the cable
4.2MODELING OF CABLE WITH CAVITY
2D finite element model of a cable is created with artificial cavity to analyze the electric field and potential distribution. Cavities are created with various diameters at different position of the cable. The cavities are created in the insulation (XLPE) of the cable at three different positions like cavity at nearer to the conductor, cavity at center of the insulation and cavity far away from the conductor. Cable with cavity at nearer to the conductor is shown in Fig. 5. This model has been used to study the influence of cavity size and position on PD activity.
Fig. 5. Cable model with cavity nearer to conductor
5
RESULT
AND
DISCUSSION
5.1EFFECT OF CAVITY
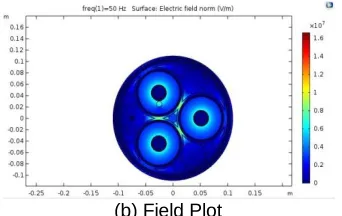
The life time of cable can be predicted from the analysis of electric stress on the cable insulation with and without cavity. If a cable sample without cavity, it can be observed that the electric potential and field have uniform distribution as they reach to its maximum value at the surface of the conductor and reduce gradually across the different components of the cable. In this work, cable sample with artificial cavities of 2, 4, 6, 8 and 10mm diameter are created at different position of the XLPE insulation is analyzed. It can be observed that the electric potential and field have Non -uniform distribution along surface of the cable due to the effect of cavity. The surface plot of electric potential and field distribution of a cable with 10mm cavity nearer to conductor is shown in Fig. 6.
2709 (b) Field Plot
Fig. 6. Cable with 10mm cavity nearer to conductor
5.2FEATURE EXTRACTION
Features like Variance, Standard Deviation, Average values are evaluated from electric potential and field distribution Line plot of 2, 4, 6, 8 and 10mm cavity. These features are used to analyze the effect of cavity on electric stress of the cable. The line plot of electric potential distribution for 10mm cavity is shown in Fig. 7.
Fig. 7. Line plot of electric potential distribution
The electrical stress in the cavity increases, when the dielectric strength is decreases. The electric field distribution of the cable is affected by void shape, size and location. The line plot of electric field distribution for 10mm cavity is shown in Fig. 8.
Fig. 8. Line plot of electric field distribution
Various parameters like maximum, minimum, variance, standard deviation, average values of the electric potential and field distribution are given in the Table 4 and 5 respectively.
TABLE 4
ELECTRIC POTENTIAL DISTRIBUTION FEATURES FOR WITHOUT,2MM,6MM AND 10MM CAVITY
Electric Potential Distribution Cavity Size Without
Cavity
2mm 6mm 10mm
Cavity Position Near Center Last Near Center Last Near Center Last
Max (E+5) 1.27 1.27 1.27 1.27 1.27 1.27 1.27 1.27 1.27 1.27
Min (E+4) 2.81 2.81 2.81 2.81 2.78 2.79 2.80 2.73 2.76 2.77
Var (E+8) 10.4 6.10 4.52 5.02 8.31 6.87 7.32 8.99 9.12 9.13
SD (E+4) 3.22 2.47 2.13 2.24 2.88 2.62 2.71 3.0 3.02 3.02
Avg (E+4) 5.84 8.17 7.0 6.03 7.52 6.92 6.51 6.82 6.91 6.87
The evaluated parameters clearly show the severity of discharges take part inside the HV cable. In submarine cable, the prediction of electric stress in the defects is very difficult by using the analytical method, but it is achieved by simulation method. In the present study, the efficiency of the cable can be
analyzed by using COMSOL software. The electric field and potential distribution is highly affected by electrical conductivity, relative permittivity and dielectric strength of the materials involved in the cable design. The atmospheric temperature also affects the performance of the cable.
TABLE 5
ELECTRIC FIELD DISTRIBUTION FEATURES FOR WITHOUT,2MM,6MM AND 10MM CAVITY
Electric Field Distribution Cavity Size Without
Cavity
2mm 6mm 10mm
Cavity Position Near Center Last Near Center Last Near Center Last
Max (E+6) 7.04 7.5 7.03 7.06 8.03 6.72 6.91 7.47 6.80 6.62
Min(E+6) 2.60 2.58 2.33 2.13 2.44 2.06 1.88 2.20 1.79 1.52
Var (E+6) 1.94 2.40 1.52 1.27 3.62 2.24 1.68 4.22 2.60 1.74
SD (E+12) 1.39 1.54 1.23 1.12 1.90 1.49 1.29 2.05 1.61 1.32
Avg (E+6) 3.74 4.81 4.22 3.80 4.60 4.27 4.03 4.38 4.26 4.13
From the simulation results, if any defects exist in the insulation of cable the electric field is distorted across the surface of defects. The features of electric field distribution for each size of cavity were illustrated on Table. V. From these values, it can be determined that the electric field is influenced by the size of the void. The electric field is high when the size
2710 distribution. The cavity is located at nearer to the conductor,
then electric stress is maximum in the cavity. If the cavity is positioned at the center of the insulation, then the field distribution in the cavity is non-uniform. The electric field in the cavity is decreases, when the cavity is located far away from the conductor.
6
CONCLUSION
In this study, a three core submarine cable used for connecting the offshore farms to onshore stations is analyzed using COMSOL Multiphysics. In this method the electric field and potential distribution of the cable is obtained by using FEM. In this work, cavities are simulated in submarine power cable to analyze the characteristics of cable insulation with defects. From the obtained simulation results, it was concluded that the electric field is influenced by the size and the position of the cavity. The electric field stress increases, when the size of the cavity is small. In addition, the electric field is higher when the cavity is positioned at nearer to the conductor.
REFERENCES
[1] Abdelghani MATINE, Monssef DRISSI-HABTI, ―On-Coupling Mechanical, Electrical and Thermal Behavior of Submarine Power Phases‖, Energies, 12, 1009, pp. 1-11, March 2019.
[2] Osama E. Gouda, Adel A. ElFarskoury, Abd Rabu Elsinnary, Adel A. Farag, ―Investigating the effect of cavity size within medium-voltage power cable on partial discharge behavior‖, IET Generation, Transmission & Distribution, Vol. 12 Iss. 5, pp. 1190-1197, March 2017. [3] Belkacem Yousfi, Ibn Khaldoun Lefkaier, ―Simulation of
Partial Discharges Initiation in Voids in Medium Voltage Cables Insulators‖, IEEE Transactions on Dielectrics and Electrical Insulation Vol. 25, No. 3; pp.892-899, June 2018.
[4] Hazlee Illias, George Chen, Paul L. Lewin, ―Partial Discharge Behavior within a Spherical Cavity in a Solid Dielectric Material as a Function of Frequency and Amplitude of the Applied Voltage‖, IEEE Transactions on Dielectrics and Electrical Insulation Vol. 18, No. 2; pp.432-443, April 2011.
[5] H.A. Illias, M.A. Tunio, A.H.A. Bakar, H. Mokhlis G. Chen, ―Partial Discharge Phenomena within an Artificial Void in Cable Insulation Geometry: Experimental Validation and Simulation‖, IEEE Transactions on Dielectrics and Electrical Insulation Vol. 23, No. 1; pp.451-459, February 2016.
[6] Sushman Kumar Kanikella, ―Electric Field and Thermal Properties of Dry Cable Using FEM‖, TELKOMNIKA, Vol.11, No.5; pp. 2271-2276, May 2013.
[7] H.A. Illias, G. Chen, P.L. Lewin, ―Partial discharge within a spherical cavity in a dielectric material as a function of cavity size and material temperature‖, IET Science, Measurement and Technology, Vol. 6, Iss. 2, pp. 52–62, 2012.
[8] Seok-Ju Lee , Hae-Jin Sung , Minwon Park , DuYean Won , Jaeun Yoo, Hyung Suk Yang, ―Analysis of the Temperature Characteristics of Three-Phase Coaxial Superconducting Power Cable according to a Liquid Nitrogen Circulation Method for Real-Grid Application in Korea‖, Energies, 12, 1740,pp. 1-11, May 2019.
[9] Francisco de Leon, Georg J. Anders, Fellow, ―Effects of Backfilling on Cable Ampacity Analyzed With the Finite
Element Method‖, IEEE Transactions on Power Delivery, Vol. 23, No. 2; pp.537-543, April 2008.