Medical Image Denoising Using Different
Techniques
Dev. R. Newlin, C. Seldev Christopher
Abstract : During image acquisition and transmission process, it may often get corrupted by noise. Still it is a challenging problem for researchers to remove noise from the original image. In diagnosis, medical images were used as it carries very important information about human organs. In this project, the proposed techniques will keep the important information or details of the image unaffected and remove the noise. In this project for improving the quality of the images, Image enhancement was implemented. The proposed techniques for medical image denoising are Wavelet transform, Fast Non Local Mean Filter (FNLM), Convolution Neural Network(CNN), Convolution Auto Encoder (CAE) and Curve let transform. After denoising Image quality was measured based on Peak Signal-to-Noise Ratio (PSNR), Mean Squared Error (MSE), Cross Correlation, Carrier Noise Ratio (CNR), Information Entropy (IE) and the Structural Similarity Index Metric (SSIM). After analyzing the results, it was noticed that the images were enhanced and their quality were quietly high.
Keywords : Wavelet transform, Curve let transform, Fast Non Local Mean Filter, Convolution Auto Encoder, Convolution Neural Network
————————————————————
.
1 INTRODUCTION
Very important information about our body organs and structures was carried by medical images. Depending on the imaging modality the tools acquired to collect the medical images usually produce some noises. For the diagnosis of patients, image enhancement and denoising is needed. To remove the error in the form of noise and to enhance or improve the quality of image by contrast improvement of the medical image, using a transform method and CNN algorithm or constructing up an algorithm is very important. The goal of image quality measurement is to measure the strength of the perceptual resemblance between Denoised images and reference images. During the screening, diagnostic stage or treatment phase, medical information comprising of images, clinical data and other physiological signals, has come to be an essential part of a patient’s care. Over the past three decades, the development of digital medical imaging has facilitated by the rapid developments in Information Technology (IT) and medical instrumentation. This development is mainly connected with Magnetic Resonance Imaging (MRI), Computed Tomography (CT), mammography, nuclear medical imaging with Single Photon Emission Computed Tomography (SPECT), the various digital radiological processes of vascular, cardiovascular and contrast imaging and Positron Emission Tomography (PET). Also there are denoising techniques like Median filter, Wiener filter, Average filter, Principle Component Analysis (PCA), Wavelet Thresholding, Independent Component Analysis (ICA) and Topographic ICA.
The prime focus of this project is to evaluate the performance of Fast Non Local Mean Filter (FNLM), Wavelet transform, Curve let transform, Convolution Auto Encoder (CAE) and Convolution Neural Network (CNN)in denoising data and to perform comparative studies. The main advantages of CNN over other signal processing methods are its multi-scale view of the components of a signal and space-frequency localization to identify spatial structure in transects data. Based on background of the research and the issues related to it, the papers have been conveyed as follows:
1.1 The denoising of medical images is done using Wavelet transform, Curve let transform, Fast Non Local Mean Filter (FNLM), Convolution Auto Encoder (CAE) and Convolution Neural Network (CNN) techniques.
1.2 To evaluate the performance of Convolutional networks and wavelet transform in removing noise from medical images by measuring Peak Signal-to-Noise Ratio (PSNR), Mean Squared Error (MSE), Cross Correlation, Information Entropy (IE), Carrier Noise Ratio (CNR) and the Structural Similarity Index Metric (SSIM) to further evaluate their performance on removing noise of medical images.
1.3 To relate the performance for denoising medical images. The organization of the paper is section 2 deals with the related work, section III the methodology of proposed work is described, section IV the result and discussion in the experiment is described and also performance measures of proposed work and section V describes the conclusions and feature enhancement.
2 RELATED
WORK
Paper [1], has discussed the NLM filter concept, initially this filter chooses the threshold value based on the pixel. Second, the window adaptation technique is done based on the identified threshold value. Another similar method has been suggested in [2] where weighted sum or weighing term is tailored by adding extra voxels with the concept that human brain is compound and has a lot of distinctive structures. Each pixel value has been doubled in mid-sagittal plane. Various scan is used to capture the denoise images. Rician noise is added and it is detached by fuzzy resemblance based NLM filter as proposed by Sharif et al [3]. The NLM filter in combination with patch and pixel similarity is suggested by ________________________________________
•
Dev. R. Newlin is currently pursuing doctoral degree research in Prist University, Thanjavur, India.. E-mail: [email protected] PH-94434501491062 the author Zhang et al. [4]. In this paper, particle safeguarding
Rician NLM filter is used by manipulating the weight with collective patch and pixel similarity. Same method has been implemented in [5] by refining the territory distance among neighborhoods of two vectors which is used for dependable assessment of dispersion kurtosis imaging using DWI data and unneeded data acquired at dissimilar ‘b’ values. Yang et al. proposed the transformation methods [6] which illustrated the worth of their method by transforming the image by difference stabilizing transformation continued by pre-smoothing RVIM noise troubled MR images with the filter Gaussian. Paper [7] with concept on multivariate statistical method uses Principal Component Analysis (PCA) for the precise judgment of the correlation or covariance structure of the data to compute the uncorrelated and correlated set of data. To become accustomed for spatially unreliable RVIN noise, a non-local PCA disintegration with sliding window is normally used. The consequential filtered image is used to decide voxel resemblances in a rotationally unchanging NLM filter. Multidimensional PCA along with NLM filter for 3 Dimensional MR image is projected by Chang et al. [8].
3 SYSTEM
MODEL
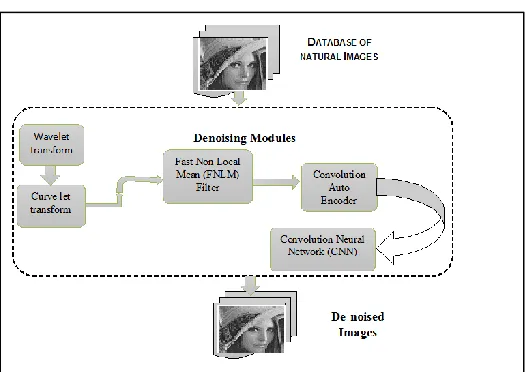
Fig: 1 System architecture for natural image denoising
Figure 1 represents the architecture of the proposed system. Brain database are chosen for natural image denoising. After image acquisition the RVIN noise (Random Value Impulsive Noise) is added in the variance of 0.1. When the noise is added, various denoising algorithms are used to evaluate and calculate the performance of the system.
3.1 WAVELET TRANSFORM
A time-frequency illustration of an analyzed signal is provided by a powerful tool named as wavelet transform that has the main advantage of its ability to obtain the information like time, location, and frequency of an image simultaneously, while the Fourier transform provides only the frequency information of the signal. Mathematically, a wavelet can be explained as a real-valued function ψ(t) which satisfy the conditions:
∫ ψ(t)dt = 0
and ∫ |ψ(t)| dt = 1 (1)
The medical image which is given as input is tainted with different varieties of noise and this corrupted image is altered using 3D DWT into wavelet domain. On completion of one stage of 3D DWT, the image data is decomposed into HHH, HHL, HLH, HLL, LHH, LHL, LLH and LLL. The fairly accurate signal, resultant from scaling operations only, goes to the subsequent octave of the 3-D transform.
The probability density function is given by, P(g)=
p(
)
(2) where,
is an energy normalization.
3.2 CURVE-LET TRANSFORM
Is a new type of multi-scale transform that relies upon wavelet. Curve let transform is a type of run of typical multi-scale geometric investigation technique, which is produced based on the wavelet transform. It has the better peculiarity characteristics and it could keep more edge data of images. By using de-noising technique we obtain the better output from the original image. The restored image has less noise while comparing other images. Suppose f(m,n) an image is corrupted by the RVI noise, as given by
g(m,n) = f(m,n) + η(m,n)
(3)
where η(m,n) are autonomous similarly distributed Gaussian unsystematic variable with zero mean and variance σ2. Image de-noising algorithms differ from simple threshold to difficult representation based methods. However simple threshold techniques can eliminate majority of the noise.
3.3 NLM FILTER
3.4 CONVOLUTIONAL NETWORKS
By using Deep Learning Technique, automatic detection of Cell under Cancer affected regions are identified and has classified under various subclasses. Deep learning of neural networks requires large amount of training sequences. The proposed method performed effectively which is better than the previous standardized methods as it does not need segmentation of images at the microscopic level as required by other methods of feature extraction. In Cartesian coordinate the equation is given in Equation (4) as,
(x − a) + (y − b) = r (4)
The hidden layers in Deep Learning is most powerful so that they can detect and classify automatically at specific cancerous cells from larger microscopic data set. The fitness value in an image is given by the Equation (5),
f = + 1
(5)
where W denotes the input volume size, K is the size of kernel field and S is total number of pixels, P is the padded values to the image. The value of P is given at the Equation(6),
P = (K − 1)/2
(6)
The main principle of Deep learning is the creation of the model for classification based on the prediction of given reference features of current value of element of dataset. The proposed research work carried with ResNet-50 has 6 hidden layers which are fully connected for the deep learning classification. The ResNet-50 has the input layer, hidden layers and output layers. The feature extraction part deals with the ResNet-50 that is mainly composed of repetitive building blocks which are densely connected at the output stage. In each of the internally linked building block, there are always direct associations from any of the layer to all successive layers. Feature descriptors are used for detecting and describing local image features. The aim of a descriptor is to find an image feature and describe it in a way that is not affected by perspective, scale, occlusion or illumination. Detecting features and extracting descriptors in an image can be done by using feature extractor algorithms. These steps can have various masks but the linear value is basically dominant. In the process of training, the chosen features are mined from all the working out images, and the classifier is taught on the mined features to generate a categorization model. This replica is then used to categorize the test image into the previously defined category in the testing phase. Then, one categorization model is developed in training phase and is applied on the test image in order to arrange it into the predefined category. The output of this categorization is classified into any number of possible classes. Based on this yield and having a prior knowledge that which classes were helpful to build each one of the four categorization models, the eligible categorization model is easily determined. An uncertainty matrix represents detail about actual and categorized cases formed by the categorization system. The classifier output of test data is matched with the original class quality to obtain the uncertainty matrix. This Brightness luminance algorithm is applied with intensity values or the channel value without involving the changing factors related to the hue values and also saturation values of the image.
4 PERFORMANCE
MEASURES
For the calculation of the PSNR, The Mean Squares Error has to be calculated as in Equation (7)
MSE = ∑ [ ( ) ( )]
(7)
where M1 and N1 are the number of rows and columns in the input image. The PSNR value with the maximum input image fluctuation is given as in Equation (8)
PSNR = 10 log (
) (8) The Root Mean Square is given by the Equation (9)
RMSE = MSE (9)
The Correlation Energy of the sample under consideration is given by the Equation (10)
C =∑ ∑ * [ ]+ c (10)
where μ = ∑ iPd[i j] and σ = ∑ i Pd[i j] − μ
The energy corresponding to the pixels values C(i,j) is given by the Equation (11)
L = ∑ ∑ |C(i j)| (11)
5 RESULT
AND
DISCUSSION
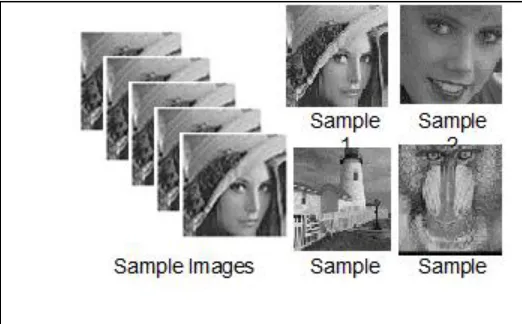
The proposed algorithm has been realized using Matlab on a windows PC having CPU speed of 2.6 GHz and 4 GB of RAM in MATLAB 2018a. A large set of experiments are performed on several datasets. The sample images are from the database. These Images are obtained from standard medical images. Here some of the images are analyzed and are given into the CAD system. Some samples are taken out to show that it is been used for analyzing the output of the proposed system shown in Figure 2.
1064 Fig : 3. Denoising result for Leena image (a) Input image
(b) Random value impulsive noise (c) Wave let transform output (d) Curve let transform output (e) Fast NLM filter output (f) CAE output (g) CNN network output (h) Stochastic gradient descent CNN output.
Fig :4 Denoising result for Helan image (a) Input image (b) Random value impulsive noise (c) Wave let transform output (d) Curve let transform output (e) Fast NLM filter output (f) CAE output (g) CNN network output (h) Stochastic gradient descent CNN output.
Fig :5 Denoising result for Light-House image (a) Input image (b) Random value impulsive noise (c) Wave let transform output (d) Curve let transform output (e) Fast NLM filter output (f) CAE output (g) CNN network output (h) Stochastic gradient descent CNN output.
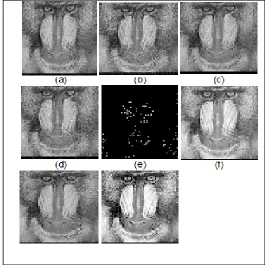
Fig :6 Denoising result for Baboon image (a) Input image (b) Random value impulsive noise (c) Wave let transform output (d) Curve let transform output (e) Fast NLM filter output (f) CAE output (g) CNN network output (h) Stochastic gradient descent CNN output.
The ROC Curve depicts the comparison of the various classifiers along with the proposed Classifiers. The True Positive value is high which implies that the method outperforms the other method for easy analysis of the cancerous cells from the RBC cells.
Fig 8: Bar representation of MSE, PSNR and SSIM values
Fig 9: Comparison of various parameters related to the existing and proposed method
TABLE:1 PERFORMANCE METRICS
Methods PSNR Cross
Correlation SSIM CNR IE MSE
Wavelet
Transform 21.29 0.97 0.49 6.1 7.26 0.017 Curve let
Transform 21.3068 0.98 0.53 7.53 6.68 0.015 Fast NLM
Filter 22.45 0.987 0.57 7.915 7.19 0.013 CAE 23.40 0.998 0.68 8.02 8.45 0.04 Stochastic
CNN Gradient
29.74 0.999 0.710 8.30 10.69 0.0022
From the table 1, it is inferred that the performance metrics of the natural image The experimental result proves that by using the Deep learning classifier, the overall accuracy is high related to traditional algorithms. From our experiments on different images, it is observed that the proposed method works well on both the cases when the objects in the image were indistinct and distinct from the background.
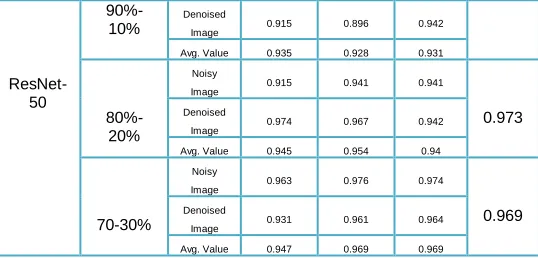
TABLE 2. PERFORMANCE ANALYSIS OF THE RESNET-50
Deep Learning
Data (Testing- Training)
Type of
Class Sensitivity Specificity Precision Accuracy
Noisy
Image 0.959 0.961 0.919 0.971
ResNet-50
90%-10%
Denoised
Image 0.915 0.896 0.942
Avg. Value 0.935 0.928 0.931
80%-20%
Noisy
Image 0.915 0.941 0.941
0.973 Denoised
Image 0.974 0.967 0.942
Avg. Value 0.945 0.954 0.94
70-30% Noisy
Image 0.963 0.976 0.974
0.969 Denoised
Image 0.931 0.961 0.964
Avg. Value 0.947 0.969 0.969
To evaluate the performance based on classification, the entire dataset is divided into training and testing data. In-order to determine the influence of these data in performance the testing-training data are splitted into three fashions at 90-10%, 80-20% and 70-30% respectively for both benign and malignant tumors in blood cells. An average of results are obtained for both the for easy comparison as in Table 2.
5
CONCLUSION
CAD system is a highly powerful tool used for diagnosis while doing image processing applications. In natural images, the noise could be inserted due to many reasons. However, the major source of addition of noise occurs at the time of acquiring and trans-mission. The level of this noise can be suppressed or detached using proper denoising filters. Thus the process of denoising should be implemented to advance the quality of image for more improved diagnosis. There are several articles which have been published on database image denoising techniques, the advantages and limits of those methods are discussed in this article. To have a better output when operating on images contaminated with noise, the denoising method always requires a preceding acquaintance of the noise map and its adaptability. The final objective of noise lessening methods is to acquire piecewise stable This paper in total has summarized the rebuilding of database image, the noise perceivable in database image, the different denoising methods and relative study based on their output which is calculated using numerical performance metrics such as MSE, PSNR, CNR, IE and SSIM. Nevertheless, a solo database image denoising technique will not be competent to wrap all profit in terms of noise lessening, edge protection, robustness, user interaction, applicability to the diverse acquisition methods and working out cost. Every day, the imaging methods and the different algorithms for noise reduction are getting upgraded. Hence, the denoising methods also should be improved. The aim of this review is to offer an on the whole view of noise in database image and obtainable denoising techniques. The study of noise will be helpful to the developers to extend new denoising methods for database images.
6
REFERENCE
[1] Aksam Iftikhar, Muhammad, Abdul Jalil, Saima Rathore, and Mutawarra Hussain. "Robust brain MRI denoising and segmentation using enhanced non‐ local means algorithm." International Journal of Imaging Systems and Technology 24, no. 1 (2014): 52-66.
1066 resonance images using collaborative non-local
means. " Neuro computing 177 (2016): 215-227. [3] Sharif, Muhammad, Ayyaz Hussain, Muhammad
Arfan Jaffar, and Tae-Sun Choi. "Fuzzy similarity based non local means filter for Rician noise removal." Multimedia tools and applications 74, no. 15 (2015): 5533-5556.
[4] Zhang, Xinyuan, GuirongHou, Jianhua Ma, Wei Yang, Bingquan Lin, Yikai Xu, Wufan Chen, and Yanqiu Feng. "Denoising MR images using non-local means filter with combined patch and pixel similarity." PloS one 9, no. 6 (2014): e100240. [5] Zhou, Min-Xiong, Xu Yan, Hai-Bin Xie, Hui Zheng,
Dongrong Xu, and Guang Yang. "Evaluation of non-local means based denoising filters for diffusion kurtosis imaging using a new phantom." PloS one 10, no. 2 (2015): e0116986.
[6] Yang, Jian, Jingfan Fan, Danni Ai, Shoujun Zhou, Songyuan Tang, and Yongtian Wang. "Brain MR image denoising for Rician noise using pre-smooth non-local means filter." Biomedical engineering online 14, no. 1 (2015): 2.
[7] Manjón, José V., Pierrick Coupé, and Antonio Buades. "MRI noise estimation and denoising using non-local PCA." Medical image analysis 22, no. 1 (2015): 35-47.
[8] Chang, Liu, GaoChaoBang, and Yu Xi. "A MRI denoising method based on 3D nonlocal means and multidimensional PCA. "Computational and mathematical methods in medicine 2015 (2015). [9] Satheesh, S., and K. V. S. V. R. Prasad. "Medical
image denoising using adaptive threshold based on contourlet transform." arXiv preprint arXiv:1103.4907 (2011).