Licensed under Creative Common Page 610
http://ijecm.co.uk/
ISSN 2348 0386
CREATING SIMULATION PROGRAMS FROM GRAPHICAL
MODEL OF DISCRETE SYSTEM
Pooya Parsa
M.Sc. in Artificial Intelligent, Amirkabir University of Technology, I.R. Iran [email protected]
Saeid Parsa
Retired Researcher, Materials and Energy Research Center, I.R. Iran [email protected]
Abstract
Computer simulation is a method helping managements and system developers to model
system using digital computers. The present paper proposes a front-end program reading an
image of an activity cycle diagram file as input, a graphical construction of simulation models
presenting the desired system to be simulated, to produce simulation program. By using
designed Graphical User Interface (GUIs), the program parameters such as simulation duration,
activity time and initial number of elements in the queues are interactively obtained from users.
After that, the program generator produces a simulation program in Matlab programing
language in accordance with system information; users could then modify the generated
simulation program as they desired. Our experiences suggest that the proposed approach could
increase programming design efficiency.
Keywords: Activity cycle diagram, GUI, Front end, System management, Design efficiency
INTRODUCTION
Licensed under Creative Common Page 611
Arena (Systems Modeling) and Simula8 (Babulak & Wang, 2010, Pidd, 2004). Graphical construction of simulation models is a technique that has greatly advanced the use of simulation. Graphical representations can be categorized into two groups:
Block diagrams – represent the equations and sequence of calculations that in turn represent the system of interest, used with the systems analysis simulation approach, an example of that is program flow chart.
State diagrams – represent the events and transitions between events that occur in the system
of interest, used with the discrete event simulation approach, an example that is activity cycle diagram (Tocher, 1963).
Activity cycle diagram is one of these state diagram tools which is widely used by simulation experts to describe the system, they mainly divide system into entities, each entity could engage in queues represented by circles and activities which is represented by rectangles connected by dotted lines. The system activity cycle diagram could be drawn by any drawing packages and stored in bit map form. The graphic file is read by the simulation package front end, queues and activities are recognized and corresponding parameters like activity duration and initial values in queues are obtained using interactive Graphical User Interface (GUI). Many simulation packages are designed to work with these diagrams, so the front end that will be described could be used for many working simulation packages.
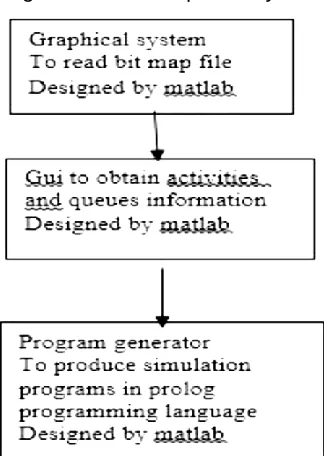
Top down interaction between parts of software
Hierarchical presentation of interaction between different parts of package is given in figure 1.
Licensed under Creative Common Page 612
Graphical system program reads the bit map file containing the system described in the form of activity cycle diagram. Number of queues and activities and there order is deduced from diagram, figure 2. GUI system program interactively ask name and properties queues and there initial state, figure 4. The activities name and entities involved in them and their duration statistical distribution is then chosen, figure 3. The obtained information is feed into program generator and the program generator produces a simulation program. This program has the required Skelton for a simulation program and the analyst can add more required information as he desired.
Technical aspects of reading cycle diagram and corresponding GUIS
To recognize different elements of activity cycle diagram different Matlab functions in the following manner are used, the bit map file is read and a function converts it to RGB global threshold (level) that can be used to convert an intensity image to a binary image.
The function uses Otsu's method, which chooses the threshold to minimize the intra class variance of the black and white pixels. Multidimensional arrays are converted automatically to 2-D arrays using reshape. The function ignores any nonzero imaginary part, and another function converts image to binary image. The output image BW replaces all pixels in the input image with luminance greater than level with the value 1 (white) and replaces all other pixels with the value 0 (black). Specify level in the range [0, 1]. A filtering function that removes from a binary image all connected components (objects) that have fewer than P pixels, producing another binary image. The roundness of each shape in the diagram is found using area and the coordinates of shapes (Tocher, 1963). Obviously circles have a higher roundness coefficients, from which queues and activities are recognized and dotted lines are chosen as connectors because they have not roundness coefficient and are ignored. After recognition of queues and activities their parameters are obtained using suitable GUIs.
Licensed under Creative Common Page 613
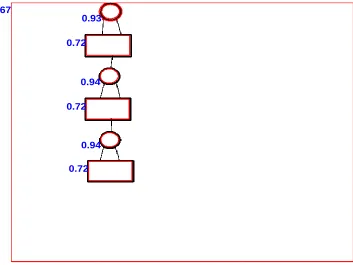
Figure 2: recognized elements with corresponding roundness coefficient
After recognition queues and activities second program system using this information will obtain their parameters through appropriate GUIs. Name of each activity, its duration in terms of statistical distributions or constant value and entity names that are engaged in is obtain by following GUI.
Figure 3: GUI to obtain activity parameters
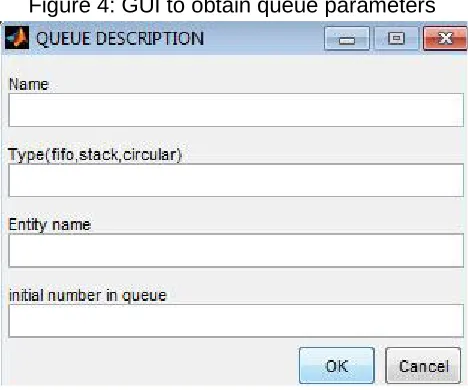
Queues name, their types, entities engaged in and initial number in the queue are also obtained.
Recognised queues and activities with corresponding circular coefficients
0.67
0.72
0.72
0.72 0.94
Licensed under Creative Common Page 614
Figure 4: GUI to obtain queue parameters
From above information a program generator designed in Matlab, produces a simulation program in Matlab.
CONCLUSIONS
The paper proposes a method to produce a simulation program from a graphical model in which, two main elements of simulation program namely queue and activity are represented as circle and rectangle, respectively. For recognizing these two modeling elements, roundness coefficient of detected connected components are utilized as a measure of classification. The data acquired from all entities of system under investigation, such as activities name and duration, queues name and initial values could be an input to a program consisting of a time scan algorithm, entity handling section, and list of activities with their related conditions and their duration stated in different functions, to produce a simulation program in Matlab. Our experiences indicates that the proposed approach could improve programming time and design efficiency especially for top management. In the future research, we intend to use obtained information from graph recognition system to generate simulation programs in any other computer languages such as C++, Python and Java.
REFERENCES
Babulak, E., & Wang, M. (2010). Discrete event simulation. AitorGoti (Hg.): Discrete Event Simulations. Rijeka, Kroatien: Sciyo, 1-9.
Matlab R20013b help manual (2013).
Pidd M. (2004) (ed) Systems modelling: theory and practice. John Wiley & Sons Ltd, Chichester.
Pidd, M. (1998). Computer simulation in management science, John Wiley & Sons Press