United Kingdom Vol. VI, Issue 1, January 2018
Licensed under Creative Common Page 327
http://ijecm.co.uk/
ISSN 2348 0386
THE INFLUENCE OF HUMAN RESOURCE INFORMATION
SYSTEMS ON COMPETITIVE ADVANTAGE OF FIRMS
LISTED ON THE NAIROBI SECURITIES EXCHANGE
Margaret Muthoni Kariuki
University of Nairobi, Department of business administration, Nairobi, Kenya [email protected], [email protected]
Peter K’ Obonyo
University of Nairobi, Department of business administration, Nairobi, Kenya
Martin Ogutu
University of Nairobi, Department of business administration, Nairobi, Kenya
Abstract
The main objective of the study was to determine the influence of human resource information
system on competitive advantage of firms listed on the Nairobi Securities Exchange. The study
was grounded on human resource flow theory. The study population consisted of 62 companies
listed on the Nairobi Securities Exchange. The study used a cross sectional survey design.
Data was collected at one point in time across the organizations. The primary data was
collected through a questionnaire. The respondents were 62 heads of HR departments in
different firms. The response rate was 63%. Data was analyzed through both descriptive and
inferential statistics. The statistical significance of the hypothesized relationship was interpreted
based on coefficient of determination and beta coefficient. The findings indicated that HRIS had
a positive significant effect on competitive advantage. The results of this study contribute to
knowledge by confirming that there is a relationship between HRIS and competitive advantage
Future researchers should incorporate multiples sources such as line managers, workers,
customers, suppliers and other stake holders of the company. The study only used
self-administered survey questionnaire. The researcher assumed that the responses would provide
Licensed under Creative Common Page 328
instruments should be considered in future. The study confined itself to quantitative data
collection methods and analysis. Future research could use both quantitative and qualitative
data collection methods, which could probably obtain richer data and results.
Keywords: Human resource information systems, competitive advantage, Human resource flow
theory, Nairobi Securities Exchange
INTRODUCTION
Organizations operate in a dynamic environment that is dynamic and competitive environment. They need quality information to make sound decisions in response to changes in the environment. For this reason, organizations are continually developing HRIS. This enhances their ability to make informed decisions that help them gain competitive advantage (Tansley, Newell & Williams, 2001). Many organizations spend large amounts of money on HRIS but most of them utilize it just for HR routine purposes which ensure administrative efficiency rather than strategic efficiency which leads to competitive advantage. Some organizations still strive to integrate the HRIS with their overall information system. Greater use of HRIS, at the operational level rather than strategic level, adds little value to a firm’s competitive advantage (De Sanctis,
1986). Some organizations are unable to make use of HRIS due to lack of support by top management through the existing system, lack of knowledge on HRIS and because of dependence on traditional methods. Companies listed on NSE operate in a competitive and dynamic environment. They therefore need quality information to make sound decisions in response to changes in the environment and quest to gain competitive advantage.
HUMAN RESOURCE FLOW THEORY
Licensed under Creative Common Page 329 A resource- flow theory of the human resource information system is identified as the supporting theory for the study. It focuses on the flow of human resources through the firm (Mcleod& De Sanctis, 1995). It recognizes that the firm’s environment provides a pool of potential employees
who are subjected to a screening process before joining the firm. While in the firm, the employees receive training and education performs their tasks and receives evaluation. Eventually the employees terminate their employment and return to the environment. The employees who retire continue to receive benefits. The tasks of the HRIS is to gather the data that tracks this human resource flow, store the data until it is needed and use the data to produce the information that enables person both in the firm and its environment to monitor the flow (Mcleod and De Sanctis, 1995).
The resource flow theory of Human Resource Information Systems (HRIS) consists of three subsystems, which include the data input, HRIS databases and output subsystems. The three input subsystems that enter information into the database are HR data processing, HR research and HR intelligence. The data processing subsystem consists of personnel data describing, HR transactions and pay roll data. The data payroll subsystems gather data from both internal and external environment. The HR research subsystems conduct special studies to provide data to firms on HR related activities. The input data come from both inside and outside the firm. HR intelligence subsystem has the responsibility for keeping current on environmental activities that are very important in human resource activities. Data information is gathered from the government, labour unions, competitors and suppliers, local and financial communities (McLeod and De Sanctis, 1995).
The HRIS database is the computer storage composed of all information and data from the input. The storage units can reside in IS, HR or other locations. HRIS database consists of a number of special databases such as employee database, executive search firm databases, college databases, employment agency databases and public access databases. The data describes the firm employees and the environmental elements with which HR interfaces. Output subsystems consist of software that converts data in the database into information outputs. The software may include mathematical models, report writers, office automation packages such as e-mail, desktop publishing and expert systems. HRIS output has six subsystems that include work force planning, recruitment, workforce management, compensation, benefits and environmental reporting which transforms data into useful information and make it available to the users who include individuals and organizations (Wickramaratna, 2011).
Licensed under Creative Common Page 330 utilize it just for HR routine purposes which ensure administrative efficiency rather than strategic efficiency which leads to competitive advantage (De Sanctis, 1986).
The study adopted the HR flow model because it provides a good framework of HRIS components that should be present and their relationship within a system view. The human resource flow theory provides a good framework for organizing and assessing the major HRIS components. The theory also provides a basis for monitoring progress in HRIS applications development and overall maturity in HRIS discipline. The three main concepts of a system are inputs, processes and outputs, which address a wide variety of HRIS applications thus making the HR flow theory appropriate for this study (Wickramaratna, 2011).
LITERATURE REVIEW
Several studies concur on the positive influence of HRIS on competitive advantage (Broderick & Boudreau, 1992; Powell & Dent-Micallef, 1997; Hendrickson, 2003).A study conducted by Troshani et.al. (2010) explored the organizational adoption of HRIS of sixteen Australian public sectors. They found that HRIS had been used as a source for achieving cost savings and inimitable competitive advantage. Although the study brought some insight on how HRIS brings a positive relationship with competitive advantage, the study considered factors such as technology context, organization context and environment context as determinant of HRIS competitive advantage. This study focused on (strategic integration, planning and forecasting, human resource analysis, communication and integration, record and compliance) as the independent variable. The study is based on the Australian public sector, and therefore its external validity cannot be ensured. Consequently their finding was not generalized beyond the context of their study suggesting that further research is required in other contexts. The current study focused on companies listed on the Nairobi Securities Exchange in Kenya which has varied contexts since it is composed of private and public sector.
Licensed under Creative Common Page 331 their main competitive advantage. The study developed human resource flow model that provided the theoretical foundation of the current study by providing HRIS applications framework. This study only used HRIS dimensions, which include strategic integration, forecasting and planning, communication and integration, records and compliance and HR analysis. The study did not use firm profitability and public image as measures of competitive advantage.
Krishna and Bhaskar (2011) examined the support and benefits of HRIS in medium-scale textiles industry of Hyderabad with a sample of 98 using stratified sampling. Data analysis was performed using cumulative weighted average technique that concluded high levels of information systems exists in medium scale textiles industry and they are able to attain only 2/3 of the benefits. Further the research, based on an evolutionary view of computing growth, suggests improvements in HRIS in order to gain competitive advantage and to maximize the benefits. The study assumed the relationship between HRIS and competitive advantage. This study did not use HRIS dimensions such as strategic integration, forecasting and planning, communication and integration, HR analysis and records and compliance. The study did not use firm profitability and public image as measures of competitive advantage.
Were et.al. (2013) studied resource availability and utilization on the performance of Nairobi police force in Kenya. Using a sample of 150 police officers the researchers found that resource availability and utilization has a positive influence on the performance of the police officers. 10.9% of the corresponding change can be explained by a unit of change in the performance of the police officers. While ICT have led to improvement in the performance of the police in other countries the study found that in the case of Nairobi, ICT is completely not used except at the Police Headquarters/Vigilance House. This study did not use HRIS dimensions such as strategic integration, forecasting and planning, communication and integration, records and compliance and HR analysis. The study did not also use firm profitability and public image as measures of competitive advantage.
Licensed under Creative Common Page 332 RESEARCH METHODOLOGY
Research Design
A descriptive cross-sectional survey was carried out to determine the influence of HRIS on competitive advantage of companies listed on Nairobi Securities Exchange. Data was collected at one point in time across 62 firms; thus cross-sectional survey was the most appropriate. This means that each respondent filled one questionnaire, once during the entire data collection period. The target population of this study was62 companies listed on Nairobi Securities Exchange in Kenya. Census method was used as the number was large enough to collect information.
Data Collection Method
A closed ended questionnaire was used to collect primary data from the companies listed on NSE. The questionnaires was designed on a five-point Likert scale. The responses ranged from 1= strongly disagree; 2 =disagree; 3 = neither disagree nor agree; 4= agree; 5= strongly agree. The questionnaire was divided into two parts. The part A was designed for the statement measuring HRIS on a scale of 1-5. The measures were adapted from Wickramaratna(2011); Part B asked the respondents to rate the competitive advantage where firm profitability adapted from (Busienei, 2013). Cronbalch alpha coefficient was used to determine the reliability of the data collection. As a rule of thumb, the cut-off point value of 0.7 was used. The competitive advantage had reliability coefficient of 0.828 and HRIS with 0.815 respectively. The Cronbalch Alpha of the constructs in the study were well above the threshold of 0.7.
Prior to testing hypotheses using regression analysis it was ensured that the basic assumptions for the application and interpretation of the results were satisfied. Thus Test for normality was carried out a prior to test of hypotheses. The Shapiro-Wilki was used to test normality. Shapiro-Wilki value of less than 0.05 significantly deviates from a normal distribution and suggests that use of statistical tests that require normally distributed is inappropriate.
Table 1. Results of the Tests of Normality test
Variables Shapiro-Wilki
Statistic Df Sig.
HRIS .987 30 .964
Competitive Advantage .962 30 .350
Licensed under Creative Common Page 333 Both descriptive statistics (mean, standard deviation and coefficient of variation) and inferential statistics (regression analysis) were used to analyse the data. Linear regression for (Ha1), was
used to establish the nature and magnitude of the relationship between HRIS and competitive advantage.
ANALYSIS AND FINDINGS
Descriptive Statistics
The findings from the data analysis comprised the means, standard deviations and coefficient of variations considered in the study which include independent variable of HRIS and the dependent variable of competitive advantage. The respondents were asked to indicate the extent to which they agreed or disagreed with statements describing the various variables. This section was designed for the statement measuring HRIS on a scale of 1-5 which was measured according to Wickramaratna (2011) ranging from 1= strongly disagree; 2 =disagree; 3 = neither disagree nor agree; 4= agree; 5= strongly agree.
Human Resource Information System
The study set out to establish HRIS practices in companies listed on the Nairobi Securities Exchange. The respondents were asked to indicate the extent to which their firm focused on the following dimensions of HRIS which includes: strategic integration, forecasting and planning, HR analysis, communication and integration and record and compliance. HRIS was computed as the simple average of the mean score of the five dimensions.
Strategic Integration
Strategic integration was assessed by asking the respondents to indicate the extent to which their firm uses HRIS for strategic integration. Nine items were used to measure strategic integration.
Table 2. Strategic Integration
Items N Mean Standard
Deviation
Coefficient of
variations%
Top managers strongly support the use of HRIS. 39 3.92 0.87 22 Top management makes use of HRIS to make
decisions. 39 3.85 1.37 36
There is seamless flow of information between
Licensed under Creative Common Page 334 The seamless flow of information between
various departments affects the quality of HR decisions in our organizations.
39 3.21 1.61 50
HRIS eliminates skill gaps across the
organization. 39 3.41 1.55 45
HRIS provides an opportunity to become
strategic partner. 39 2.05 1.10 54
Alignment of the role of HRIS with the
organizational HR strategy. 39 2.31 1.06 46 Alignment of the role of HRIS with the
organization information system strategy. 39 2.05 0.89 43 HRIS bring out decisions made at the higher level
by senior manager. 39 2.15 0.88 40
Total aggregate 39 2.80 0.66 24
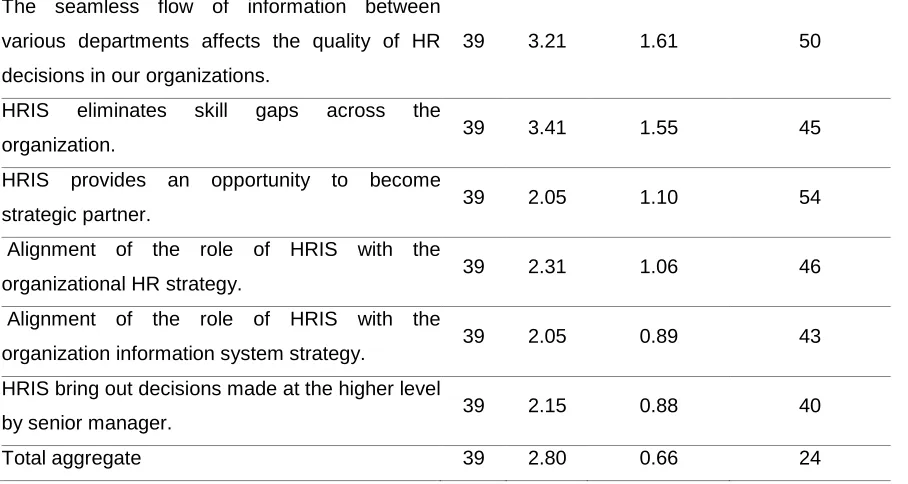
The results in Table 2 reveal that aggregate means score for the nine statements used to measure use of HRIS strategic integration was 2.80, Standard deviation was 0.66. The coefficient of variation was 24 percent which show moderate use of strategic integration. The standard deviation and the coefficient of variation indicated a close agreement among the respondents on the moderate use of strategic integration. The lowest mean was on role of HRIS aligns with the organizational informational system with a mean of 2.05 and a standard deviation of 0.89 and coefficient of variation of 43 percent, implying that there is low alignment of HRIS with organizational informational system which most respondents seems to agree on. The item on HRIS provides an opportunity to become strategic partner recorded the lowest (mean= 2.05, standard deviation = 1.10, Coefficient of variation= 54 percent). This reveals that most of the HR managers in companies listed on the Nairobi Securities Exchange had diverse opinions on HRIS providing an opportunity to become strategic partners. HRIS focuses on decisions made at higher level by senior managers had a mean of 2.15 and standard deviation of 0.88, implying that HRIS does not focus decisions made at higher level by senior managers.
The highest mean was on seamless flow of information between various departments with a mean of 4.10, standard deviation of 0.85 and coefficient of variation 21 percent, implying that there is good communication among the various departments in the organization. This corroborates the study of Musyoka (2012) stated that use of increased formal communication reduce role ambiguity and role conflict.
Licensed under Creative Common Page 335 Forecasting and Planning
The respondents were asked to indicate the extent to which their companies used HRIS for forecasting and planning. Forecasting and planning was measured using 12 items anchored on a five point Likert type scale. Most of the items were borrowed from (Wickramaratna, 2011).
Table 3. Forecasting and Planning
Items N Mean Standard
Deviation
Coefficient of
variation %
My organization uses HRIS to plan and forecast for succession.
39 2.10 0.995 47
My organization uses HRIS to forecast and plan supply of human resources.
39 3.46 1.48 43
My organization uses HRIS to forecast and plan future human resources requirement of the organization.
39 3.62 1.55 43
My organization uses HRIS to forecast and plan for performance appraisal.
39 2.38 1.09 46
My organization uses HRIS to forecast and plan for salary and wages.
39 2.21 1.08 49
My organization uses HRIS information to forecast and plan future supply and for labour.
39 2.31 1.13 49
My organization uses HRIS to forecast and plan for promotion.
39 2.49 1.10 44
My organization uses HRIS to forecast and plan for transfers
39 2.33 1.01 43
My organization uses HRIS to forecast and plan for recruitment and selection.
39 2.23 0.87 39
HRIS in my organization support forecasting and planning for staffing needs
39 3.03 1.48 49
My organization uses HRIS to forecast and plans for employees’ relations.
39 3.00 1.49 50
My organization uses HRIS to forecast and plans for health and safety.
39 2.23 1.11 50
Total Aggregate 39 2.63 0.62 24
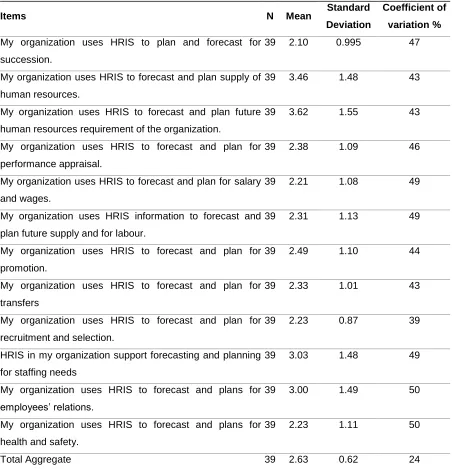
Licensed under Creative Common Page 336 among the respondents on forecasting and planning. ‘My organization uses HRIS to forecast and plan future human resources requirement of the organization’ had the highest mean of 3.62,
a standard deviation of 1.55 and deviation of a correlation of 43 percent. This means that companies listed in Nairobi Securities Exchange had diverse opinions on the agreement that they use HRIS to forecast and plan future human resource requirement. The finding results reveal that the companies listed on the Nairobi Securities Exchange use HRIS to forecasts and plan for human resource requirement and supply of human resources and not the others.
Human Resource Analysis
The respondents were asked to indicate the extent to which their companies use HRIS for human resource analysis. Human resource analysis was measured using twenty three (23) sub-constructs anchored on a five point Likert type scale. The pertinent results are presented in Table 4.
Table 4. Human Resource Analysis
Items N Mean Standard
deviation
Coefficient of
variation %
HRIS constantly identifies and matches the demand for human resources.
39 3.18 1.54 48
HRIS analyses supply of human resources. 39 3.15 1.65 52 HRIS identifies unfilled positions accurately. 39 2.90 1.52 52 HRIS enables the organization to have the right number
and kind of employees, at the right place, at right time.
39 4.37 1.07 24
HRIS analyses each job title and positions 39 3.72 0.69 18 HRIS analyses employees in each position. 39 2.21 1.03 47 HRIS performs comprehensive tracking and reporting of
candidates and applicants
39 2.23 1.22 55
HRIS reduces the recruiting cost. 39 2.51 1.12 45 HRIS maintains skill inventory. 39 2.38 1.07 45 HRIS evaluates the recruiting process effectively. 39 2.46 1.00 40 HRIS leverages employees’ talents in the right place, in
the right time.
39 2.13 1.03 48
HRIS provides insight in into organizations training needs.
39 2.44 1.17 48
The end results of HRIS training need analysis is accurate.
Licensed under Creative Common Page 337
Items N Mean Standard
deviation
Coefficient of
variation %
HRIS evaluates the effectiveness of training needs. 39 2.56 1.10 43 HRIS evaluates the budget of the training and
development programs.
39 2.49 1.14 46
HRIS generates faster decisions about successor rankings.
39 3.08 1.51 49
HRIS assess specific key positions and target specific employees as potential successors.
39 4.38 1.14 26
HRIS determines logical progression path and steps required for advancements.
39 4.33 0.74 17
HRIS places employee to required position and keep track of their movements.
39 1.67 1.01 60
HRIS assist to determine and develop an attractive benefit program that retain employees.
39 2.08 1.16 56
HRIS analysis employee skills and qualifications. 39 1.97 1.05 53 HRIS monitors the progress of aligning corporate goals
with employees’ goals
39 3.31 1.17 35
HRIS supports a performance-oriented compensation programmes
39 3.77 1.18 31
Total Aggregate 2.67 0.41 15
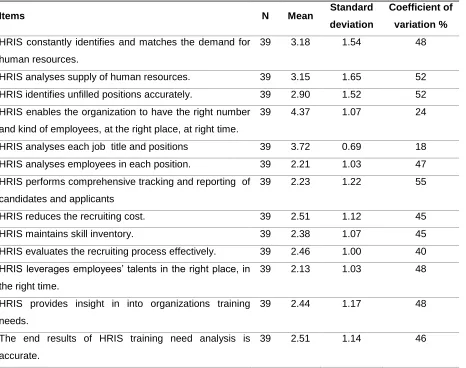
The findings reveal that mean score for the twenty three statements used to measure human resource analysis was 2.67. The aggregate mean score of 2.67 (neither disagree nor agree), standard deviation of 0.41 and coefficient of variation of 15 percent shows that a large number of HR managers have general disagreement that HR analysis is used in their companies. The majority of the respondents felt that HRIS is used to identify specific key positions and target specific employees as potential successors which had a mean of 4.38, a standard deviation of 1.14 and coefficient of variation of 26 percent. The HR managers of the companies listed on the Nairobi Securities Exchange had a diverse opinion on the agreement that HRIS is used to identify specific key positions and target specific employees as potential successors. The suggestion that ‘HRIS connects employee to required position and keeps track of their movements’ had the lowest mean of 1.67, a standard deviation of 1.01 and coefficient of
Licensed under Creative Common Page 338 Communication and Integration
The questions in this section were meant to determine the extent to which communication and integration is used by companies listed on the Nairobi Securities Exchange. The respondents were asked to indicate the extent to which their companies use HRIS for communication and integration. To measure communication and integration a set of nine items were used. The pertinent results are presented in Table 5.
Table 5. Communication and Integration
Items N Mean Standard
Deviation
Coefficient of
variation %
My organization uses HR intranets for communication.
39 3.64 1.14 31
My organization uses portal to gather and present information from its employees.
39 4.00 1.00 25
My organization uses emails to communicate inside and outside the organization.
39 3.85 1.57 41
My organization uses websites to communicate within and outside the organization.
39 2.36 0.96 41
My organization receives application through online.
39 2.23 0.96 43
My organization uses application service provider to manage HRIS.
39 2.26 0.99 44
HRIS simulations models support HR decisions.
39 2.36 0.90 38
HRIS develops an environment of open communication between management and employees
39 2.54 0.97 38
HRIS perceive the integrity and effectiveness of current communication culture.
39 4.28 1.28 30
Total Aggregate 39 2.93 0.46 16
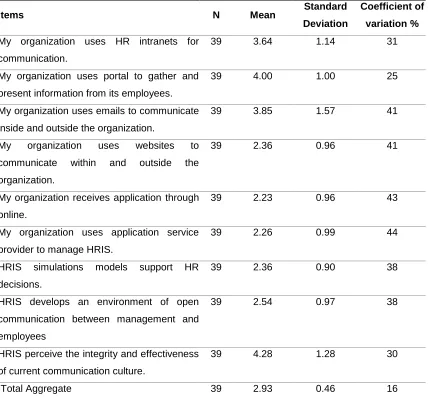
Licensed under Creative Common Page 339 coefficient of variation of 30 percent followed by the statement, ‘the organization uses portal to gather and present information from its employees,’ which had a mean score 4.00, standard
deviation of 1.00 and coefficient of variation of 25 percent. This means that the majority of companies HR managers feel that HRIS is able to perceive the effectiveness and integrity of current communication culture. They also feel that the companies listed on the Nairobi Securities Exchange uses portal to gather and present information from its employees, which had a mean of 4.00 and a standard deviation of 1.00. This means that the companies use HRIS communication and integration in certain areas and not others.
Records and Compliance
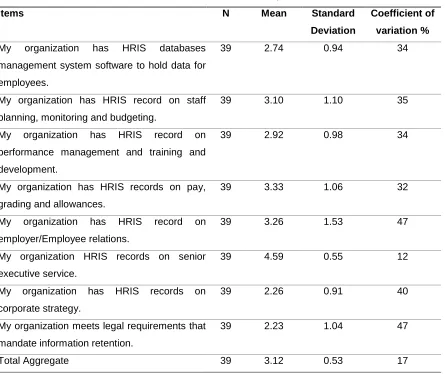
The respondents were asked to indicate the extent to which their companies use HRIS for record and compliance. Record and compliance was measured using 8 items anchored on a five point Likert type scale. The pertinent results are presented in Table 6.
Table 6. Records and Compliance
Items N Mean Standard
Deviation
Coefficient of
variation %
My organization has HRIS databases management system software to hold data for employees.
39 2.74 0.94 34
My organization has HRIS record on staff planning, monitoring and budgeting.
39 3.10 1.10 35
My organization has HRIS record on performance management and training and development.
39 2.92 0.98 34
My organization has HRIS records on pay, grading and allowances.
39 3.33 1.06 32
My organization has HRIS record on employer/Employee relations.
39 3.26 1.53 47
My organization HRIS records on senior executive service.
39 4.59 0.55 12
My organization has HRIS records on corporate strategy.
39 2.26 0.91 40
My organization meets legal requirements that mandate information retention.
39 2.23 1.04 47
Licensed under Creative Common Page 340 Table 6 findings reveal that the mean score for the 8 items used to measure records and compliance was 3.12. The aggregate mean score of 3.12 (neither disagree nor agree), standard deviation of 0.53 and coefficient variations of 17 percent reveals that HR managers are moderate on the use of records and compliance in their organizations.
The majority of HR managers strongly agreed that a company that has HRIS record on senior executive service which had a mean of 4.59, standard deviation of 0.55 and coefficient of variation of 12 percent. The lowest mean was on whether they meets legal requirements that mandate information retention which had a mean of 2.23, standard deviation of 1.04 and coefficient of variation 47 percent. The majority of the organizations had general disagreement on the statement whether they meets legal requirements that mandate information retention which implies that the companies listed on the Nairobi Securities Exchange do not meets the legal requirements that mandate information retention.
Competitive Advantage
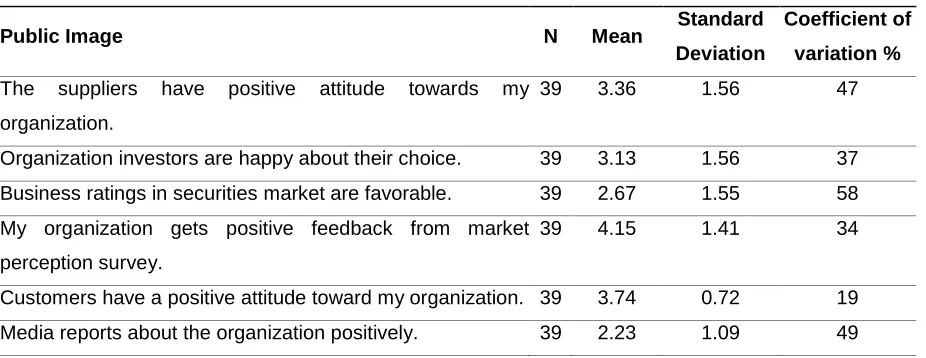
Firm experiences competitive advantage when its action in an industry or market creates economic value and when few competing firms are engaging in similar actions. Competitiveness is the capacity of the firm to achieve its target (Barney, 2001). The study set out to establish competitive advantage practices in companies listed on the Nairobi Securities Exchange. The respondents were asked to indicate the extent to which their firm focused on the following dimensions of competitive advantage which includes: public image, profitability. HRIS was computed as the simple average of the mean score of the five dimensions. Table 7 show how dimensions of competitive advantage were used in companies listed on the Nairobi Securities Exchange.
Table 7. Competitive Advantage
Public Image N Mean Standard
Deviation
Coefficient of
variation %
The suppliers have positive attitude towards my organization.
39 3.36 1.56 47
Organization investors are happy about their choice. 39 3.13 1.56 37 Business ratings in securities market are favorable. 39 2.67 1.55 58 My organization gets positive feedback from market
perception survey.
39 4.15 1.41 34
Licensed under Creative Common Page 341 The surrounding community has a positive attitude towards
my organization.
39 2.21 1.20 54
Employees have a positive attitude toward my organization. 39 2.49 1.10 44
Aggregate 2.92 0.58 20
Profitability
My organization high profitability from current operations without regard to the interest charges accruing from the capital structure.
39 2.36 1.04 44
My organization ability to yield profits and cover operating expenses is usually high.
39 2.44 0.97 40
My organization earnings available to the owners of common stockholders are usually high.
39 2.10 1.00 47
My organization return on sales (net profit margin) is usually high.
39 2.44 1.17 48
My organization gross profit margin is usually high, 39 2.51 1.14 46 My organization after-tax profits per sales are usually high. 39 2.56 1.10 43 My organization operating profit margin is usually high. 39 2.46 1.10 44 My organization measure of the return on total investment
is usually high.
39 2.27 1.07 47
My organization measure of the rate of return on total investment which the owners of the common stock have made is usually high.
39 4.31 0.77 18
My organization measure of the rate of return on the stockholders investment is usually high.
39 4.33 0.74 17
Total Aggregate 2.73 0.45 16
The respondents were asked to indicate the extent to which public image practices are applied in their organization. The highest mean score was on my organization get positive feedback from market perception survey with a mean of 4.15, a standard deviation of 1.41 and coefficient of variation of 34 percent). This means that the majority of HR managers generally agree that ‘customers have a positive attitude toward my organization.’ This means they differed in
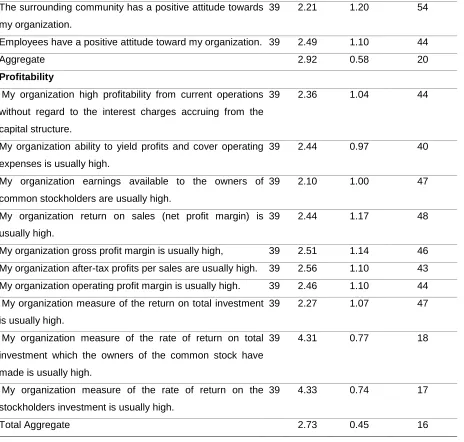
opinions despite the high score on their positive perception customer survey feedback on customer survey. This was followed by moderate score of 3.36, standard deviation of 1.56 and coefficient of variation of 47 percent on the statement that ‘suppliers have positive attitude towards the organization. This implies that the respondents had diverse opinions on supplier’s attitude towards the organization. The lowest mean score was 2.21 on the item that ‘the surrounding community has a positive attitude towards my organization’ with a standard
Licensed under Creative Common Page 342 deviation of 1.20, implying that respondents feel that the community have a negative attitude toward the organizations. The standard deviation of 1.20 shows that there were varied responses on the attitude of community towards the organizations. The overall mean score on eight statements on public image was 2.92 shows that the majority of HR managers of companies listed on the Nairobi Securities Exchange are neutral with the statements of public image practices in their organizations.
Ten items were used to measure profitability in organization drawn from Busienei (2014). The highest mean of 4.33 and coefficient of variation of 17 percent on the rate of return on the stockholders investment in the enterprise is high and standard deviation 0.74. This mean that the majority of HR managers generally agree that the measure of the rate of return on the stockholders investment in their organization is high. The measure of the rate of return on total investment which the owners of the common stock have made in the firm is usually high had the mean score of 4.31, a standard deviation of 0.77 and coefficient of variation of 17 percent. This mean that the majority of HR managers generally agree that the ‘measure of the rate of return
on total investment which the owners of the common stock have made in the firm is usually high.
The overall mean score of 2.73 and coefficient of variation of 16 percent show that the majority of HR managers of companies listed on the Nairobi Securities Exchange are neutral with the statements of profitability practices in their organizations.
Regression analysis (Inferential statistics)
Human Resource Information System and Competitive Advantage
The objective sought to determine the relationship between HRIS and competitive advantage. HRIS was measured using strategic integration, forecasting and planning, human resources analysis, communication and integration, record and compliance. The competitive advantage was measured using public image and profitability. Composite indices were computed for each of the constructs of HRIS and competitive advantage. Based on the objective, the following hypothesis was formulated which was tested using regression analysis:
Ha1: There is a significant relationship between HRIS and competitive advantage
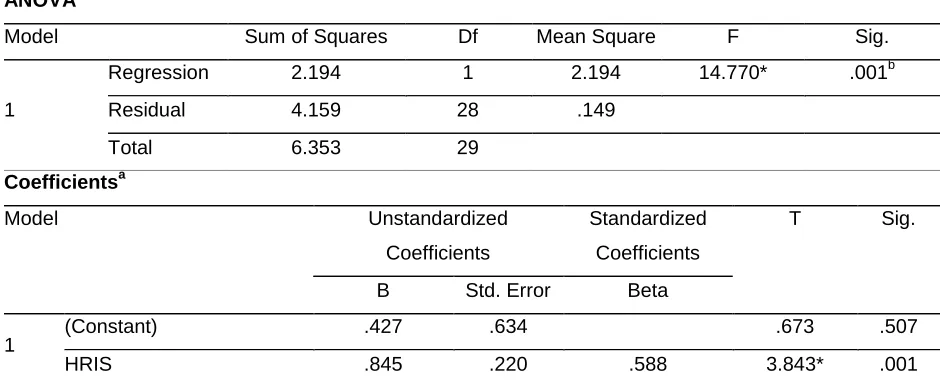
Table 8. Regression Results for the Effect of HRIS on Competitive Advantage
Model Summary
Model R R Square Adjusted R Square Std. Error of the Estimate
Licensed under Creative Common Page 343
ANOVAa
Model Sum of Squares Df Mean Square F Sig.
1
Regression 2.194 1 2.194 14.770* .001b
Residual 4.159 28 .149
Total 6.353 29
Coefficientsa
Model Unstandardized
Coefficients
Standardized Coefficients
T Sig.
B Std. Error Beta
1
(Constant) .427 .634 .673 .507
HRIS .845 .220 .588 3.843* .001
a. Dependent Variable: Competitive Advantage b. Predictors: (Constant), HRIS
c. *P<0.05
The results in Table 8 indicate that HRIS explained 34.5 percent (R2= 0.345) on the competitive advantage with remaining 65.5 percent explained by the other variables not in the study. The regression model was significant (F=14.770, p< 0.05) indicating that the model fit the data and thus was suitable for use in testing the hypothesis. The beta coefficient shows that HRIS had a significant effect on competitive advantage (B= 0.845, t=3.843, P<.05). This implies that a unit change in HRIS increases competitive advantage by 0.845 (84.5 percent). This confirms the hypothesis that there is a significant relationship between human resource information system and competitive advantage of firms listed in the Nairobi Securities exchange.
CONCLUSIONS
The first major finding from the objective of the study is that the relationship between HRIS and competitive advantage of firms listed on the Nairobi Securities Exchange was positive and significant. As shown in Table 8 for every one unit increase in the use of HRIS, competitive advantage increases by .845 or 84.5 percent. This is in line with many HRM scholars who argued that HRIS have effects on competitive advantage. Most of the research done has demonstrated statistically significant relationship between HRIS and competitive advantage. The current study agreed with Powell and Den Micallef (1997) on information technology and competitive advantage. They investigated linkages between information technology (IT) and firm performance. They found that IT when complemented with human resources was significant to competitive advantage. The current study is similar to Weeks (2013) who studied the impact of
Licensed under Creative Common Page 344 HRIS on employees of the major household appliance manufacturer in US. The study hypothesized that automated collection, storage and retrieve of information related to the human resource element in any large scale organization will help the organization to make more informed decisions concerning the hiring, the positioning, the utilization and the retention of its human resources that would lead competitive advantage.
This research presents some insights in the area of HRIS with special emphasis on the Kenyan situation and its contextual needs as developing. From resource flow theory it can be argued that HRIS components if well utilized organization can reap many benefits that provide economic value to firms. HRIS could provide organizations with high quality information that would enable the companies listed on the Nairobi Securities Exchange to make quality decisions in response to changes in the environment. The quality decisions will in turn lead to higher productivity and superior firm performance hence competitive advantage. The resource flow theory indicates that the HRIS components lead to competitive advantage. This is in line with studies by Kuhn, 1995; Mayfield et al, 2003; Casico, 2006; Obeidat, 2012. The results of the current study are thus consistent with HRM resource flow theoryThe Human resource flow theory contributes to this study by providing HRIS applications. The results of this study contribute to this theory by confirming that there is a relationship between HRIS and competitive advantage on companies listed on Nairobi Securities Exchange.
RECOMMENDATIONS FOR FURTHER RESEARCH
The researcher suggests that future research studies should be conducted using a different population and contexts. Future researchers could also consider introducing HRM practices as intervening variable and differentiation strategy as moderating variable. The data was collected from the HR managers only. This is likely to bring common method bias. Future researchers should incorporate multiples sources such as line managers, workers, customers, suppliers and other stake holders of the company. The study only used self-administered survey questionnaire. The researcher assumed that the responses would provide honestly and by a target group. The study confined itself to quantitative data collection methods and analysis. Future research could use both quantitative and qualitative data collection methods, which could probably obtain richer data and results.
REFERENCES
Ankrah, E., &Sokro, E. (2012). Human resource information system as a strategic tool in human resource management. Problems on Management in the 21st Century, 5, 6-15.
Licensed under Creative Common Page 345 Bidgoli, H. (2011). Successful introduction of cloud computing into your organization: A six-step conceptual model. Journal of International Technology and Information Management, 20(1), 1-10.
Boateng, A. A. (2007). The role of Human Resource Information Systems (HRIS) in Strategic Human Resource Management (SHRM). Master of Science Thesis in Accounting, Swedish School of Economics and Business Administration, Palovartijantie..
Broderick, R. & Boudreau, J. W. (1992). Human resource management, information technology, and the competitive edge. The Executive, 6(2), 7-17.
Broderick, R. F., & Boudreau, J. W. (1991). Human resource information systems for competitive advantage: Interviews with Ten Leaders. Centre for Advanced Human Resource Studies, School of Industrial and Labour Relations, Cornell University. Ithaca: New York.
Busienei, J. R. (2013). Business strategy, organizational structure, human resource strategic orientation and performance of large private manufacturing firms in Kenya. (Unpublished PhD Thesis), University of Nairobi.
Cascio, W. F. (2006). 10 Global performance management systems. Handbook of research in international human resource management. Cheltenham: Edward Eldgar.
De Sanctis, G. (1986). Human resource information systems: a current assessment. MIS Quarterly, 15-27.
Forrester, J.W. (1958), industrial dynamics: Major breakthrough for decision makers, Harvard business review, (36), 37-66.
Hendrickson, A. R. (2003). Human resource information systems: Backbone technology of contemporary human resources. Journal of Labour Research, 24(3), 382-394.
Hopeman, R.J (1969). System analysis and operations management. Columbus,OH: Charles E. Merril publishing company.
Mayfield, M., Mayfield, J. &Lunce, S. (2003). Human resource information systems: A review and model development. Advances in Competitiveness Research, 11(1), 139-151.
McLeod, R. &DeSanctis, G. (1995). Resource flow model of the human resource information system. Journal of Information Technology Management, 6, 1-16.
Mintzberg,H.(1979). The structuring of organizations: A synthesis of the. Engleland cliffs, NJ: Nunnally, J. (1978). Psychometric methods. Journal of Management Research, 4(4), 192-211.
Nunnally, J. C., Bernstein, I. H. & Berge, J. M. T. (1967). Psychometric theory. New York: McGraw-Hill. Obeidat, B. Y. (2012). The relationship between human resource information system (HRIS) functions and human resource management (HRM) functionalities. Macrothink, 4 (4), 192-211.
Powell, T. C. & Dent-Micallef, A. (1997). Information technology as competitive advantage: The role of human, business, and technology resources. Strategic Management Journal, 18(5), 375-405.
Powell, T. C. & Dent-Micallef, A. (1997). Information technology as competitive advantage: The role of human, business, and technology resources. Strategic Management Journal, 18(5), 375-405.
Research,Prentice Hall.
Tansley, C., Newell, S. & Williams, H. (2001). Effecting HRM-style practices through an integrated human resource information system: An e-greenfield site? Personnel Review, 30(3), 351-371.
Troshani, I., Jerram, C. & Gerrard, M. (2010). Exploring the organizational adoption of human resources information systems (HRIS) in the Australian public sector. In 21st Australian conference on information system, 1-3.
Troshani, I., Jerram, C. & Hill, S. R. (2011). Exploring the public sector adoption of HRIS. Industrial Management & Data Systems, 111(3), 470-488.