Clustering Algorithm As A Planning Support Tool
For Rural Electrification Optimization
Ronaldo Pornillosa Parreno Jr, Rowaldo Del Mundo
Abstract: In this study clustering algorithm was developed to optimize electrification plans by screening and grouping potential customers to be supplied with electricity. The algorithm provided adifferent approach in clustering problem which combines conceptual and distance-based clustering algorithmsto analyze potential clusters using spanning tree with the shortest possible edge weight and creating final cluster trees based on the test of inconsistency for the edges. The clustering criteria consists of commonly used distance measure with the addition of household information as basis for the ability to pay (ATP) value. The combination of these two parameters resulted to a more significant and realistic clusters since distance measure alone could not take the effect of the household characteristics in screening the most sensible groupings of households. In addition, the implications of varying geographical features were incorporated in the algorithm by using routing index across the locations of the households. This new approach of connecting the households in an area was applied in an actual case study of one village or barangay that was not yet energized. The results of clustering algorithm generated cluster trees which could becomethetheoretical basis for power utilities to plan the initial network arrangement of electrification. Scenario analysis conducted on the two strategies of clustering the households provideddifferent alternatives for the optimization of the cost of electrification. Futhermore,the benefits associated with the two strategies formulated from the two scenarios was evaluated using benefit cost ratio (B/C) to determine which is more economically advantageous. The results of the study showed that clustering algorithm proved to be effective in solving electrification optimization problem and serves its purpose as a planning support tool which can facilitate electrification in rural areas and achieve cost-effectiveness.
Index Terms: Benefit Cost Ratio, Centroid, Clustering Algorithm, Cluster Tree, Conceptual Clustering, Distance-based Clustering, Graph Tree,Inconsistent Edge, Kruskal’s Algorithm, Minimal Spanning Tree, MST diameter, Optimization, Routing Index, Rural Electrification
————————————————————
1 I
NTRODUCTIONRural electrification program aims to deliver electricity even at the most remote areas of developing countries. In line with this, the government recognized that electricity is the basic ingredient in the socio-economic development of rural areas. In providing them with adequate and continuous supply of energy like electricity, it enhances the quality of life of people in the countryside. Also, there will be an increase in the opportunities for the people to engage in livelihood and income-generating activities. While the government recognized the importance of rural electrification, their program was hampered by geographical and financial constraints. The power utilities and electric cooperatives tasked to deliver the government’s program were always bounded by making difficult choices about where, when and how best to carry it out. They are considering applying innovations in supplying the technologies and most importantly, they are thinking of what criteria should be used in electrifying rural barangays (villages with 50-250 households). The current practice, as dictated by financial logic, focuses on those areas with high economic growth potential and lowest cost.
But on this basis, this tends to prioritize urban areas rather than rural areas. The power utilities’ reason is the high cost
associated in setting up the network for remote barangays. When electrical lines are already available in the barangay, in many cases, only a few residents can afford to connect which compromises the utilities objective of delivering the supply of electricity in rural areas. The better approach is to find a better way of electrifying rural areas that incorporate local conditions, economic and technical conditions in the early planning stage of electrification. This looks into the different possibilities of setting up the network, screen and group the households by adding the household’s ability to afford the energy service. In this aspect, clustering algorithm can be used by power utilities in providing electricity to unelectrified barangays in the Philippines. This new and better approach is to find clusters of the households in the area which are to be electrified and at the same time satisfy the economic and technical aspects of electrification. In this method both goals are achieved; the electrification and the optimization at the minimum cost.
1.1 Research Gap and the Need for Clustering Algorithm in Rural Electrification
Previous studies focused more on the optimization of the different distribution network components like power technology selection, optimal sitting of power source and network components cost optimization. Many studies have been spent to come up with the most cost effective power network components which are no doubt a great contribution in the power sector. But if we want to provide immediate solutions to rural electrification, power network components optimization is only one side of the problem. The other side of the problem is to come up with the best way of connecting the customers in a rural area which is bounded by geographical and economic conditions. Location of the households and costs are two main considerations which have great impact on rural electrification planning and it makes sense that these two factors should be given emphasis in the optimization process. These two factors were the main consideration in developing the clustering algorithm. This is a good basis in coming up with an algorithm that can be applied to local conditions in rural areas. The local conditions that exist in rural areas cannot be
__________________________
Ronaldo PornillosaParreño Jr. is currently a Senior Science Research Specialist at the Industrial Technology Development Institute of the Department of Science and Technology and has a Master of Science in Energy Engineering obtained from the University of the PhilippinesPH+639228559372
E-mail: [email protected]
Rowaldo del Mundo is an Associate Professor at the Electrical and Electronics Engineering Institute of the University of the Philippines
113 solved by applying models that were used in other countries.
And engineers will agree that models developed for the planning of large network are not suitable for small power systems used in rural electrification mainly because of their complexity and lack of adaptability [R.K. Maskey, 2004]. Merely scaling down the electrification project will not completely satisfy the requirements of rural electrification. Although this could be a basis for adopting the criterion and processes to fit in our country’s local conditions; this means that this is just a starting point for developing a clustering algorithm that will become the basis for future planning of rural electrification.
1.3 Significance
Cost is the primary limiting factor why there are still unelectrified barangays in rural areas of the Philippines. The Department of Energy (DOE)which handles the electrification program of the Philippine government estimated that it will cost million of pesos to provide power to one barangay. So power utilities are always looking for the least-cost option before undertaking any electrification project. Electrification is a network problemand by optimizing the cost associated with the network path, the cost can be reduced. One way of minimizing the cost is finding the best way an area can be electrified by grouping the households in a barangay and forming clusters. The end result of providing electricity in the rural barangays will spur economic and development activities in these areas and thereby creating jobs and other necessary basic services such as education and health services. This will also encourage sustainable development and greatly improve the quality of life and reduce absolute poverty in rural regions which had been neglected for many years.
2
B
ACKGROUNDClustering problem is a very old problem which was the subject of numerous studies since the early 1960’s. The first extensive work in this field which attempted to unify the different approaches for solving the clustering problem was done by Sokal and Sneath in 1963 [A. Ferligoj]. Before this study, there were no specific solutions for clustering problems because the problems are solved separately for each particular application. But after this work, the field developed into a specific discipline within data analysis which is now known as clustering algorithm. Clustering problem is about partitioning a given data set into groups such that the data points in a cluster are more similar to each other than points in different clusters [S. Guha , R. Rastogi, K. Shim, 1998]. The main purpose is to partition the objects into subsets that will have meaning in the context of a particular problem. Thus, the main concern in the clustering process is to reveal the organization of patterns into sensible groups which allow us to discover similarities and dissimilarities as well as to derive useful conclusions about them [M. Halkidi, Y. Batistakis, M. Vazirgiannis, 2001]. This similarities and dissimilarities are the bases for choosing the algorithm that will result to a good clustering scheme for the data set. And the ―goodness‖ of the clustering scheme is defined by a good clustering criterion. Clustering criterion is the decisive factor which is not absolute and dependent on the result of the clustering that suits its needs. It mainly characterizes a clustering algorithm as well as its efficiency to define a clustering scheme that fits the data set [M. Halkidi, Y. Batistakis, M. Vazirgiannis, 2001]. This criterion is the basis for classifying the clustering algorithm into two
main categories: Distance-based and Conceptual clustering. Distance-based approaches have been the traditional method used in analyzing numeric data. This type of clustering uses similarity criterion expressed in terms of a normalized distance function which is typically metric. A distance function yields a higher value for pairs of objects that are less similar to one another. This algorithm requires the existence of a metric between points in the space where the most common metrics are Euclidean and Manhattan distance. Several works are based on traditional distance-based clustering and in particular the k-means algorithm which uses a centroid for each clusters [S. Epter, M. Krishnamoorthy, M. Zai]. In a study about distance-based clustering, the average minimal distance criterion was found to be a good criterion under special conditions and a solution to this problem was proposed using the concentration centroid minimum distance criterion. Traditional methods uses numerical values but as the application of clustering expand from scientific and engineering field to business and social domains, one has to handle problems with data features that are nominal-valued. Conceptual clustering is another way of clustering data which is based on the descriptive concepts the given set of data carry. Conceptual clustering is the clustering scheme for processing nominal-valued data which combines clustering with the concept formation and interpretation [G. Li., G. Biswas]. Entropy-based measures were studied as a clustering criterion for conceptual clustering problems where distance measures are inappropriate. They found out that entropy-based criterion can be derived from probabilistic clustering models and establishes the connection between the criterion and dissimilarity measures. Clustering algorithm had been around for more than three decades now and several areas had been the subjects of its application like grouping economies, regionalization, taxonomy, spatial data analysis and web data mining. But very limited studies had been done to provide an algorithm that will work on the clustering process of rural areas for electrification. The reason behind this is that no specific classification of algorithm for a particular purpose or application had been made. If an extensive study will be made on this particular area of application, clustering algorithm can become very relevant in planning electrification.
3
C
LUSTERINGA
LGORITHMF
ORR
URALE
LECTRIFICATIONare farming, handicraft, coconut and animal raising. The total land area is 4.15 square kilometers with only 97 households scattered in the barangay. During the study, it is one of the five remaining barangays in this town that still has no electricity. The main concentrations of the households are near the barangay hall and along the barangay road which extends to about 2.8 km from the main provincial road. After an actual site survey of the households, only 60 households from the total 97 households were used in this study. The 37 households that were not identified from the map cannot be located due to geographical constraints and remoteness.
3.1 Clustering Algorithm Application
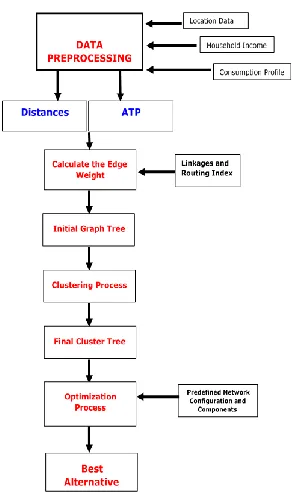
Clustering algorithm for rural electrification involves several steps as shown in Fig. 1, in order to determine the best clusters for this particular type of application.
Fig. 1.Flow Chart of the Clustering Algorithm Process
Step1: As a first step, all households in Añato were surveyed to determine household information that was used in data preprocessing. Three important household characteristics were decided to be the most beneficial in rural electrification based on similar studies, such as household income, size and load requirement. These data were used to calculate the ability to pay (ATP) value as shown in Table 1.
TABLE 1
SAMPLE CALCULATION OF ATPVALUES OF HOUSEHOLDS
Household Number
Distance between HH, m
Family Income
Family Size
Load Requirements
ATP Value H1 12 Low 8 Very Low 4.67
H2 12 Middle 5 Low 3.00
Step 2: Aside from the household information, distances between households were also gathered. The metric distances were obtained by an actual site survey using geodetic surveying measuring devices. But since the actual area was not all accessible due to some geographical constraints, some distance measures were the result of
approximate measurement using reference point in the map. Then using distance measures and the ATP values, the overall weighted edges (OWE) between households were calculated as shown in Table 2. The overall weighted edges were used instead of distance measure to take into account of the influence of the household characteristics in the clustering process.
TABLE 2
OVERALL WEIGHTED EDGE BETWEEN HOUSEHOLDS
Theschematic representation of the households and its approximate location is shown in Fig. 2. The households were plotted using circle as its representation in the map.
Fig. 2. Schematic Representation of Households Location
The links between households were represented by a line which is shown in Fig. 3. All the possible links were determined by an actual inspection of the area and routing index was used in deciding the only possible line routes. The routing index is very important in coming up with the initial graph tree because it eliminates routes which are not feasible and have very high cost if used as line routes.
Node Distance, meter
ATP value
OWE Node Distance, Meter
ATP Value
OWE
Fr To Fr To
115
Fig. 3. Graphic Representation of All Possible Links
Step 3: The initial graph tree was obtained from the graph by finding the network of data points having a total line length that is as short as possible but to which all households are connected in the graph tree. The minimal spanning tree (MST) or Kruskal’s Algorithm was used in this process to determine the initial graph tree.In the first and second trial, shown in Fig. 4a andFig. 4b, the total weighted edge lengths are 2599 and 2659 respectively, which are not the shortest total edge lengths. After series of trials, the total weighted edge length of 2469 is the shortest edge length compared to allsucceeding trials. All trials have 58 total links starting from the first node to the last node to create the graph tree.
(a) (b)
Fig. 4. Minimal Spanning Tree, a) Trial 1 and b) Trial 2
From the result of the last trial, the initial graph tree was obtained with a total weighted edge length of 2469. The representation of the initial graph tree of connected households in Añato after the last trial is shown in Fig. 5.
Fig. 5. Initial Graph Tree
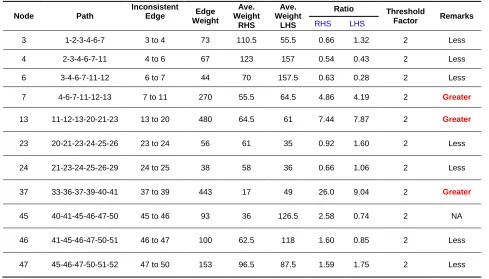
Step 4: After obtaining the initial graph tree, the next step in the clustering algorithm is to find the most sensible groupings of the households based on the clustering criterion which is the overall weighted edge (OWE) and the chosen threshold factor. The next process involves identifying inconsistent edges and removing it from the connected graph tree to get the final cluster trees. In identifying the inconsistent edges, the MST diameter was first obtained by locating the path with the most number of edges which is shown in Fig. 6. Using the MST diameter, the ratios can now be calculated for the edges only included in the diameter. Table 3 shows the calculated ratios for all the edges. The ratios, which were greater than the threshold value were labeled as inconsistent edges.
Fig. 6. MST Diameter of Initial Graph Tree
TABLE 3
CALCULATED RATIOS OF THE EDGES
Node Path
Inconsistent
Edge Edge Weight
Ave. Weight
RHS
Ave. Weight
LHS
Ratio Threshold
Factor Remarks RHS LHS
3 1-2-3-4-6-7 3 to 4 73 110.5 55.5 0.66 1.32 2 Less
4 2-3-4-6-7-11 4 to 6 67 123 157 0.54 0.43 2 Less
6 3-4-6-7-11-12 6 to 7 44 70 157.5 0.63 0.28 2 Less
7 4-6-7-11-12-13 7 to 11 270 55.5 64.5 4.86 4.19 2 Greater
13 11-12-13-20-21-23 13 to 20 480 64.5 61 7.44 7.87 2 Greater
23 20-21-23-24-25-26 23 to 24 56 61 35 0.92 1.60 2 Less
24 21-23-24-25-26-29 24 to 25 38 58 36 0.66 1.06 2 Less
37 33-36-37-39-40-41 37 to 39 443 17 49 26.0 9.04 2 Greater
45 40-41-45-46-47-50 45 to 46 93 36 126.5 2.58 0.74 2 NA
46 41-45-46-47-50-51 46 to 47 100 62.5 118 1.60 0.85 2 Less
47 45-46-47-50-51-52 47 to 50 153 96.5 87.5 1.59 1.75 2 Less
After calculating the ratios, three edges have higher values than two (2), the threshold factor. The edges are the links between 7 and 11 with ratios of 4.86 and 4.19, 13 and 20 with ratios of 7.44 and 7.87, and between 37 and 39 with ratios of 26.06 and 9.04. If only one edge has a higher threshold value, it is not considered as inconsistent edge, like in the case of link between 45 and 46 with a right-hand side of ratio of 2.58 and a left-hand side ratio of 0.74. The edges are shown in Fig. 7, where the dashed-lines represent the inconsistent edges in the MST graph tree.
Fig. 7. Inconsistent Edges of the Initial Graph Tree
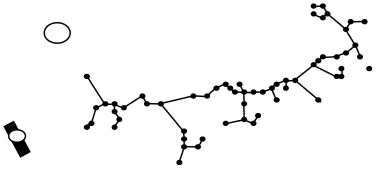
Step 5: The last step is to remove inconsistent edges by disconnecting all edges greater than the threshold factor from the graph tree. This separated groups of households from the tree to form the final clusters. The final groupings of households were obtained by removing edges 7 – 11, 13 – 20 and 45 – 46. The result of the clustering algorithm separated the households into four groups. The first group consists of 10
houses, the second group has 9 houses, the third group has 22 houses and the fourth group has 18 houses. The final clusters of households are shown in Fig. 8.
Fig. 8. Final Clusters of Households
3.2 Optimization
After applying the clustering algorithm to the subject barangay, the next logical step is to compute for the cost of electrification. This part of the study is very important to be able to test the result of the clustering algorithm if it is viable and cost effective. This also involves looking for the alternatives that will result to the optimum condition. The optimization process consists of reducing the cost of the whole area’s electrification by considering different scenarios and strategies. This also evaluates the result of the clustering algorithm if it satisfies the required specifications and economic conditions to make the result of clustering significant and reliable.
Inconsistent Edge
117
3.3 Scenarios
The load requirement is vital in any network system design. It is required to have a forecast on load growth for any electrification project unless there is strong evidence that load patterns will not change dramatically in the next couple of years. As planners and designers recommend, the present and future demands have a great influence on the network design and the timing of major reinforcements [E. Lakervi, E. Holmes, 1995]. In this study, the scenario was based on the effect of time to the growth of load in the area to be electrified. The initial load requirement was based on the consumption per household while the forecasted load growth was based on the number of individual customers with the assumption that the consumption per household will not significantly change. The following scenarios were used in this study:
Scenario 1: Year 0 – At present time when the electrification takes place, the consumption data is calculated on the current household electricity consumption Scenario 2: Year 5 – After five (5) years, an estimate in the
load growth is based on the increase of individual customers but consumption data per household remains the same
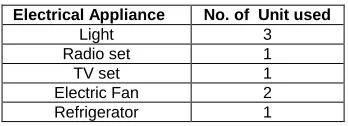
In order to determine theoretical load requirements for the households in the barangay, part of the household energy survey was to determine the different household appliances currently used by the residents as shown in Table 4. The study used 0.50 kW per household in line with the assumption used by the distribution utility in designing an electrification project.
TABLE 4
TYPICAL HOUSEHOLD APPLIANCES USAGE
Electrical Appliance No. of Unit used
Light 3
Radio set 1
TV set 1
Electric Fan 2
Refrigerator 1
From the table above, a typical household in Añato uses three lights, one radio, one TV and two electric fans but some households have bought refrigerator in anticipation of the electricity service. For scenario 1, the load estimate was computed using the actual number of household and the consumption data per household. For scenario 2, total load estimate was based on the forecasted growth of the number of individual customers or household. The growth in the number of household was determined using an information survey from the municipal planning department of town of Pagbilao. The total load requirements and the total number of households of the two scenarios are shown in Table 5.
TABLE 5
LOAD ESTIMATE OF DIFFERENT SCENARIO
Scenario 1: Year 0 Scenario 2: Year 5
Number of Household 60 a 115 b
Load Estimate 30 kW 60 kW
a
Data is based on actual household energy survey
b Data is based on the projected population survey done by the MPDO of Pagbilao
3.4 Strategies
For each scenario, one strategy was considered to find the most optimum condition that will bring electricity to the rural area. The final clusters of the households based on the clustering algorithm’s result serves as the initial network arrangement for the implementation of electrification project. The cluster of households is an important factor in formulating the strategies that were used in the optimization process since it finds the shortest possible line length and at the same time screens the most sensible groupings which make the layout design more accurate and precise. The final cluster trees for scenario 1 is the result of the application of the clustering algorithm to Añato, as shown in Fig. 9.
Fig. 9. Scenario 1: Final Clusters of Household
For scenario 2, the assumption made is that there will be an increase in the number of households in the barangay after five years. From the present 60 households, the number of total households will increase to 115 which mean an additional 55 households as shown in Fig. 10. The red dots represent the new households. However, the assumption in this study is that the consumption per household will not change after five years so the total load requirement was computed using 0.5 kW per household and it just doubled from 30 KW to 60 KW. The increase in load has an important implication on the clustering of households and the network components. Aside from this, the main reason for calculating future demands is to avoid wrong investments in the transmission and distribution system. Allowance for possible increase in load levels is incorporated in the initial stage of planning which is more acceptable than to make major revisions to distribution networks or their associated auxiliary systems at some later date which is very costly.
Fig. 10. Forecasted Household Distribution for Scenario 2
Tie-up Point
Cluster 1
Cluster 2
Cluster 3 Cluster 4
Barangay road
For the new households in scenario 2, the locations of the households were generated randomly based on the assumption that the concentrations of the households were along the road. All distance measures used for generating the initial graph tree were the results of estimates from the first scenario. Since there was no available household information for scenario 2, the distance measure is the only criteria used in the clustering process. After applying the first step in the clustering process, the initial graph tree is shown in Fig. 11 with a total edge length of 2533 meters.
Fig. 11. Initial Graph Tree of Scenario 2
The inconsistent edges were calculated using the same method. Then, the groupings were generated after identifying and removing inconsistent edges. The final cluster of the second scenario is shown in Fig. 12.
Fig. 12. Final Clusters of Scenario 2
Using the final clusters for the two scenarios and the weighted edge between households in each cluster, the centroids of each cluster were determined. From the idea of center of mass in Physics, centroids of the clusters were identified. However, in data analysis since it does not involve mass, centroid is the representative average point of the data points. It is the center about which data pointsare scattered. But in this study, the centroids were constrained along the road path due to radial condition. On-line software was used to locate the centroids of the two scenarios. In this study, two (2) types of strategies were implemented for the two case scenarios:
Strategy 1: At Scenario 1 (Year 0), Four (4) Centroids were used as the Location of the Transformers. The rated capacity of the transformers used was based on actual total load requirement per cluster.
Strategy 2: At Scenario 2 (Year 5), Three (3) Centroids were used as the Location of the Transformers. The rated capacity of the transformers used was 25 kVA per cluster which provided allowances for the possible load growth due to increase in the number of households after five years.
The summary of the two strategies and the load requirements per cluster is shown in Table 6. The transformer size used in each cluster depends on the calculated load requirements per cluster for strategy 1 and 25 kVA for strategy 2. The locations of the centroids for strategies 1 and 2 are shown in Fig. 13 and Fig. 14 respectively.
TABLE 6
LOAD REQUIREMENTS PER CLUSTER OF THE TWO STRATEGIES
Cluster No. Strategy 1 Strategy 2 Cluster 1 No. of Households 10 44
Load Requirement 5 kW 22 kW Transformer size 10 kVA 25 kVA Cluster 2 No. of Households 9 43
Load Requirement 4.5 kW 21.5 kW Transformer size 5 kVA 25 kVA cluster 3 No. of Households 22 27
Load Requirement 11 kW 13.5 kW Transformer size 15 kVA 25 kVA Cluster 4 No. of Households 18 -
Load Requirement 9 kW - Transformer size 10 kVA -
Fig. 13. Location of Centroids in Strategy 1
Fig. 14. Location of Centroids in Strategy 2
3.5 Cost Calculation
The components’ specifications and costs were obtained from MERALCO, the distribution utility using a computerized Tie-upPoint
Centroid 1
Centroid 2
Centroid 3 Centroid 4
Actual Centroid
Centroid Along the road
Tie-up point
Actual Centroid
Centroid Along the road
119 program to asses the actual cost and the location of the area
of electrification. These data were used in the computation of the initial capital investment cost.In Table 7, the summary of the capital investment cost, maintenance and operation cost is shown for the two strategies formulated at the two scenarios.
TABLE 7
COST ESTIMATES OF DIFFERENT STRATEGY
Strategy 1 Strategy 2
Capital Investment Cost, (P)
4,060,783.80 4,336,669.32
Maintenance & Operation Cost , (P)
203,039.19 260,200.16
Total Cost for the first year
P 4,263,822.99
P 4,596,869.48
3.6 Benefit/Cost Ratio
In the computation of the benefit/cost ratio, the first five years were considered since scenario 2 is the projected condition of the barangay after this period. The result of the computation of the B/C ratio for the two strategies is shown in Table 8.
TABLE 8
BENEFIT/COST RATIO FOR THE DIFFERENT STRATEGIES
Strategy 1 Strategy 2
Initial Investment, (P)
4,066,111.80 4,336,669.32
Annual Maintenance & Operation Cost , (P)
203,305.59 260,200.16
Equivalent Uniform Annual Cost (5yrs)
900,568.03 960,491.48
Revenue (P) 1,574,614.08 3,149,228.16
B/C, i = 3.5% 1.43 2.58
From the result of the B/C ratio for strategy 1 and strategy 2, both projects were economically advantageous since both ratios were greater than 1.00. But comparing the two strategies, strategy 2 with B/C of 2.58 should be selected since the B/C ratio almost doubled compared to strategy 1. This means that the desirability of strategy 2 translates to more profit in the next five years even if there is more investment in the first year compared to strategy 1.
4
C
ONCLUSION ANDR
ECOMMENDATION4.1 Conclusion
This study presented a different approach in providing electricity service in the rural areas especially given the condition that a barangay is willing to have the energy service but cannot be connected to a nearby tie-up point due to high cost. There are several ways to address this problem either by using planning models or technology innovations which are complex solutions. But the worst thing to do is to just electrify an area without considering the most cost-effective way to provide energy to the area. The use of planning tools will
prevent investment loss to the power utility and provides electrification to the barangay. A new and better way of addressing this problem is by utilizing the appropriate clustering algorithm that optimizes the cost of electrification and incorporates customer’s profile and routing index factor in the criteria. A combination of conceptual and distance-based clustering algorithms which was developed in this study, proved to be effective in solving the clustering problem. Rural households in the barangay were clustered for purposes of determining the optimal electrification strategy. The strategies generated from the result of clustering paved the way to different alternatives of connecting the area at the least cost option. based on the result of the case study, the new approach of utilizing clustering algorithm in electrification planning produced a better way of connecting group of households while looking at different strategies at two scenarios. The benefit cost ratio (B/C) was used in comparing the two alternatives which allows planner to choose the best option. The result of the B/C ratio showed that both strategies were economically advantageous. This indicates that the use of clustering algorithm achieved the very important aspect of rural electrification which is cost-effectiveness and at the same time satisfies the minimum requirements and specifications of the power utility. The clustering algorithm, therefore, served as a planning support tool which allows the design of rural electrification in recognition of existing constraints like economics and locations, and compares costs of alternatives towards a more reliable optimum condition. This study provided answers to the questions of the power utilities as to ―where‖, ―when‖ and ―how‖ to carry out rural electrification.
4.2 Recommendation for Future Work
The use of clustering algorithm in rural electrification will need updating to cope up with changing technologies and requirements. This study provided the answer whether clustering algorithm can be used in other field of study such as electrification optimization aside from the usual purpose. Rural electrification optimization will be added as the newest field of application of clustering algorithm if further development will continue. And in line with this, future study should focus on applying the algorithm to an area where topography and other geographical data are considered. GIS architecture could provide a more accurate geographical data by incorporating it in the gathering of the location of households. Design of computer software package of the clustering algorithm will also be a good area of study which could be very useful in dealing with the complex solutions of optimizing network components and configurations. Lastly, the inclusion of the technical performance and reliability in the algorithm will make the optimization more meaningful to power utilities.
A
CKNOWLEDGMENTR
EFERENCES[1] R.K. Maskey, ―Small-Hydroplants-Based Renewable Power Systems for Remote Regions,‖ Dissertation, University of Kalsruhe, 2004.
[2] A. Ferligoj,―Recent Developments in Cluster Analysis,‖Dissertation, University of Ljubljana
[3] S. Guha , R. Rastogi, K. Shim, ―CURE: An Efficient Clustering Algorithm for Large Databases,‖ Proc. IEEE Conference on Data Engineering, 1998.
[4] M. Halkidi, Y. Batistakis, M. Vazirgiannis, ―On Clustering Validation Techniques,‖Journal of Intelligent Infomation Systems, vol. 17, n0. 2/3, pp. 107-145, 2001.
[5] S. Epter, M. Krishnamoorthy, M. Zai, ―Clusterability Detection and Initial Seed Selection in Large Data Sets,‖Unpublished Paper presented to Computer Science Department, Rensselaer Polytechnic Institute, Troy, NY [6] G. Li., G. Biswas, ―Conceptual Clustering with Numeric and
Nominal Mixed Data: A New Similarity Based System,‖Dissertation, Department of Computer Science, Vanderbilt University, Nashville, TN
[7] E. Lakervi, E. Holmes, Electricity Distribution Network Design, 2nd Ed., Peter Peregrimus Ltd., England, Ch. 3,4,9,14, 1995.
[8] ―The Relationship of Regression Line and Centroids,‖ available at http://illuminations.nctm.org
[9] R. Grimsdale, P. Sinclair, ―The design of House-Estate Distribution System using a Digital Computer,‖Proc. IEE, vol. 107A, pp. 295-305,1960.
[10] E. Dorado, E. Miguez, ―Design of Large Rural-Voltage Networks Using Dynamic Programming Optimization,‖IEEE Transcations on Power Systems, vol. 16, no. 4, pp. 898-903, 2001.
[11] M. Carson, G. Cornfield, ―Design of Low-Voltage Distribution Networks,‖Proc. IEE, vol. 120, no. 5, pp. 585-592, 1973.
[12] L. Evers, ―Model-based Clustering, K-means and SOMs,‖ Sem., University of Oxford,2004.
[13] S. Li, D. Wunsch, E. O’Hair, M. Giesselmann, ―Comparative Analysis of Regression and Artificial Neural Network Models for Wind Turbine Power Curve Estimation,‖Journal of Solar Energy Engineering, Vol.123, pp. 327-332, 2001.
[14] H. Liu, L. Yu, ―Toward Integrating Feature Selection Algorithm for Classification and Clustering,‖Dissertation , Arizona University
[15] C. Monteiro, J. Saraiva, V. Miranda,―Power Plans in Developing Countries-The Solargis Tool,‖ INESC, Porto,
Portugal,Retrieved at
http://www.inescn.pt/~lproenca/index.html
[16] S. Raff, ―A Perspective on Energy Modeling,‖Computers and Operations Research Journal, Pergamon Press, New York, 1975.
[17] W. Stuetzle, ―Estimating the Cluster Tree of a Density by Analyzing the Minimal Spanning Tree of a Sample,‖Dissertation, University of Washington, 2003.
[18] H. Taha, ―Operations Research: An Introduction‖, Ch 6, 218, Prentice-Hall, Inc., New Jersey,1998.