The measurement of intrinsic cellular
radiosensitivity in human tumours
and normal tissues
Patricia Ann Lawton
A Thesis submitted for the degree of Doctor of
Philosophy in the University of London
1995
ProQuest Number: 10042833
All rights reserved
INFORMATION TO ALL USERS
The quality of this reproduction is dependent upon the quality of the copy submitted.
In the unlikely event that the author did not send a complete manuscript and there are missing pages, these will be noted. Also, if material had to be removed,
a note will indicate the deletion.
uest.
ProQuest 10042833
Published by ProQuest LLC(2016). Copyright of the Dissertation is held by the Author.
All rights reserved.
This work is protected against unauthorized copying under Title 17, United States Code. Microform Edition © ProQuest LLC.
ProQuest LLC
789 East Eisenhower Parkway P.O. Box 1346
Acknowledgements
I would like to thank Dr Mike Joiner, Dr Richard Hodgkiss and Dr Gill Duchesne for all their supervision during this project and for their help in the preparation of this thesis. I must thank them for their encouragement, enthusiasm and patience. I would also like to thank several of the people who made this research possible in the first place - Professor Julie Denekamp for her support and continued help and advice throughout the project and Dr Michelle Saunders, Professor Stanley Dische and Dr Jane Maher for their help and encouragement on the clinical side. I must also thank the Cancer Research Campaign for the CRC Clinical Fellowship for this project.
I am very grateful to all the staff at the Gray Laboratory who have provided help and advice in this project. Specific thanks go to Dr Boris Vojnovic and Rosalind Locke for their help in setting up the Magiscan Image analysis system, the workshop staff for designing and making X-ray jigs and Magiscan plate holders and to Helen Johns for her help with computing. I appreciated Emma Kelleher's and Padraic Conway's help in the final skin fibroblast radiosensitivity experiments and in the day-to-day running of the tissue culture laboratory.
The clinical samples for this project were obtained with the help of the thoracic surgeons and theatre staff at both Harefield and Mount Vernon Hospitals and the histopathologists. Dr Margaret Burke and Dr Paul Richman and their staff. Dr Anne Hong collaborated in these studies and sent clinical samples from Exeter. The staff in the immunohistochemistry laboratory at Mount Vernon lead me through the techniques of immunohistochemical staining. I am very grateful to Dr Brian Eyden at the Christie Hospital, Manchester, for carrying out the electron microscopy and to Dr Martyn Sherriff from Guy's Hospital and Dr Christopher Foy at Mount Vernon Hospital for their help with the statistical analysis of this data.
Abstract
Human tumour and normal cell radiosensitivity are thought to be important factors determining the response of tumour and normal tissues to radiotherapy, respectively. Clonogenic assays are the standard method for measuring radiosensitivity but they are of limited applicability for clinical use with fresh human tumours. The main aim of this work was to evaluate the Adhesive Tumour Cell Culture System (ATCCS), as a method for measuring the radio sensitivity of human tumours. A soft agar clonogenic assay, the modified Courtenay-Mills assay, was used as a standard to compare with the ATCCS. The demonstration that fibroblast contamination could occur with both assay methods led to the investigation of a new technique for removing unwanted fibroblasts from tumour cell suspensions and to the use of a multiwell assay for measuring fibroblast radiosensitivity.
Established tumour cell lines were used to validate and optimise the ATCCS. Success rates with human tumour biopsy specimens were initially poor with both assay methods but further modifications led to success rates of -70% . In a comparison of the modified Courtenay-Mills assay and the ATCCS there was close agreement between the measurements of surviving fraction at 2 Gy (SF2) for
established tumour cell lines but with primary tumour cultures the SF2 values were
Table of contents
Title page
1
D ed ica tio n
2
A ck n ow led gem en ts
3
A bstract
4
Table of contents
5
Index of Figures
18
Index of Tables
27
Chapter 1
In trod u ction
1 . 1 . Radiotherapy for the treatment of cancer:
clinical summary 3 3
1 . 2 . The response of human tumours to radiotherapy 3 4
1 . 3 . The intrinsic cellular radiosensitivity of human
tumours
1 . 3 . 1 . D efinition o f intrinsic radio sensitivity 3 5
1 . 3 . 2 . H istorical overview o f cellular radiosensitivity 3 5
1 . 3 . 3 . Cellular mechanisms determining intrinsic
ra d io se n sitiv ity 3 8
1 . 3 . 4 . Cell survival parameters to describe intrinsic
radio sensitivity 3 9
1 . 3 . 5 . Relative importance o f different radiobiological
param eters 4 2
1 . 4 . The measurement of human tumour radiosensitivity
1 . 4 . 1 . Clonogenic assays 4 3
1 . 4 . 2 . Short-term growth assays 44
1 . 4 . 3 . M easurement o f DNA damage 4 6
1 . 5 . The response of normal tissues to radiotherapy
1 . 5 . 1 . General comments 4 7
1 . 5 . 2 . The range o f responses o f normal tissues to
radioth erapy 4 9
1 . 6 . The measurement of normal tissue radiosensitivity
in vitro
1 . 6 . 1 . Cell types f o r study 51
1 . 6 . 2 . M ethods fo r measuring fib ro b la st radio sensitivity 5 2
1 . 7 . The relationship between tumour and normal tissue
1 . 8 . Potential clinical benefit from studies of cellular
radiosensitivity 53
Chapter 2
M aterials and methods
2 . 1 . Method for obtaining human tumour biopsy samples 55
2 . 2 . Enzymatic digestion of human tumour samples 55
2 . 3 . A modified Courtenay-Mills soft agar clonogenic
a ssay
2 . 3 . 1 . Setting up cultures 57
2 . 3 . 2 . Colony counting 5 8
2 . 4 . The Adhesive Tumour cell Culture System (ATCCS)
2 . 4 . 1 . O riginal protocol 58
2 . 4 . 2 . M odified ATCCS protocol 62
2 . 4 . 3 . Fixation and staining o f m ultiwell plates 62
2 . 4 . 4 . M easurement o f integrated optical density (lO D) o f m ultiw ell plates
2 . 4 . 4 . 1 . Description o f the Joyce-Loebl M agiscan
image analysis system 63
2 . 4 . 4 . 2 . Modifications to the hardware o f the image
analysis system 65
2 . 4 . 4 . 3 . Modifications to the software o f the image
analysis system 67
2 . 4 . 4 . 4 . M easurement o f lO D 6 8
2 . 4 . 5 . Data analysis o f the multiwell assays 6 8
2 . 5 . Freezing of human tumour biopsy samples 71
2 . 6 . Culture and passaging of human tumour
cell lines and human fibroblasts 71
2 . 8 . Characterisation of cell cultures
2 . 8 . 1 . Preparation o f samples 72
2 . 8 . 2 . Im m unohistochem ical staining
2 . 8 . 2 . 1 . Indirect fluorescence m ethod 73
2 . 8 . 2 . 2 . Primary antibodies used f o r cell identification 74
2 . 9 . Giemsa staining 74
2 . 1 0 . Fibroblast cultures from skin biopsies
2 . 1 0 . 1 . Skin biopsy samples 74
2 . 1 0 . 2 . Skin biopsy m ethod 75 2 . 1 0 . 3 . Establishm ent o f fibroblast cultures (m ethod 1) 75
2 . 1 0 . 4 . Isolation o f fibroblasts and kératinocytes
from a skin sample (method 2) 75
2 . 1 1 . Assays for measuring fibroblast radiosensitivity
2 . 1 1 . 1 . Colony assay 76
2 . 1 1 . 2 . M ultiw ell assay 11
2 . 1 2 . Preparation of samples for TEM 78
2 . 1 3 . Statistical methods 79
2 . 1 4 . Media and reagents
2 . 1 4 . 1 . H am ’s F12 80
2 . 1 4 . 2 . Transport medium fo r skin biopsies 80
2 . 1 4 . 3 . M inimal essential medium (MEM)
+ 10% PCS p er 1000 ml 80
2 . 1 4 . 4 . High antibiotic medium 81
2 . 1 4 . 5 . Culture medium fo r ATCCS 81
2 . 1 4 . 6 . Attachm ent medium fo r ATCCS 81
2 . 1 4 . 7 . Collagenase fo r ATCCS 82
2 . 1 4 . 8 . Crystal violet solution 82
2 . 1 4 . 9 . Stock agar (5%) preparation 82
2 . 1 4 . 1 0 . lo d o n itro tétrazolium solution 82
2 . 1 4 . 1 1 . Acridine orange and ethidium bromide vital stain 82
Chapter 3
M easurem ent of human tum our cellular radiosensitivity
using a m odified C ourtenay-M ills soft agar clonogenic
assay
3 . 1 . Introduction 84
3 . 2 . A im s 85
3 . 3 . Materials and methods
3 . 3 . 1 . Cell lines
3 . 3 . 1 . 1 . HeLa S3 cell line 86
3 . 3 . 1 . 2 . HX147 lung carcinoma cell line 86
3 . 3 . 1 . 3 . HT29 colon carcinoma cell line 86
3 . 3 . 1 . 4 . SW48 colon carcinoma cell line 86
3 . 3 . 1 . 5 . EJ30 bladder carcinoma cell line 86
3 . 3 . 1 . 6 . A549 lung carcinoma cell line 86
3 . 3 . 1 . 7 . Breast carcinoma cell line 87
3 . 3 . 1 . 8 . Early passage skin fibroblasts 87
3 . 3 . 2 . Fixation o f samples f o r Transmission
E lectron M icroscopy 87
3 . 3 . 3 . Preparation o f samples f o r
im m unohistochem ical staining 87
3 . 3 . 4 . Preparation o f peripheral blood monocytes 8 8
3 . 3 . 5 . M easurement o f SF2 8 8
3 . 4 . R esu lts
3 . 4 . 1 . S F2 measurements in established human
tumour cell lines 8 9
3 . 4 . 2 . Primary human tumour cultures 93
3 . 4 . 2 . 1 . Number o f assays perform ed 93
3 . 4 . 2 . 2 . Success rates 94
3 . 4 . 2 . 3 . Factors influencing growth in primary
tum our assays 99
3 . 4 . 2 . 4 . M easurements o f SF2 in prim ary tumour cultures 103
3 . 4 . 4 . Formation o f fibroblast colonies in soft agar 106
3 . 4 . 5 . Formation o f colonies in agar from normal
lung biopsies 108
3 . 4 . 6 . Characterisation o f colonies in prim ary
tum our cultures 109
3 . 4 . 6 . 1 . M orphological appearance o f cells cultured
in agar 109
3 . 4 . 6 . 2 . Im m unohistochem ical staining 109
3 . 4 . 6 . 3 . Transmission electron m icroscopy 118
Chapter 4
M easurem ent of human tum our radiosensitivity
using the Adhesive Tumour Cell Culture System
4 . 1 . Introduction 12 8
4 . 2 . A im s 128
4 . 3 . Materials and methods
4 . 3 . 1 . Calibration o f Magiscan measurements
o f lO D with spectrophotometer readings 129
4 . 3 . 2 . Calibration o f cell number with Magiscan
measurements o f lO D 129
4 . 3 . 3 . Effect o f timing o f fixation on
measurem ents o f radiosensitivity 130
4 . 3 . 4 . Optimisation o f culture conditions with
the ATCCS 130
4 . 3 . 5 . Characterisation o f tumour cell cultures 130
4 . 3 . 6 . Culture o f tumour samples in uncoated
4 . 4 . R esu lts
4 . 4 . 1 . Optimisation o f the Joyce-Loebl Magiscan
image analysis system 131
4 . 4 . 2 . Calibration o f Magiscan readings
o f lO D versus spectrophotom eter readings 132
4 . 4 . 3 . Calibration o f cell number versus M agiscan lO D 137
4 . 4 . 4 . Effect o f timing o f fixation on
m easurem ents o f radio sensitivity 141
4 . 4 . 5 . M easurem ents o f radio sensitivity in
established tumour cell lines 143
4 . 4 . 6 . Primary human tumour cultures
4 . 4 . 6 . 1 . Num ber o f assays perform ed and assay
m o d ifica tio n s 145
4 . 4 . 6 . 2 . Success rates 150
4 . 4 . 6 . 3 . Factors influencing growth in prim ary
tum our assays 150
4 . 4 . 6 . 4 . M easurement o f SF2 in prim ary tumour cultures 151
4 . 4 . 6 . 5 . 1st Passage cell lines 153
4 . 4 . 7 . Characterisation o f prim ary tumour cultures
in the ATCCS assay 155
4 . 4 . 8 . Characterisation o f 1st passage cultures
from tumour samples 164
4 . 4 . 9 . Comparison o f the culture o f prim ary tumour samples on CAM coated and uncoated tissue
culture plastic plates 164
4 . 4 . 1 0 . D oes the *CAM' coating selectively inhibit the proliferation o f normal skin fibroblasts compared with growth on uncoated tissue
culture plastic? 165
4 . 4 . 1 1 . Culture o f normal lung on CAM coated plates 165
Chapter 5
C om parison of the modified C ourtenay-M ills assay with the
A dhesive Tumour Cell Culture System and investigation of
a new m ethod for reducing fib rob last con tam in ation of
tum our cultures
5 . 1 . Introduction and Aims 173
5 . 2 . Materials and methods
5 . 2 . 1 . M odified Courtenay-Mills assay and ATCCS 174
5 . 2 . 2 . Coating o f magnetic dynabeads with an IgM
antibody to a surface protein on fibroblasts 174
5 . 2 . 3 . Indirect method fo r fibroblast cell separation
using dynabeads 175
5 . 2 . 4 . Experiments to investigate fibroblast extraction from cell suspensions using magnetic
antibody-coated beads 175
5 . 3 . R esu lts
5 . 3 . 1 . Radio sensitivity measurements in established
cell lines 176
5 . 3 . 2 . Primary human tumour cultures
5 . 3 . 2 . 1 . Comparison o f success rates 186
5 . 3 . 2 . 2 . Comparison o f measurements o f SF2
with primary tumour cultures 187
5 . 3 . 2 . 3 . Comparison o f duration to obtain a measurement o f SF2 with the modified
Courtenay-Mills assay and the ATCCS 189
5 . 3 . 2 . 4 . Comparison o f growth o f prim ary tumour cultures in the modified Courtenay-M ills assay y
the ATCCS and on uncoated tissue culture plastic 189
5 . 3 . 3 . 1st passage human tumour cultures 189
5 . 3 . 4 . Comparison o f tumour selectivity and
5 . 4 . Attempts to develop a method for extracting
fibroblasts from tumour cell suspensions
using magnetic coated beads
5 . 4 . 1 . Prelim inary experim ents 190
5 . 4 . 2 . Further work with established cell lines 191
5 . 4 . 3 . Experiments with two 1st passage tumour cell
cu ltu res 194
Chapter 6
The m easurem ent of skin fibroblast radiosensitivity
in patients
6 . 1 . Introduction 1 9 9
6 . 2 . A im s 2 0 0
6 . 3 . Materials and methods 2 0 0
6 . 4 . R esu lts 2 0 1
6 . 4 . 1 . Primary disaggregation techniques fo r
propagating cultures o f fibroblasts 2 0 1
6 . 4 . 2 . A comparison o f a multiwell assay with a colony assay fo r the measurement
o f fibroblast radiosensitivity 2 0 1
6 . 4 . 3 . R adiosensitivity assays on prim ary cultures
o f fibroblasts 2 0 4
6 . 4 . 4 . M easurements o f radio sensitivity on early
passage fibroblast cell lines 2 0 4
6 . 4 . 4 . A comparison o f radiosensitivity measurements in skin fibroblasts with other cell types
6 . 4 . 4 . 1 . Fibroblasts and kératinocytes 2 1 0
6 . 4 . 4 . 2 . Fibroblasts and tumour cultures 2 1 0
Chapter 7
C oncluding discussion
221
Appendix
236
Index of Figures
Chapter 1
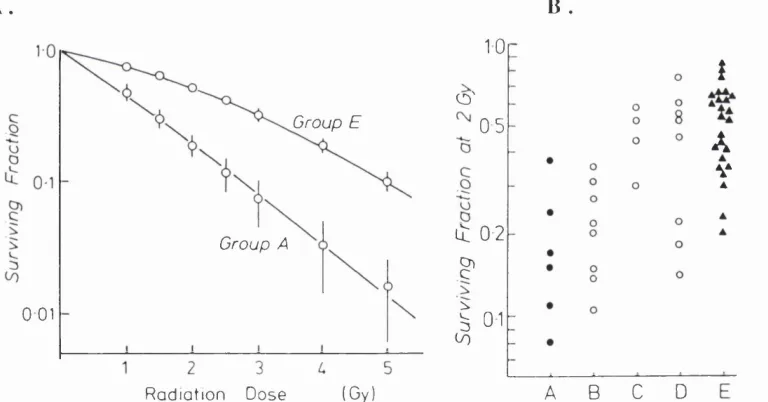
Figure 1.1. A. The initial slope of the cell survival curve, indicated by the surviving fraction at 2 Gy, in relation to the clinical response categories listed in Table 1.1 B. The mean survival curve for the tumour cell lines in Groups A and E. The points indicate the mean surviving fractions at each dose level (+/- SEM). The lines are fitted
linear quadratic equations. 3 7
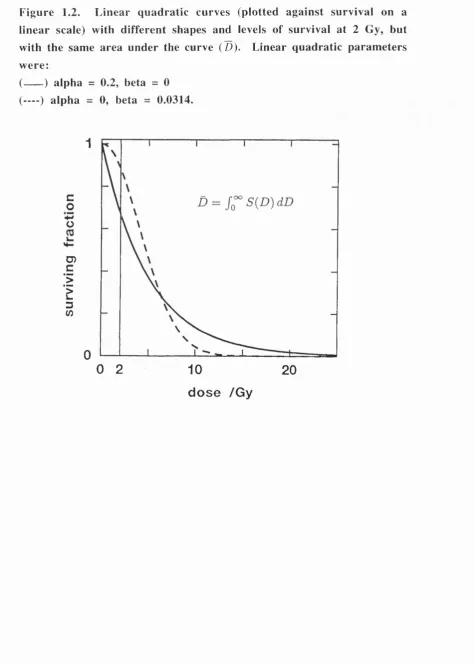
Figure 1.2. Linear quadratic curves (plotted against survival on a linear scale) with different shapes and levels of survival at 2 Gy, but with the same area under the curve (D). Linear quadratic parameters were:
(---- ) alpha = 0.2, beta = 0. (— ) alpha = 0, beta = 0.0314. 41
Figure 1.3. Theoretical dose-response curves for tumour and
normal tissue. 4 8
Figure 1.4. The surviving fraction at 2 Gy for established cell lines (Fertil & Malaise 1981, and Deacon et al. 1984. [1, 2]); fresh carcinoma of cervix (West et al. 1989. [3]);
fresh squamous cell carcinoma of head and neck (Brock et al. 1990. [4]) and fibroblasts - normal,
Fanconi's anaemia (FA), Gardner’s syndrome (GS), and Ataxia
Chapter 2
Figure 2.1. Multiwell plates in the ATCCS. 60
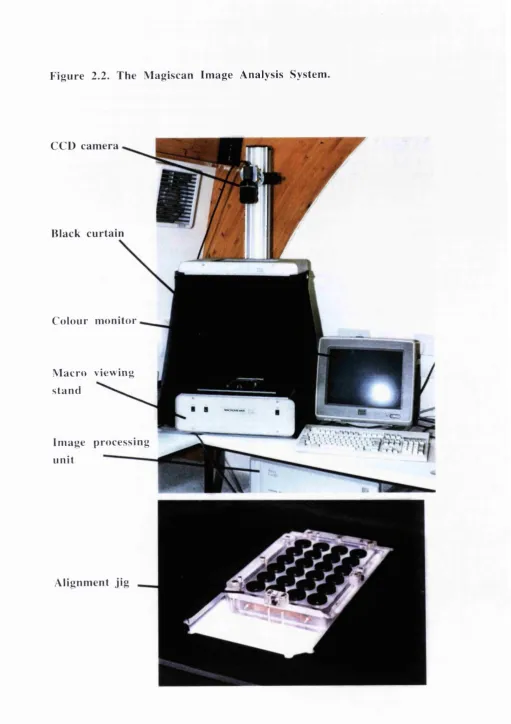
Figure 2.2. The Magiscan Image Analysis System. 6 6
Figure 2.3. Example of method of data analysis in the ATCCS
for HeLa experiment No. A74. a). Linear regression fits through data of Magiscan lOD plotted versus X-ray dose. b). Cell survival curve derived from data in a), where surviving fraction is the ‘slope ratio’
of corrected lOD versus X-ray dose. 7 0
Chapter 3
Figure 3.1. Relationship between number of HeLa cells plated and
number of colonies formed in the modified Courtenay-Mills assay. 9 0
Figure 3.2. A: Relationship between SF2 measured 'directly’ and
SF2 calculated by fitting survival curve data with the linear quadratic
equation (LQ fit) for 7 experiments with established tumour cell lines. B: The mean SF2 calculated using these two methods plotted against
the difference in SF2 values. 9 2
Figure 3.3. A: Frequency distribution of No. of colonies per test tube
in high density controls for successful Courtenay-Mills assays with primary tumour cultures. B: values normalised to a plating cell
density of 5x10^. 95
Figure 3.4. A. Biopsy weight in grams. B. Viable cells/g. C: No. of
cells plated in the modified Courtenay-Mills assay for cervix and lung
tumours (horizontal line shows mean value for both tumour types). 100
Figure 3.5. Frequency distribution of SF2 measurements made
with the modified Courtenay-Mills assay. 104
Figure 3.6. SF2 measurements in the modified Courtenay-Mills
Figure 3.7. Colonies of normal human fibroblasts in agar in a
modified Courtenay-Mills assay. Bar=5 mm. 107
Figure 3.8. Morphological appearance of cells in culture in plastic flasks. Bar=100 )im in each photograph.
3.8 A. Cells derived from colonies removed from soft agar for a
culture of normal lung. 3.8 B. Cells derived from colonies removed from the Courtenay-Mills assay for a culture of a non-small cell lung tumour.
3.8 C. Cells from normal lung cultured directly in a flask.
3.8 D. Cells from a non-small cell lung tumour cultured directly in a flask. 3.8 E. Early passage skin fibroblasts.
3.8 F. Macrophages in culture derived from peripheral blood monocytes. I l l
Figure 3.9 Examples of immunohistochemical staining. Bar=100 |J.m in each photograph.
3.9 A. Control lung carcinoma cell line (A549) staining positive for cytokeratin antibodies (CK, MNFl 16).
3.9 B. Control lung carcinoma cell line (A549) staining negative for fibroblast antibody (Dako 5B5).
3.9 C. Control fibroblasts staining negative for cytokeratin antibodies (CK, MNFl 16).
3.9 D. Control fibroblasts staining positive for fibroblast antibody (Dako 5B5).
3.9 E. Colony in agar from non-small cell lung carcinoma (CY 89) staining positive for cytokeratin antibodies (CK, MNFl 16).
3.9 F. Colony in agar from non-small cell lung carcinoma staining positive for fibroblast antibody (Dako 5B5).
3.9 G. Colony from a primary culture of normal lung,
F igure 3.10. Transmission electron micrographs. Bar=l |im in each photograph.
3.10 A. Skin-derived fibroblast cultured on plastic coverslip.
Note conspicuous rough endoplasmic reticulum (arrowhead) and modest band of fine filaments (large curved arrow) with a focal density (small curved arrow). 3.10 B. Breast carcinoma cell line cultured on tissue culture plastic flask. Note well-developed dense tonofibrils (t) and desmosome (d).
3.10 C. Normal lung tissue cell from a colony in soft agar, containing abundant rough endoplasmic reticulum (arrowhead) and exhibiting an extracellular fibril (f) suggesting fibronexus junction formation. 3.10 D. Lung carcinoma tissue cell from a colony in soft agar (same patient as C), also showing abundant rough endoplasmic reticulum (arrowhead) and extracellular fibrillar material (f) suggesting
fibronexu s j unction formation. 121
Figure 3.11. 1 |im section stained in toluidine blue from a TEM block of a colony from agar-cultured lung carcinoma. Arrowheads indicate cells whose orientation within the section reveals spindled
morphology. Bar = 20 |L im . (magnification x 340). 123
Chapter 4
Figure 4.1. Variation in Magiscan lOD measurements under
differing optical conditions. 134
Figure 4.2. Relationship between Magiscan lOD and
spectrophotometer optical density measurements for solutions of
crystal violet. 136
Figure 4.3. Relationship between Magiscan lOD readings and numbers of HeLa cells in two experiments (A and B) with the ATCCS showing both the initial number of cells plated and the number of cells
counted after 6 days in culture. 138
Figure 4.4. Relationship between Magiscan lOD readings and number of HeLa cells plated in the ATCCS assay. Plates were fixed
Figure 4.5. Relationship between Magiscan lOD readings and number of HeLa cells plated in the ATCCS assay, with number of cells corrected for cells lost in the supernatant. Plates were fixed and stained
6 hours after plating. 140
Figure 4.6. Cell survival curve for HeLa cells from nine repeat experiments with the ATCCS. A. Individual data points shown.
B. Data as in A, above, with only mean values shown. 144
Figure 4.7. Histogram showing SF2 measurements for 29
primary tumour cultures with the ATCCS assay. 153
Figure 4.8. Examples of the morphological appearance of cells cultured on CAM coated plates. Cells have been fixed and stained with crystal violet. Bar=100 |im in each photograph.
4.8 A. Breast carcinoma showing epithelial-like appearance of cells (A 100).
4.8 B. NSCL tumour showing fibroblastic cells (A143). 4.8 C. NSCL tumour (A 102) showing (i) Area within culture of epithelial-like cells, (ii). Area within culture of fibroblastic cells 4.8 D. NSCL tumour (A131) showing (i). Area within culture of epithelial-like cells, (ii) Area within culture of fibroblastic cells. 4.8 E. Culture from normal lung showing fibroblastic cells. 4.8 F. Normal skin fibroblasts.
4.8 G. HeLa cells.
3.8 H. H X 147 lung carcinoma cell line. 157
Figure 4.9. Transmission electron micrographs of cells cultured on CAM coated coverslips.
Figure 4.9 X. A, B. Fibroblast from a coverslip culture of normal lung tissue (A 154). A: rER, rough endoplasmic reticulum cistemae; small arrow, simple fibronexus junction, detailed in B. Bar = 1 |im. B: smf, smooth-muscle type filaments; fn, fibronectin filaments. Bar = 200 nm.
Figure 4.9 X.C. Fibroblast from a coverslip culture of lung carcinoma (A 153), from same patient as sample of normal lung in
Figure 4.9 Y. A, B. HeLa cells grown on a coverslip A: low magnification view illustrating non-flattened cell morphology. Arrowheads, small tonofibrils. Bar = 1 |im. B. Detailed view of
a small dense tonofibril (arrowhead). Bar = 200 nm. 163
Figure 4.10. Comparison of cell survival curves for primary
cultures from lung tumours and normal lung with the ATCCS. A. NSCL tumour (A 153) and normal lung (A 154).
Chapter 5
Figure 5.1. Relationship between SF2 measurements made with the
modified Courtenay-Mills assay and the ATCCS for primary human tumour cultures, 1st passage human tumour cultures and repeat assays on HeLa cells. Line of equity is drawn to show where points
would lie if measurements with the two assay methods were exactly
the same. 17 8
Figure 5.2. Relationship between SF2 measurements made with modified
Courtenay-Mills assay and the ATCCS shown as mean SF2 with the
two assay methods plotted versus difference in SF2 measurement with
the two assay methods. A: repeat experiments on HeLa cells.
B: primary tumour cultures. C. first passage tumour cell lines. 179
Figure 5.3. Comparison of cell survival curves for HeLa cells with
the modified Courtenay-Mills assay and the ATCCS. 184
Figure 5.4. Comparison of cell survival curves for HX147 lung
carcinoma cells with the modified Courtenay-Mills assay and the ATCCS. 184
Figure 5.5. Comparison of cell survival curves for the SW48 colon
carcinoma cell line with the modified Courtenay-Mills assay, ATCCS
and a colony assay on plastic. 185
Figure 5.6. Comparison of cell survival curves for the HT29 colon
carcinoma cell line with the modified Courtenay-Mills assay, ATCCS
and a colony assay on plastic. 185
Figure 5.7. Normal skin fibroblasts in culture showing
Chapter 6
Figure 6.1. Comparison of a multiwell assay with a colony
assay for the measurement of fibroblast radiosensitivity. A. MRC5 cell
line. B. ATS4 ceU line. 2 0 2
Figure 6.2. Radiosensitivity measurements on primary fibroblast
cultures using a multiwell assay. 20 5
Figure 6.3. Frequency distribution of mean SF2 measurements in
early passage fibroblast cultures. 20 6
Figure 6.4. Mean values of SF2 in patients and two cell lines,
ATS4 and MRC5. 20 6
Figure 6.5. Comparison of radiosensitivity measurements with
fibroblasts and kératinocytes in two patients. A. Patient No. 5.
B. Patient No. 4. 21 2
Figure 6.6. Comparison of radiosensitivity measurements with
fibroblasts and kératinocytes in patient No. 7. 213
Figure 6.7. Comparison of radiosensitivity measurements with
fibroblasts, kératinocytes and tumour cultures in a patient with a breast
carcinoma (Patient No. 8). 213
Figure 6.8. Comparison of radiosensitivity measurements
with fibroblasts, kératinocytes and tumour cultures in a clinically radiosensitive patient (No. 6). Symbols represent mean values
of six experiments for fibroblasts, mean values of five experiments for kératinocytes and single values for a modified Courtenay-Mills assay
with 1 St passage tumour cells. Error bars represent SEM. 21 4
Figure 6.9. Comparison of radiosensitivity measurements with
fibroblasts from normal cervix and a primary tumour culture in a
A p p en d ix
Figure 8.1. ATCCS assay No. A4. Meningioma. 24 2
Figure 8.2. ATCCS assay No. A5. Cervix carcinoma. 24 3
Figure 8.3. ATCCS assay No. A 17. Cervix carcinoma. 24 4
Figure 8.4. ATCCS assay No. A 19. Cervix carcinoma. 2 4 5
Figure 8.5. ATCCS assay No. A30. SCC node. 24 6
Figure 8.6. ATCCS assay No. A98. Lung carcinoma. 24 7
Figure 8.7. ATCCS assay No. A 100. Breast carcinoma. 2 4 8
Figure 8.8. ATCCS assay No. A 102. Lung carcinoma. 2 4 9
Figure 8.9. ATCCS assay No. A l l l . Lung carcinoma. 2 5 0
Figure 8.10. ATCCS assay No. A 113. Lung carcinoma. 25 1
Figure 8.11. ATCCS assay No. A 114. Cervix carcinoma. 25 2
Figure 8.12. ATCCS assay No. A 126. Lung carcinoma. 253
Figure 8.13. ATCCS assay No. A 130. Melanoma. 254
Figure 8.14. ATCCS assay No. A131. Lung carcinoma. 2 55
Figure 8.15. ATCCS assay No. A133. Lung carcinoma. 2 56
Figure 8.16. ATCCS assay No. A 136. Lung carcinoma. 257
Figure 8.17. ATCCS assay No. A 140. Lung carcinoma. 2 58
Figure 8.19. ATCCS assay No. A 142. Lung carcinoma. 2 6 0
Figure 8.20. ATCCS assay No. A 143. Lung carcinoma. 2 6 1
Figure 8.21. ATCCS assay No. A 144. Lung carcinoma. 2 6 2
Figure 8.22. ATCCS assay No. A 145. Lung carcinoma. 2 6 3
Figure 8.23. ATCCS assay No. A 146. Lung carcinoma. 2 6 4
Figure 8.24. ATCCS assay No. A 149. Lung carcinoma. 2 6 5
Figure 8.25. ATCCS assay No. A 150. Lung carcinoma. 2 66
Figure 8.26. ATCCS assay No. A151. Lung carcinoma. 2 6 7
Figure 8.27. ATCCS assay No. A153. Lung carcinoma. 2 6 8
Figure 8.28. ATCCS assay No. A 160. Lung carcinoma. 2 6 9
Index of Tables
Chapter 1
Table 1.1. Classification of human tumours according to clinical
radioresponsiveness. 3 7
Chapter 2
Table 2.1. Numbers of cells required for inoculating the ATCCS
radiosensitivity assay. 5 9
Table 2.2. Number of cells plated per dose point for fibroblast colony
Chapter 3
Table 3.1. Summary of HeLa SF2 measurements with the modified
Courtenay-Mills soft agar assay. 8 9
Table 3.2. Modified Courtenay-Mills assay for established human
tumour cell lines. 9 3
Table 3.3. Success rates with modified Courtenay-Mills assay for
primary tumour cultures by tumour type. 9 6
Table 3.4. Modified Courtenay-Mills assay with human tumour
biopsy specimens. 9 7
Table 3.5. Summary of primary tumour culture SF2 measurements
with the modified Courtenay-Mills assay. 103
Table 3.6. Modified Courtenay-Mills assay with 1st passage human
tumour cell lines. 105
Table 3.7. Formation of fibroblast colonies in agar. 108
Table 3.8. Characterisation of primary tumour cultures in the
modified Courtenay-Mills assay. 119
Table 3.9. Probabilities of finding no tumour cells on sampling 18
colonies from cultures containing varying proportions of tumour cells. 120
Chapter 4
Table 4.1. Magiscan readings under varying optical conditions. 133
Table 4.2. Nine replicate ATCCS assays with HeLa cells showing
effect of number of days in culture on measurements of SF2. 141
Table 4.3. ATCCS assay for established human tumour cell
Table 4.4. Summary of HeLa SF2 measurements with the ATCCS. 143
Table 4.5. ATCCS assay with human tumour biopsy specimens. 146
Table 4.6. Success rates for primary tumour cultures with the
ATCCS assay by tumour type. 152
Table 4.7. Summary of primary tumour culture SF2 measurements. 153
Table 4.8. ATCCS assay for 1st passage human tumour cell lines. 154
Table 4.9. Characterisation of primary cultures in the ATCCS assay. 156
Table 4.10. Characterisation of 1st passage cells from tumour samples. 166
Table 4.11. Comparison between SF2 measurements on CAM-coated
and uncoated multiwell plates for early passage fibroblast cell lines. 167
Table 4.12. Comparison of TOD Magiscan measurements for
primary tumour cultures using CAM-coated and uncoated multiwell plates. 168
Chapter 5
Table 5.1. Comparison of SF2 measurements with the modified
Courtenay-Mils assay and the ATCCS for 8 experiments with HeLa cells. 182
Table 5.2. Comparison of SF2 measurements with the modified
Courtenay-Mills assay and the ATCCS for HX147, SW48 and
HT29 tumour cell lines. 183
Table 5.3. Comparison of success rates with the modified
Courtenay-Mills assay and the ATCCS for 52 human tumour biopsy
specimens where both assay methods were set up simultaneously. 186
Table 5.4. Comparison of SF2 measurements with the modified
Table 5.5. Extraction of MRC 5 fibroblasts from an MRC 5
cell suspension expressed as the percentage of cells attached to beads. Cells were counted with a haemocytometer immediately after
separation in a magnetic cell separator. 191
Table 5.6. Extraction of MRC 5 fibroblasts or HeLa cells from
cell suspensions. Plating efficiencies of cells and % of total cells grown
in bead and supernatant fractions after 7 days in culture. 193
Chapter 6
Table 6.1. Radiosensitivity measurements on transformed fibroblast
cell lines. 20 3
Table 6.2. Radiosensitivity measurements in early passage human
fibroblast cell lines derived from skin biopsies. 20 7
Table 6.3. Comparison of radiosensitivity measurements in
kératinocytes, fibroblasts and tumour cultures in individual patients 21 1
A pp en d ix
Table 8.1. Modified Courtenay-Mills assay for established
human tumour cell lines. 23 7
Table 8.2. Modified Courtenay-Mills assay with human tumour
biopsy specimens. 2 3 9
Table 8.3. Modified Courtenay-Mills assay with 1st passage human
List of commonly used abbreviations
a alpha
AT CC S Adhesive Tumour Cell Culture System P beta
C a . carcinoma
CAM Cell adhesive matrix CCD charge-coupled device C F E colony forming efficiency C l confidence intervals C o ls . colonies
C o n e . concentration
C Y -M ills modified Courtenay-Mills assay CV coefficient of variation
D mean inactivation dose
DM SO dimethylsulphoxide
D o X-ray dose required to reduce the fraction of surviving cells
to 37% of its previous value on bbe s l o p e , o f {in«. cell surviv<x\ cu.fv«,
d s b DNA double strand breaks
EDTA ethylenediaminetetra-acetic acid (disodium salt) E x p . experiment
F IS H fluorescence in situ hybridisation F C S fetal calf serum
h hours
H VL half value layer
I light intensity transmitted through sample lo light intensity incident on the sample I g immunoglobulin
I NT iodonitrotetrazolium 1 0 D integrated optical density LET linear energy transfer LQ linear quadratic equation LM DS local multiply damaged sites L S B least significant bit
MEM Minimum Essential Medium m in minutes
Abbreviations continued
N o . number
N SC L Non-small cell lung carcinoma
OD optical density
P o primary culture
P I 1st passage
P B S phosphate buffered saline
r .p .m . revolutions per minute
SCC squamous cell carcinoma
SD standard deviation
SEM standard error of the mean
SF2 surviving fraction at 2 Gy
Chapter 1
In trod u ction
1.1. Radiotherapy for the treatment of cancer: clinical summary
In the 100 years since the discovery of X-rays by Roentgen in 1895, radiotherapy has become one of the major treatment modalities for patients with cancer. Radiotherapy now follows surgery as the second most commonly used form of therapy for cancer, either as a single treatment modality or in combination with surgery and chemotherapy. The percentage of cancer patients treated with radiotherapy in the United Kingdom is approximately 50%, so that relatively small improvements in treatment could affect large numbers of patients [6]. One of the major goals of research in radiation biology has been to improve local tumour control and patient survival, whilst at the same time minimising the unwanted side effects of damage to normal tissues.
Improvements in radiotherapy treatment can potentially be achieved either by physical methods which improve the dose-distribution of radiation within a tumour or by techniques which exploit biological differences between tumours and normal tissues. Significant advances have been made during the last 20 years with the introduction of megavoltage X-ray machines and improved imaging, dosimetry and planning systems. Based on encouraging laboratory results, clinical trials have been carried out with hyperbaric oxygen, hypoxic cell sensitisers, high LET radiation and, more recently, with different fractionation schedules. To date, all of these modalities have shown, at least, small improvements in local tumour control for certain tumour types although some of these results have been disappointing [7, 8].
thesis is the measurement o f one of these parameters which appears to be important
in both tumours and normal tissues - intrinsic cellular radiosensitivity.
1.2. The response of human tumours to radiotherapy
There is a wide range in the response of human tumours to radiotherapy with rates of local tumour control ranging from <5% to >95% for different tumour types [9]. Some of the factors which contribute to these differences are known but there is currently no satisfactory method for predicting accurately the response to treatment for an individual patient. The parameters which are used routinely in clinical practice are the type and grade of the tumour, the tumour stage and an assessment of the general condition of the patient. Tumours of certain histological types are known to be more radioresponsive than others, (e.g. lymphomas are relatively radiosensitive compared with glioblastomas which are highly radioresistant), but within each tumour category there is a range of responses.
1.3. The intrinsic cellular radiosensitivity o f hum an tum ours
1.3.1. D efinition o f intrinsic radio sensitivity
Intrinsic radiosensitivity describes the balance between the processes of radiation lesion production, lesion repair and lesion tolerance. The majority of cells express lethal radiation damage at the time of cell division as the failure to divide successfully. This process can be measured in vitro in a clonogenic assay as the ability of cells to divide to form colonies after irradiation and for this reason, clonogenic assays are considered to be the standard method for assessing cellular radiosensitivity. There are, however, certain cell types where the main form of cell death is by radiation-induced apoptosis (e.g. lymphocytes, spermatogonia, and salivary-gland cells) and there is some evidence that apoptosis may be the form of cell death in subpopulations of some tumour cells [17, 18, 19]. The intrinsic radiosensitivity of cells measured with a clonogenic assay may be expressed as the surviving fraction after a given dose of radiation, as the dose required to reduce their survival to a particular level or in terms of other cell survival curve parameters (Section 1.3.4).
1.3.2. H istorical overview o f cellular radio sensitivity
In 1956 Puck and Marcus published the first clonogenic cell survival curve, thereby providing for the first time a technique for measuring the radiosensitivity of tumour cells [20]. The cell survival curve model of an initial shoulder followed by a final exponential portion was used. This was described with the following equation
-Surviving fraction = 1 - (1- e '^ /^ o )"
where D = dose
Do = dose required to reduce the surviving fraction of cells to 37% of its previous value on IVi® final slop®, of tZh®, cell sarvtVo.! cuxve.
n = termed 'extrapolation number'. This is the intercept on the survival axis of the terminal slope of the survival curve extrapolated back to zero dose.
intrinsic radiosensitivity was a relatively unimportant factor and that differences in radiation response must be accounted for mainly by differences in cell proliferation, cell cycle phase distribution and degree of hypoxia.
During the 1970s alternative models to the multitarget theory were developed which employ linear and curvilinear terms (e.g. the linear quadratic model) and provide a more useful description of the low-dose shoulder region of the survival curve [22]. The linear quadratic model is described by the following equation
-Surviving fraction = exp ( - oD - pD^) where D = dose
a,P = constants
Recent work has emphasised the importance of the initial region of the survival curve as a measure of intrinsic radiosensitivity. In 1981, Fertil and Malaise published data showing a relationship between the surviving fraction at 2 Gy (SF2)
in human tumour cell lines and the clinical radioresponsiveness of the tumour type (expressed as the probability of 95% local control) from which the cell lines were derived [1]. In 1984, Deacon et al. published a similar review (mostly different data) correlating SF2 with the ranking of tumours according to their known
radioresponsiveness (Figures 1.1a and 1.1b, Table 1.1)[2]. Although there was an overall correlation, it was also observed that there was a large variation within each category, which is consistent with clinical observations. The average SF2 for
Table 1.1 and Figure 1.1 reproduced from Deacon et al. (1984) [2].
T able 1.1. C lassification of hum an tum ours according to clinical ra d io re sp o n siv e n e ss.
A. Neuroblastoma, lymphoma, myeloma
B. Medulloblastoma, small-cell carcinoma
C. Breast, bladder, cervix carcinoma
D. Pancreas, colo-rectal, squamous lung carcinoma
E. Melanoma, osteosarcoma, glioblastoma, renal carcinoma
Figure 1.1 A. The initial slope of the cell survival curve, indicated by the surviving fraction at 2 Gy, in relation to the clinical response categories listed in Table 1.1 B. The mean survival curve for the tum our cell lines in G roups A and E. The points indicate the mean surviving fractions at each dose level {+!- SEM). The lines are fitted linear q u ad ratic equations.
A. B .
Group E
Group A
0 01
(Gy) R a d ia tio n Dose
10
O'
0 5
it 0 2
?
I
01A B C D
i
A
V
1.3,3, Cellular mechanisms determining intrinsic radiosensitivity
DNA is thought to be a major target for the critical radiation damage which results in mitotic cell death. The types of DNA lesions caused by X-irradiation include double strand breaks, single strand breaks, base damage and DNA-protein cross-links. Of these, DNA double strand breaks are thought to be the most important lesions for lethal radiation damage [23, 24]. Ward (1986) has suggested that cell death results from clusters of DNA lesions (termed local multiply damaged sites, LMDS) in essential parts of the DNA, which are difficult to repair [25]. The initial damage to DNA may be chemically repaired by endogenous reducing compounds (e.g. glutathione or ascorbate) and may also be modified by DNA repair enzymes, either by repairing the damage correctly or by producing mis-repaired lesions which may result in chromosome aberrations, mutations and cell transformation [26]. Both the level of initial damage and the amount of repair are thought to be important in determining the amount of lethal radiation damage and there is evidence that these may both vary independently in different cell types [27, 28].
1.3.4. Cell survival param eters to describe intrinsic radio sensitivity
The surviving fraction after a single fraction of 2 Gy (SF2) is the cell survival
param eter which has been used most widely for comparing the intrinsic radiosensitivity of different cell types. Tucker et al. (1989) have shown that this is a good discriminator between cell lines of differing radiosensitivity and it would also seem to be of clinical relevance to treatment given in 2 Gy fractions [33]. For most cell lines there is good agreement between the initial slope a of the survival curve and the SF2, so that a would be an alternative param eter for comparing
radio sensitivity measurements. Fertil and Malaise (1984) suggested that some measure of the shape of the whole cell survival curve might be more valuable and they described the mean inactivation dose (D ) as an alternative parameter [34]. This can be most simply expressed as the area under a linear quadratic cell survival curve plotted with linear co-ordinates. It can be shown, however, that there is no consistent relationship between D and the extent of cell killing in the low dose region and Tucker et al. (1986) have argued that SF2 should be used to compare
cellular radiosensitivity, rather than D (Figure 1.2) [35].
A simple extrapolation from the SF2 measurement would give the surviving fraction
of tumour cells after 60 Gy in 30 fractions as follows
-SF after 30 doses of 2 Gy = (-SF2)^®
Suit (1989) calculated the theoretical doses required to achieve local control in 50% of tumours (TCD50) containing lO^^ clonogens [11]. Using in vitro SF2
measurements in primary tumour cultures in soft agar the estimated TCD50 was 34.1 Gy, which is lower than the TCD50 observed in clinical practice of ~ 60 Gy. Higher values of SF2 were reported for established cell lines than for primary
cultures and based on these higher SF2 measurements in established cell lines the
estimated TCD50 was 72 Gy. Possible explanations for the discrepancy between these theoretical calculations and the observed clinical value of TCD50 are that the SF2 measurements in primary cultures may underestimate the true value of SF2 in
tumours in vivo and that simple extrapolations from SF2 fail to consider other
important factors within tumours (e.g. proliferation between treatments, tumour hypoxia and vascular or immune-mediated responses). Interestingly, some other workers have not found a difference between the SF2 measurements in established
cell lines and primary tumour cultures, so that this difference may not be a general phenomenon and may be dependent on culture technique (Figure 1.4) [3]. These discrepancies aside, SF2 is unlikely to represent the true figure for the proportion of
Figure 1.2. L inear qu ad ratic curves (plotted against survival on a linear scale) with different shapes and levels of survival at 2 Gy, but with the same area under the curve (D). Linear quadratic param eters w ere:
(---) alpha = 0.2, beta = 0 (— ) alpha = 0, beta = 0.0314.
c
o
'iM Ü
O) c >
‘E
3
(/)
1
0
0
2
10
20
1.3.5. R elative importance o f different radiobiological param eters
It has already been discussed that intrinsic cellular radiosensitivity is one of several radiobiological parameters thought to be important in the response of human tumours to radiotherapy. Some of these factors, for example, cell cycle phase and hypoxia may be interdependent and modify cellular radiosensitivity but there is little clinical data on the relative importance of these parameters in human tumours.
The effects of cell cycle phase on cellular radiosensitivity can be studied by performing clonogenic assays on synchronously dividing cell cultures. Using these techniques it has been shown that cells in G2 and M are more sensitive than cells in late S and other phases of the cell cycle such as G1 and early S are of intermediate sensitivity [38]. The precise mechanisms for this variation in sensitivity are not known but both DNA conformation and levels of endogenous radioprotectors are thought to be involved [39]. In an untreated tumour in vivo, the component cells are not a synchronous cell population and are randomly distributed through all different phases of the cell cycle. During a fractionated course of radiotherapy given over a period of several weeks tumour cells will also tend to redistribute throughout the cell cycle. The effects of cell cycle phase in clinical radiotherapy are therefore likely to be small.
The term intrinsic cellular radiosensitivity is generally applied to the radiosensitivity of cells under well-oxygenated conditions but it is important to consider that the in vivo responsiveness of cells may be modified by the presence of hypoxia. In vitro
experiments with established tumour cell lines and in vivo experiments with mouse tumours have demonstrated clearly that hypoxic cells are more resistant to radiation than well-oxygenated cells and that many tumours contain a proportion of hypoxic cells [40,41]. There is also good evidence that hypoxia is a cause for local treatment failure in patients [42-44]. The level of hypoxia at which radioresistance is seen is between 0-30 mm Hg. The magnitude of the sensitisation seen with oxygen is dependent on the level of oxygen and both the dose and type of irradiation but at doses of 2 Gy of X-rays the oxygen enhancement ratio is approximately 2.0 [45].
Several mathematical modelling studies have been carried out to compare the effects on treatment outcome of differences in radiobiological parameters [33, 46, 47, 48]. In the modelling study by Tucker and Thames (1989), tumour cell doubling time, hypoxic cell fraction, clonogen cell number and intrinsic radiosensitivity were compared and the tumour SF2 was found to be the most important predictor of
[33]. The clinical situation is obviously more complex than that simulated in modelling studies, as tumour parameters may change, (e.g. tumour reoxygenation may occur during a fractionated course of radiotherapy). Accepting the limitations of mathematical modelling, these studies support the concept that these factors are likely to be important predictors of treatment outcome.
1.4. The measurement of human tumour radiosensitivity
1.4.1. Clonogenic assays
The most direct way of assessing cellular radiosensitivity would be to measure the survival of irradiated cells using a clonogenic assay but there are a number of obstacles to carrying out such assays with fresh human tumour biopsies. None of the clonogenic assays currently available can be used alone to grow cells from all human tumours (maximum ~ 70%), and the cells from those tumours that can be grown often have a low plating efficiency and grow slowly. Normal cells within a tumour (e.g. fibroblasts, macrophages, endothelial cells) may also grow in tumour cultures so that it cannot be assumed that all of the colonies that are observed are composed only of tumour cells.
The usual range of plating efficiencies observed for cells isolated freshly from human tumours is from 0.01% to 10%, with a mean of 0.1% (i.e. for every 1000 tumour cells plated, an average of 1 colony is produced). These low plating efficiencies could represent the true number of stem cells within tumours or could indicate that optimal growth conditions have not yet been found for human tumours
in vitro. Minor modifications to growth media (e.g. addition of growth factors or the use of a different serum supplement), can greatly improve the plating efficiency of human tumour cells, suggesting that suboptimal growth conditions may be one reason for low plating efficiencies. Hill & Milas (1989), however, have shown that the number of tumour cells required to transplant a mouse tumour (TD50) correlated with the plating efficiency, suggesting that the plating efficiency might indeed reflect the number of clonogenic stem cells within a tumour [49].
et al. (1993) have recently applied a modified version of this technique to fresh cervix carcinoma specimens and achieved a 73% success rate with a median plating efficiency of 0.06% [51]. The range of SF2 values in this study was 0.14-0.92 with
a median value of 0.40. In this series, 88 patients were evaluable for local tumour control with a minimum follow-up of 2 years following radiotherapy. Among these patients, there was a statistically significant correlation between SF2 and both local
tumour control and patient survival.
1.4.2. Short-term growth assays
Short-term growth assays have been developed as an alternative to clonogenic assays in an attempt to improve success rates and to obtain a more rapid result. Three main techniques have been used for human tumour cells - the Adhesive Tumour Cell Culture System (ATCCS), a tétrazolium dye reduction assay (MTT assay), and the explant assay. The ATCCS was developed by Baker et al. (1986) and is described in detail in Sections 2.4 and Chapter 4 [52]. Briefly, the main features of the assay are that cells are cultured in 24-well plates coated with a cell adhesive matrix (CAM) comprising fibrinogen and fibrinopeptides, which is reported to inhibit the growth of fibroblasts and encourage the growth of tumour cells [53]. The plates are irradiated with a range of X-ray doses and then incubated for approximately 2 weeks. In contrast to a clonogenic assay where colonies are counted, the total cell number is estimated from a reading of integrated optical density of wells which have been stained with crystal violet using an image analysis system.
Brock et al. (1990) used the ATCCS in a series of 72 patients with head and neck cancer treated with post-operative radiotherapy and found a rate of 68% successful assays with a mean SF2 of 0.33 (range 0.11-0.91) [4]. At follow-up of
approximately one year, the mean SF2 in 12 patients with recurrent disease was
0.40, compared with 0.30 in patients who were disease-free but this difference was not statistically significant. This was a group of patients, however, who had been treated with radical surgery with either no disease or only microscopic disease remaining at the time of post-operative radiotherapy so that it is difficult to evaluate the real influence of radiotherapy in these patients. In a preliminary report, Girinsky
et al. (1992) have shown a correlation between local tumour control and the a value (i.e. initial slope of the cell survival curve) in 56 patients with carcinoma of the cervix and head and neck treated with radiotherapy alone or combined surgery and radiotherapy [54]. A trend was also observed with SF2 but this did not reach
local control rates following radiotherapy than patients with values below this level but there was no correlation overall between local tumour control and the a value [55]. The phenotype of the cells grown in the ATCCS was questioned in this study with the finding that all of the evaluable tumour cultures studied (total 16) were diploid, indicating that they might be fibroblasts, rather than tumour cells. Some results with this technique have been disappointing [56, 57]. In the study by Price et al. (1991), of 22 tumours of varying histological type, a lower success rate (41%) was found and fibroblast contamination was observed, indicating that this assay might not be applicable to all tumour types [57].
The MTT assay is a method for detecting viable cells in short-term cultures which has been widely used for measuring the radiosensitivity of established tumour cell lines [58]. It is a colourimetric assay in which a tétrazolium salt, 3-(4,5- dimethylthiazol-2-yl)-2,5-diphenyl tétrazolium bromide (MTT) is metabolised in viable cells to an insoluble purple formazan product. A similar metabolic stain, using 2-(4-iodophenyl)-3-(4-nitrophenyl)-5-phenyltetrazolium chloride (INT), can also be used to visualise the tumour cell colonies in the long-term Courtenay soft agar assay. In principle, the viable cell number is proportional to the production of this formazan product, which can be measured with a spectrophotometer. The assay detects only metabolically active cells, and unlike stains such as crystal violet, does not stain debris or adsorbed protein, but it cannot distinguish between viable cells which are clonogenic and sterilised cells which have lost the ability to divide further (i.e. doomed but still viable). Using the MTT assay, Ramsay et al. (1992) found no direct correlation between SF2 value and survival in 24 patients with malignant
gliomas but the mean SF2 was lower for patients surviving longer than 18 months
[59]. Larger numbers of patients are required to confirm these findings.
Mothersill et al. (1988) described an explant technique in which 2 mm^ pieces of tumour or normal tissue were placed in the centre of tissue culture flasks [60]. These were irradiated with a range of X-ray doses and incubated for approximately 2 weeks. The area of cellular outgrowth around the tumour was measured in each flask and the results expressed as the percentage of control area. The main disadvantages with this assay are that it requires relatively large amounts of tissue and the initial numbers and type of clonogenic cells are poorly defined in each explant.
Some of the growing cells may have made only 1 or 2 divisions (so-called abortive divisions) and may not actually be capable of unlimited cell division. However, these processes may be typical of those in tumours and could mimic some aspects of the in vivo tumour response to radiotherapy.
1.4.3. M easurem ent o f D N A damage
The importance of DNA as the critical target and of double strand breaks (dsbs) as the main radiation-induced lesion has been discussed above (Section 1.3.3). There are several techniques available for measuring DNA dsbs including neutral elution, sucrose sedimentation and pulse field gel electrophoresis although some studies comparing these different methods have found conflicting results [61-64]. One problem in the past has been the insensitivity of these techniques at doses <10 Gy but recent results with pulse field gel electrophoresis have detected DNA dsbs at ~2 Gy. At these lower doses a correlation between residual, unrepaired DNA dsbs and clonogenic cell survival has been found for some established cells lines but further work is needed before this technique can be applied to primary tumour samples [64].
Several assays have been developed to measure other types of DNA damage including the micronucleus assay, nucleoid sedimentation, fluorescence in situ
micronucleus frequency for each cell line, there was a poor correlation between absolute micronucleus frequency and clonogenic cell survival [71]. Further work is needed to address these problems but this assay is sensitive at low doses of 1-2 Gy and it is potentially suitable for automation.
1.5. The response o f normal tissues to radiotherapy
1.5.1, General comments
The total dose of radiotherapy used to treat tumours is limited by the reactions of the normal tissues in the treatment volume. In general, with fractionated radiotherapy, the late radiotherapy reactions tend to be more dose-limiting than the early reactions and most clinicians consider that the incidence of serious side-effects must be kept at <5%. Several factors can affect the level of radiation-induced normal tissue damage, including the total X-ray dose, the dose per fraction, the interfraction interval and patient related factors (e.g. the presence of intercurrent illness, medication or smoking). There is variation in the 'tolerance' of individual tissues throughout the body which is dependent on both the organisational structure of the tissue and its function and there appear to be significant differences in radiation sensitivity between individuals which cannot be explained by differences in radiation dose (Section
1.5.2).
Figure 1.3. Theoretical dose-response curves for tum our and normal tis s u e .
100
tum ou r o
l |
E CD
O normal
tissue
40 >N ro
~ E
P
| 5
20
20 30
0 10 40 50 60 70 80 90 100
1,5.2. The range o f responses o f normal tissues to radiotherapy
Several rare genetic disorders are known to be associated with increased normal tissue reactions to radiotherapy, including Ataxia Telangiectasia, Gardner’s syndrome, Huntingdon's chorea, Fanconi's anaemia, Cockaynes syndrome [73]. Ataxia Telangiectasia (AT) is a rare disorder but it has been estimated that heterozygotes occur at an incidence of ~ 1 in 100. Epidemiological studies also suggest that the incidence of AT heterozygotes may be higher among cancer patients, e.g. up to 1 in 10 breast cancer patients [74]. Fibroblasts and lymphocytes taken from homozygotes with AT show increased in vitro radiosensitivity compared with cells from normal individuals and cells from AT heterozygotes have been shown to cover a range of sensitivities from normal to values close to those for AT homozygotes. A gene, ATM, has recently been cloned on chromosome 1 Iq 22-23 which has a transcript of 12 kilobases and is mutated in patients from all complementation groups [153]. Elucidation of the full range of AT mutations should make it possible to identify AT heterozygotes and thereby determine the 'true' incidence of AT heterozygotes and their radiation sensitivity during the next few years. To date, the only germline mutation associated with increased radioresistance is Li-Fraumeni syndrome where p53 mutations are implicated in the phenomenon of radioresistance [152]. This syndrome is associated with several malignant neoplams but it is rare, accounting for less than 1% of breast cancers so that its importance in clinical radiotherapy is likely to be slight.
In addition to patients with known genetic disorders there is a spectmm of responses in the remaining radiotherapy population [75]. Several small studies have shown increased in vitro fibroblast radiosensitivity among patients showing marked sensitivity to radiation who have no known genetic disorder [76-80]. Among patients showing a 'normal' response to radiation, a correlation has been found between in vitro radiosensitivity and late normal tissue reactions but no correlation has been found with early normal tissue reactions [81-85]. To date, however, these have all been relatively small studies (each involving less than 50 patients) and further work is needed to confirm these findings.
Although the clinical data are currently scarce, there are large published series on the range of in vitro radiosensitivity measurements found in fibroblasts [5, 73]. These studies have all shown a spectrum of radiosensitivity measurements in fibroblasts, with SF2 values ranging from ~ 0.35 in normal individuals down to 0.02-0.10 in