Coordinated Power Management Scheme For Pv
Based Dc Micro-Grid
P.Ramesh, D.Kodandapani, P.Velrajkumar, V.Agalya and M.Hari
Abstract: Now a day’s DC micro grids have more discussion in the power system research due to various advantages like more efficient, cheaper and less initial cost compared to the conventional AC micro-grids. The main issues in DC micro grid is to avoid power mismatch while injecting to utility grid, to have a cost effective utilization of available grid power, to optimize the usage of renewable energy resource and storage energy and to have effective usage of system through power balancing and load shedding. This research is more focused on the modeling of grid connected DC micro grid with PV array, battery energy storage system and converters with each segment connected to the DC bus. To establish a coordinated control between the converters, at the end is to implement an efficient power management scheme. The simulation results are shown by using MATLAB/Simulink software.
Index Terms: DC microgrid, Coordinated Power Management scheme, PV array.
————————————————————
1
INTRODUCTION
Recent technologies combined with technological advances in power electronic systems in small scale distributed power generation systems. Growing in the penetration of distributed generators (DGs) along with renewable energy sources (RES), energy storage systems (ESS) and new types including electric vehicles (EVs) and heat pumps in modern powersystemshas led to an increase in environmental concern s and a reduction in fossil fuel reserves. However if all these new components begin to be implemented an uncoordinated way, as in the case today [1]-[4], they may pose many technical and operational challenges. Micro grids are in which the distributed generation units (DGs) and battery energy storage systems (BESS) are connected to load using DC bus as coupling medium. DC MGs have been recognized as more attractive for numerous uses due to higher efficiency, more natural interface to many types of renewable energy sources (RES) and BESS, better compliance with consumer electronics, also Electric Vehicle's [5]-[9] . In cost aspect DC micro grid are 11% cheaper than AC micro grid. DC micro grids are maintains good quality of power, control, unique and also higher efficiencies compared to the AC micro grids [9]-[13].The overall energy efficiency could be further improved by replacing conventional siliconbased power conversions with more effective wide band gap (WBG) power converters being i nvestigated. AC and DC micro grid control and management is a major research field of addressing some of the main challenges such as renewable energy integration, source optimization and stability issues etc.
Involving a large number of decentralized energy sources requ ires significantly organized control based on a high bandwidth communication network in order to maintain continuous operati on under all working conditionsControl strategy focused on a l ow bandwidth communication connection for managing a dc m icrogrid that allows the execution of distinct operating states su ch as blackstart or microgrid recovery, origin and energy optimi zation during stable operation and emergency conditions etc.[1 ], on DC microgrid structure has been presented in [ 1]-[9 ]. Few grid control techniques presented in [6]. Various MPPT techniques have been presented in [7],[9]-[10]. Conventional power management of PV system with hybrid in islanded mode is shown in [8],[10]. Few DC grid standards during power management have been given in [9]. Implementation of DC micro grids in addition with coordinated control schemes need to be developed in order to achieve an intelligent control system with extended objectives. Depends on the type of the communication available the DC microgrid can be coordinated in three different ways namely decentralized control, centralized control, distributed control. There are different stabilization techniques available in the literature namely active damping (small- and large-signal strategies), linear feedback stabilization, adaptive stabilization and loop cancellation techniques. There are different operation modes related to dc micro grid namely storage operation mode, grid operation modes, PV operation modes and load operation modes.
2
POWER
MANAGEMENT
SCHEME
WITH
STATE
OF
CHARGE
EQUALIZATION
STRATEGIES
Electric loads can be viewed as a composite of power loads, current loads and impedance loads in traditional distribution system. These usually do not cause loss of stability for current and impedance loads. Power loads, also known as constant power loads (CPLs), however, refer to loads that
consume constant power regardless of their input voltageBeca use of their negative incremental impedance, the CPLs degrad e device stability. CPL's influence can be expressed as:
(1)
Where Vo and io are the instantaneous load voltage and curre nt, and where Po, Vo and Io are the steadystate load, voltage
2 0 0 0 0 0 ) , ( 0 0 ) 0 , 0 ( 0 0
I
P
i
P
i
i
v
I V I V
_______________________________• P.Ramesh, Dept. of EEE, CMR Institute of Technology, Bengaluru,India, Mob-9597078889. E-mail:[email protected]
• D.kodandapani, Dept. of EEE, CMR Institute of Technology, Bengaluru,India, Mob-7829558575. E-mail:[email protected]
• P.Velrajkumar, Dept. of EEE, CMR Institute of Technology, Bengaluru,India, Mob-9677191736. E-mail: velrajkumar.p:@cmrit.ac.in
• V.Agalya, Dept. of EEE, CMR Institute of Technology, Bengaluru,India, Mob-9840986507. E-mail:[email protected]
6862
The droop coefficient in the charging process is set to be proportional to the nth order of SoC, while it is set to be inversely proportional to the nth order of SoC in the discharge system as shown below:
During charging:
(2)
During discharging:
(3)
Where SoCx is the SoC of ESS #x, n is the order of SoC, m0 is
the initial droop coefficient when SoC equals 100%, poi is the output power of converter #x. By using the above method, the SoC balancing and injected/output power equalization can be achieved automatically in both charging and discharging process.
3 SIMULATION
RESULTS
AND
DISCUSSION
Simulation is done for the PV based dc micro grid and the various parameters that considered as shown in Table-I and the schematic block diagram of the circuit considered with 10kW of load which incorporates the power management scheme is shown in Fig. 2. In the simulation the input (i.e., solar irradiance) is considered as variable over a simulation period of time.
TABLEI
PARAMETERS PERTAINING TO THE SIMULATION
Kd 0.8
SOCmax 0.8
SOCmin 0.2
Gridsupply unit
3000
Gridinjectrion limit
2000
PVpeak 25kW
In the Fig.4, Fig.5 and Fig.6 shows the various simulation results like load voltage, load current, load power when the load is of 10kW (maximum).
ox n x dc
dcx
v
m
SoC
p
v
0*
*
ox n x dc
dcx
p
SoC
m
v
In the Fig.7, shown the various simulation results with respect to battery (BESS) such as SOC (%), battery voltage is comparing with irradiance when the same load is of 10kW (maximum) is considered in Island mode. Slowly the SOC is increasing towards 100%, battery voltage has fluctuations and is due to reduction in irradiance. In the Fig.8, shown the various simulation results with respect to the power management during the dc micro grid connection with main grid. And is shown battery current, grid current is comparing with irradiance when the same load is of 10kW (maximum) is considered in grid connected mode. It is observed that the battery current is becoming maximum when the low irradiance occurred is due to the operation of BESS and the grid current is not affected due to reduction in irradiance.
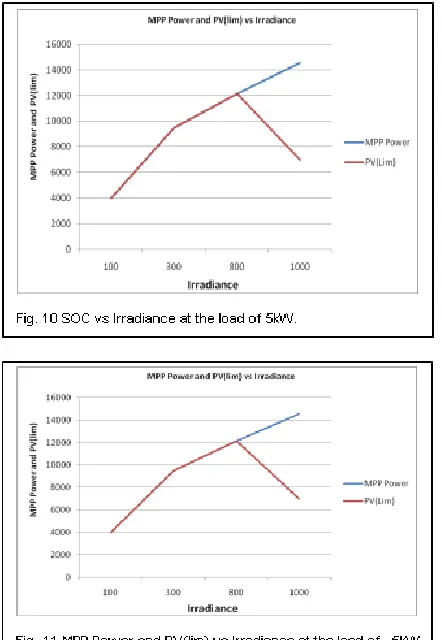
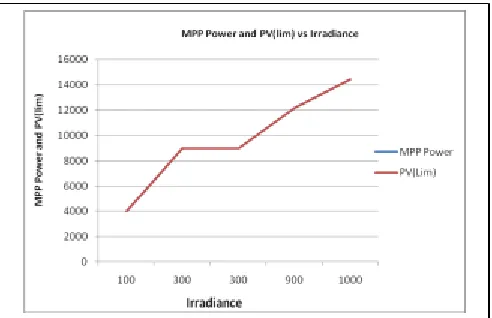
3.1 Power management scheme with 5kW load
Table-II shows the various simulation data pertaining to the 5kW loading and comparison of various parameters with and without power management scheme. Fig. 9, Fig.10 shows the graphical representation of Table-II data withoutpower management. Fig. 11 shows the graphical representation of Table-II data with power management under 5kW loading condition.It is observed from Tablse-II, Fig. 9, Fig.10 and Fig. 11 that, as both irradiance and SOC is more, Battery power is not utilized and more power is injected to grid and also PV is limited instead of using entire MPPT power. When irradiance is decreased, Battery is made to deliver power and Supply from grid is reduced in system with power management. When SOC is less, system without power management is delivering power from grid and charging the battery with more power but in system with power management, power is not at all taken from grid and still demand is satisfied. When both irradiance and SOC is less, load is limited by load shedding and battery is also allowed to charge but not in case of previous system.
TABLEII
POWER MANAGEMENT SCHEME WITH 5KW LOAD
Inputs
Without Management
(Deliver)
With Power Management(Receive)
Irradia nce
PV Pow er
SO C
MP P Pow
er Stora
ge Gri
d K L
Stora ge
Gri d
PVli m
100 851 10 400
0 6093 13 28
0. 8 1700
25 49
400 0
300 3715 70 9482 540 3066 1 554 831 9482
800 124 44 10
121
52 7774 25
15 1 2938 20 00
121 52
1000 163 09 90
145 72 0
17
14 1 0 20 00
6864 3.2 Power management scheme with 10kW load
Table-III shows the various simulation data pertaining to the 10kW loading and comparison of various parameters with and without power management scheme.
TABLEIII
POWER MANAGEMENT SCHEME WITH 10KW LOADS
Inputs
Without Management (Deliver)
With Power Management(Receive)
Irradia nce
PV Pow er
SO C
MP P Pow
er
Stora ge
Gri d
K L
Stora ge
Gri d
PVli m
1000 16385 60 14919 2887 1613 1 2513 2000 14920
700 108 51 60
131
80 2555 28
20 1 600 15
0 131
80
100 945 60 101
80 6630 34
15 1 7324 18 31
101 80
0 0 60 0 7709 33
70 1 8080 20 20 0
100 943 20 475
0 6609 33 84
0. 4 7326
18 31
475 0
100 855 0 4000 0 1787 0.4 0 3000 4000
Fig. 12, Fig.13 shows the graphical representation of Table-II data withoutpower management. Fig. 14 shows the graphical representation of Table-III data with power management under 10kW loading condition.
3.3 Power management scheme with 15kW load
In the same manner, Table-IV shows the various simulation data pertaining to the 15kW loading and comparison of various parameters with and without power management scheme.
TABLEIV
POWER MANAGEMENT SCHEME WITH 15KW LOAD
Inputs
Without Management
(Deliver)
With Power Management(Receive)
Irradia nce
PV Pow er
SO C
MP P Pow
er
Stora ge
Gri d
K L
Stora ge
Gri d
PVli m
100 988 10 400
0 9691 64 19
0. 4 9007
30 00
400 0
300 418 3 70
900
0 9197 32
94 1 8734 21 83
900 0
300 4183 10 9000 9691 6419 0.6 9454 3000 9000
900 141 30 20
121 70 646
29 35
0. 8 776
19 4
121 72
1000 158 43 70
144 28 758
14
84 1 1025 14
9 144
28
Fig. 15, Fig.16 shows the graphical representation of Table-II data withoutpower management. Fig. 17 shows the graphical representation of Table-IV data with power management under 15kW loading condition.
It is observed from Table-IV, Fig. 15, Fig.16 and Fig. 17 that, when load is increased, still power is injected to grid under full irradiance and more SOC. When irradiance is decreased power is taken from both battery and grid but less than previous system. When SOC is less and irradiance is also reduced, load is constrained and power taken from grid is reduced than previous system. When both irradiance and SOC is reduced grid is made to supply its full limit and also load shedding is done. With same SOC when irradiance is increased load constrained is reduced than above case and still grid is made to supply its full limit to meet the demand. On the contrary, previous system is taking more power from grid and battery is also forced to deliver more power under less SOC which may affect battery life time. Inference from the results clearly shows that system with power management uses grid power in cost effective manner and demand from varying load is also satisfied optimally through power balancing and load shedding. Battery power is handled properly so that life time of battery does not get affected. Power management method also provides a chance to set grid supply and injection limits to avoid mismatch, and these can be collected from smart grids through implementation of intelligent layers.
4
CONCLUSION
DC microgrid with PV array, battery (BESS) and utility grid along with their respective converters and controllers is applied with power management scheme under three different loading conditions. Working of DC microgrid in both islanded and grid-connected modes are verified. Power management scheme is integrated with modelled DC microgrid, for optimum operation of the DC microgrid system. Performance of the DC microgrid with and without power management scheme is analyzed.
REFERENCES
[1]. R. Pradhan, M. Chirayath and S. Thale, "Coordinated control strategy for a DC microgrid with low bandwidth communication," 2016 IEEE International Conference on Power Electronics, Drives and Energy Systems (PEDES), Trivandrum, 2016, pp. 1-6.
6866
control of hybrid AC-DC microgrid with solar energy, energy storage and critical load," 2014 Clemson University Power Systems Conference, Clemson, SC, 2014, pp. 1-6.
[6]. Yilmaz, Unal, Ali Kircay, and Selim Borekci. "PV system fuzzy logic MPPT method and PI control as a charge controller." Renewable and Sustainable Energy Reviews, 81, pp: 994-1001, 2018.
[7]. Gautam, S., Raut, D. B., Neupane, P., Ghale, D. P., & Dhakal, R. (2016, November). “Maximum power point tracker with solar prioritizer in photovoltaic application,” In 2016 IEEE International Conference on Renewable Energy Research and Applications (ICRERA) (pp. 1051-1054). IEEE.
[8]. Justo, J. J., Mwasilu, F., Lee, J., & Jung, J. W. (2013). “AC-microgrids versus DC-microgrids with distributed energy resources: A review. Renewable and sustainable energy reviews,” 24, pp.387-405.
[9]. Mahmood, H., Michaelson, D., & Jiang, J. (2014). “A power management strategy for PV/battery hybrid systems in islanded microgrids.” IEEE Journal of Emerging and Selected topics in Power electronics, 2(4), 870-882.
[10].Che, L., & Shahidehpour, M. (2014). “DC microgrids: Economic operation and enhancement of resilience by hierarchical control,” IEEE Transactions on Smart Grid, 5(5), 2517-2526.
[11].Nithara, P.V., Hari, M., Sreelakshmi, C.S., Reshma, P.Eldho. (2019). “V-f Controlled Autonomous Wind Energy Conversion System using Z2 Transformer connected STATCOM,” International Journal of Engineering and Advanced Technology, 8(6), pp. 1492-1496.
[12].Rodriguez-Diaz, E., Savaghebi, M., Vasquez, J. C., & Guerrero, J. M. (2015, September). “An overview of low voltage DC distribution systems for residential applications,” In 2015 IEEE 5th International Conference on Consumer Electronics-Berlin (ICCE-Berlin) (pp. 318-322). IEEE.
[13].Planas, E., Andreu, J., Gárate, J. I., de Alegría, I. M., & Ibarra, E. (2015). “AC and DC technology in microgrids: A review. Renewable and Sustainable Energy Reviews,” 43, 726-749.
[14].Rodriguez-Diaz, E., Vasquez, J. C., & Guerrero, J. M. (2015). “Intelligent DC homes in future sustainable energy systems: When efficiency and intelligence work together,” IEEE Consumer Electronics Magazine, 5(1), 74-80.