THE CAUSAL RELATIONSHIP BETWEEN INSURANCE
AND ECONOMIC GROWTH IN NIGERIA (1986-2010)
TAIWO AKINLO* (corresponding author)
Department of Economics Obafemi Awolowo University, Ile-Ife, Nigeria.
ABSTRACT
This study examined the causal relationship between insurance and economic growth in Nigeria over the period 1986-2010. The Vector Error Correction model (VECM) was adopted. The cointegration test shows that GDP, premium, inflation and interest rate are cointegrated when GDP is the edogeneous variable. The granger causality test reveals that there is no causality between economic growth and premium in short run while premum, inflation and interest rate Granger cause GDP in the long run which means there is unidirectional causality running from premium, inflation and interest rate to GDP. This means insurance contributes to economic growth in Nigeria as they provide the necessary long-term fund for investment and absolving risks.
Key words: Economic growth, Insurance, Vector Error Correction Model (VECM),
JEL Classification: 040, G20, C1
1. INTRODUCTION
Over the years, the insurance sub-sector has witnessed some significant growth worldwide. The share of the insurance sector in the financial sector has been increasing over the years. This is reflected in the business volume of the insurers (Beck and Webb, 2003). Theoretically, the various channels through which insurance can positively impact economic growth have been identified in the literature. These include mobilization of domestic savings, more efficient management of different risks, mitigation of losses, more efficient allocation of domestic capital and promotion of financial stability (Skipper, 2001). While several studies have attempted to identify the various ways through which insurance could affect economic growth, only few have addressed the issue of causality between insurance development and economic growth.
In the literature, there are three schools of thought on the nature of the relationship between insurance and economic growth. The first school of thought postulates that insurance leads to economic growth while in contrast, the second school of thought argues that economic growth leads to the development of insurance sector Patrick (1966). The third school of thought suggests bidirectional relationship between insurance development and economic performance (Haiss and Sumegi, 2008). The available empirical evidence on the insurance-growth relationship has produce mixed results. While some studies such as Boon (2005), Arena (2008) and Webb et al (2002) found a unidirectional causality running from insurance development to economic growth, while Ching, Kogid and Furuoka (2010) reported the obverse. A study by Kugler and Ofoghi (2005) found evidence of bidirectional relationship between insurance and economic growth while a handful provided evidence of neutrality of insurance and economic growth. As an illustration, the study by Ward and
Zurbruegg (2000) for OECD countries found no cointegration relationship for Austria, Switzerland, the UK and the US. For Ausralia, Canada, France, Italy and Japan the null hypothesis of no cointegration relationship was rejected. The results showed that insurance growth did cause economic growth for Canada, Italy and Japan. Also Catalan, Impavido and Musalem (2000) found no causality in many OECD countries and mixed results in emerging countries.
The remaining discussion is organized into four sections. In section 2, a brief summary of evolution of insurance in Nigeria is provided. Empirical studies on the causal relationship between insurance and economic growth is considered in section 3. The specification of the model is contained in section 4. The last section contains the concluding remarks.
* Akinlo, Taiwo is graduate student in the Department of Economics Obafemi Awolowo University, Ile-Ife,
2. EVOLUTION OF INSURANCE IN NIGERIA
The beginning of insurance in Nigeria is highly connected with the advent of British trading company in the region and the subsequent increased inter-regional trade. During this period, shipping and banking activities increase due to increased in trade and commerce. It therefore became expedient for some foreign firms to handle some of their risks locally (Uche and Chikeleze, 2001). Trading companies were therefore subsequently granted insurance agency licences by foreign insurance companies. Such licenses made it possible for such firms to issue covers and assist in claims supervision. In 1918 Africa and East Trade Companies introduced the Royal Excange Assurance Agency followed by other agencies such as Patterson Zochonis (PZ) Liverpool, London and Globe, BEWAC’s Legal and General Assurance and the Law Union and Rock (Osoka, 1992).
In 1961, Obadan commission was set up to review the situations in the insurance industry and also to come out with recommendations. The outcome of Obadan commission gave rise to establishment of Insurance Companies Act of 1961. In 1969, fifty insurance companies have been established in Nigeria, though with foreign domination. The foreign domination made the Federal Government of Nigeria became sceptical as to what future holds for the then insurance industry that was generally dominated by the foreigners even as Nigerians were not allowed to hold sensitive positions which would have equipped them for managerial or technical responsibilities in the industry. As a result of this, a parliamentary committee was therefore set up in 1964, under the chairmanship of honourable Obadan, for second time to look into the foreign domination of insurance. In the end, Obadan committee’s recommendation could not go beyond sensitization of Government over the danger inherent in the foreign domination of insurance industry.
There was an upsurge and phenomenal increase in the number of insurance companies operating in the Nigeria between 1985 and 1990. During this period there were existing over 110 insurance companies in the country. This therefore led to the formation of National Insurance Corporation of Nigeria (NICON), which was later christened NICON Plc by the federal government. The first major recapitalization process was introduced by the Insurance Act 2003. Section 9 of the Insurance Act raised minimum capital requirements by as much as 650%. This recapitalization exercise which ended in February 2004 however still left over 107 insurance as well as reinsurance operators in the market. However, the exercise was adjudged ineffective in drastically reducing the number of players in the industry (Fatula, 2007:129).
Therefore, in 2005 a new recapitalization exercise was introduced. This exercise required an increase of capital base for life insurers to two billion naira from one hundred and fifty Million naira, from two hundred and fifty million naira to three billion for Non-Life businesses, from three hundred and fifty million naira to ten billion for Reinsurance and from three hundred and fifty million naira to five billion naira for the Composite. According to Research and Market (2009), following the completion of the 2005/06 recapitalisation exercise, which also involved a quite number of consolidations, the statistics shows that out of the 104 insurance companies and four reinsurance companies that existed before the reforms, only 49 underwriters and two re-insurers met the new capital requirements and were certified by the government in November 2007. Also, of the 312 companies listed on the exchange with 36 industry classification as at 2011, insurance industry has the highest number of individual firms listed on the exchange. The consolidation exercise initiated by NAICOM in 2005 led to the current structure of the insurance industry in Nigeria.
3. REVIEW OF EMPIRICAL LITERATURE
Catalan, Impavido and Musalem (2000) analysed Granger Causality of insurance asset for 14 OECD and 5 developing countries over the period 1975 to 1997 vis-à-vis GDP growth (among others). According to their analyses, contractual savings seems to have some connection to Market Capitalization and Value Trade in the majority countries. The correlation between MC and pension funds is the same as with MC and contractual savings, but the nexus of pension funds-VT is mixed. The Catalan et al (2000) analyses, 9 OECD countries support the life insurance- MC link, the result for the developing countries are mixed. Evidence for the connection of life insurance to VT is not so strong in OECD countries, whereas, the majority of non OECD countries show this linkage. The impact of non-life business is almost equal to the impact of the life business for MC and less for VT. The linkage proposed by the author between contractual savings and MC or VT seem to hold for OECD countries, especially for countries in small and tight market but enabling regulatory environment. The second proposition- to favour contractual saving over institutional investors (e.g. non-life insurance) – is also supported by the result and induces the authors to recommend an appropriate sequencing of financial institutions’ development.
They applied bivariate VAR methodology to test for Granger causality. Causality test from vector autoregresion in levels shows that the insurance activities led economic growth in two countries (Canada and Japan), while in case of Italy there was bidirectional relationship between insurance and economic activity. However, the relationship was weaker and less significant than for two above mentioned countries. For all other countries there was no evidence for the interaction. They concluded that the causal relationship between insurance and economic growth might well vary across countries because of the influence of number of country specific factors, such as cultural, regulatory and legal environment, the improvement in financial intermediation and moral hazard effect in insurance.
Webb, et. al (2002) examined the causal relationship of banks, life, and non-life insurance activity on economic growth in the context of a revised Solow-Swan neoclassical economic growth model, where the authors include financial activities (bank, life and non-life insurance) as an additional input in the production function assumed to be a Cobb-Douglas type. The empirical specification falls in the context of the cross-country economic growth regressions literature (Barro andSala-I-Martin, 1995), where the growth rate of real GDP per capita is regressed against the change in capital intensity (gross domestic investment), human capital (education enrolment), the ratio of government consumption to GDP, the degree of openness (the ratio of exports to GDP), the initial level of GDP per capita, and measures of financial intermediary activity (the ratio of bank credit to GDP, the ratio of non-life insurance premiums to GDP, and the ratio of life insurance premiums to GDP). For the estimation, the authors use the three-stage-least-squares instrumental variable approach (3SLS-IV), where the instruments used are the legal origin of the country (English, French, German, Scandinavian, or Socialist) for the banking measure, a measure of corruption and quality of the bureaucracy for the non-life insurance measure, and the religious composition of the country (Catholic, Muslim, or Protestant) for the life insurance measure. In order to assess a causal relationship with economic growth, the authors use average levels the explanatory variables. Among the main findings, the authors showed that the exogenous components of the Banking and life insurance measures are found to be robustly predictive of increased economic growth. However, these measures are not significant in the presence of interaction terms between banking and life insurance, and between banking and non-life insurance; when these interaction terms are included, the individual variables loss explanatory power. The latter result would suggest the presence of complementarities among financial intermediaries.
Esho, Kirievsky, Ward & Zurbruegg (2004) focused on the legal framework besides the GDP-Property-Causality Insurance Consumption link. The causality analysis is based on data from 44 countries over a time period from 1984 to 1998 and includes OLS and fixed-effects estimations and GMM estimation on panel data. The results showed that real GDP and the strength of the property rights in a country are positively correlated to insurance consumption. The insurance demand is significantly connected to loss probability, but the link with risk aversion rather weak. The price only shows a slight negative impact if investigated with GMM estimator. Although the data set showed big differences between the developments of countries of different legal origin, no evidence was found for the legal origin being a significant indicator for PCI consumption. In contrast to other sectors the importance of the property rights suggested that the legal environment facilitates insurance demand.
Kugler and Ofoghi (2005) evaluated both a long-run relationship and Granger-causality between insurance market size and economic growth for the United Kingdom using net written premium for each insurance market (general and long-term insurance) for the period 1966-2003. Using Johansen’s cointegration test, the authors found a long-run relationship between development in insurance market size and economic growth for all insurance components. Regarding causality tests, there is evidence of long-run causality from growth in insurance market size to GDP growth for eight out of nine insurance categories that are considered. Short–run causality exists from life, liability and pecuniary loss insurance. As the authors noted out in the paper, these results do not permit to make a definitive conclusion regarding causality.
4. METHODOLOGY 4.1 Unit Root test
Most of time series have unit root as demonstrated by many studies including Nelson and Plosser (1982), Stock and Watson (1988) and Campbell and Peron (1991). Therefore, their means of variance of such time series are not independent of time. Conventional regression technique based on non-stationary time series produce spurious regression and statistic may simply indicate only correlated trends rather true relationship Granger and Newbold (1974). Spurious regression can be detected in regression model by low Dubin-Watson statistics and relatively moderate .
Therefore, to distinguish between correlation that arises from share trend and one associated with an underlying causal relationship; we use both the augumented Dickey fuller (Dickey and Fuller 1979, 1981) and the KPSS (Kwiatowksi-Philip-Schmidt-Shin 1992) test. Thus, the limitation of the ADF statistics in deciding whether Θ = 1 or Θ = 0.98, in a model like: = + Θ + has been remedied by the application of the KPSS statistic
simultaneously. The null hypothesis for the ADF statistic and KPSS tests are, :
Non-stationary (unit root) and : Stationary respectively.
4.2 Cointegration
To search for possible long run relationships amongst the variables, namely GDP, premium, interest rate and inflation, we employ the Johansen and Juselius (1990) approach. Thus, we constructed a p-dimensional (4x1) vector auto regressive model with Gaussian errors that can be expressed by its first differenced error correction form as
Δ = Δ + Δ + … + Δ Δ - Π + μ + ……… (1)
Where are the data series studied, is i.i.d, N(0,Σ) + -1 + + + + + …. + for i = 1,2,3….,k-1, Π = I - - - …- . The Π matrix conveys information about the long term relationship among the variables, and the rank of Π is the number of linearly independent and stationary linear combinations of variables studied. Hence, testing the cointegration entails testing for the rank r of matrix Π by examine whether the eigenvalues of Π are significantly different from zero.
Johansen and Juselius (1990) proposed two tests statistics to determine the number of cointegrating vectors (or the rank of Π), namely the trace trace) and the maximum eigen-value max) statistics. The trace statistic (λ-trace) is computed as:
= -T∑ (1- ) ……… (2)
The trace tests the null hypothesis that “at most” r cointegration vector, with “more than” r vectors being the alternative hypothesis. The maximum eigenvalue test is given as:
= -T ln (1- ) ………..…. (3)
It tests the null hypothesis of r cointegrating vectors against the alternative hypothesis of r + 1 cointegration vectors. In the equation (2) and (3), is the sample size and λ is the largest canonical correlation.
4.3 Granger Causality
In case we do not find any evidence for cointegration among the variables, the specification of the Granger causality will be a vector autoregression (VAR) in the first difference form. However, if will find evidence of cointegration, there is the need to augment the Granger-type causality test model with a one period lagged error term. This is a crucial step because as noted by Engel and Granger (1987), if the series are integrated of order one, in the presence of cointegration VAR estimation in the first differences will be misleading.
Δln = α + ∑ Δln + ∑ Δln + ∑ Δln + ∑ Δln + +
…… (4)
Δln = α + ∑ ln + ∑ Δln + ∑ Δln + ∑ Δln + + ….(5)
Δln = α + ∑ Δln + ∑ Δln + ∑ Δln + ∑ Δln + + ……. (6)
Δln = α + ∑ Δln + ∑ Δln + ∑ Δln + ∑ Δln + +
where GDP is gross domestic product, PREM is insurance premium, INF is the inflation, INT is the interest rate, is lagged error-correction term derived from long-run cointegration relationship and , , and
are serially independent random errors with mean zero and finite covariance matrix. In each case, the dependent variables are regressed against past values of itself and the past values of other variables.
The optimal lag length p in equations 1-4 are selected by using Schwartz Bayesian Criterion. Two control variables are incorporated to avoid simultaneity bias (Gujarati, 1995) and thus minimize the spurious relationship that often arise due to omission of relevant variables that many of the bivariate tests on the domestic product and premium nexus fail to take into account. The two control variables are inflation and interest rate. The inclusion of interest rate is premised on the arguments that interest rate affects saving which in turn affect the volume of investment which also affect economic growth. The inclusion of inflation
From the system, Granger causality is examined by testing whether all coefficients of the lagged explanatory variables are statistically different from zero based on standard statistics or F-test and or whether the ECT’s coefficient is significant.
4.1 Measurement of variables and Data Source
This study used secondary data. The data were obtained from the Central Bank of Nigeria. Specifically, data on economic growth, inflation, interest rate and premium were obtained from Central Bank of Nigeria (CBN) Statistical Bulletin, 2009. The data on capital and labour were obtained from and National Bureau of Statistic (NBS) Annual Abstract of Statistics (2009).
5. EMPIRICAL RESULTS
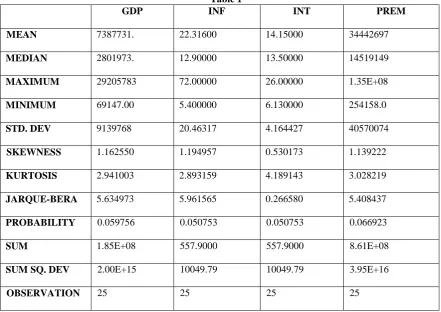
To investigate whether there is causal relationship between insurance development and economic growth in Nigeria, the empirical analysis begins with descriptive statistics. Descriptive statistics of data series provides information about sample statistics such as mean, median, minimum value, maximum value and distribution of the sample measured by the skewness, kurtosis and the Jarque-Bera statistic. Table 1 reports some descriptive statistics of variables for a period 1986 to 2010.
Table 1
GDP INF INT PREM
MEAN 7387731. 22.31600 14.15000 34442697
MEDIAN 2801973. 12.90000 13.50000 14519149
MAXIMUM 29205783 72.00000 26.00000 1.35E+08
MINIMUM 69147.00 5.400000 6.130000 254158.0
STD. DEV 9139768 20.46317 4.164427 40570074
SKEWNESS 1.162550 1.194957 0.530173 1.139222
KURTOSIS 2.941003 2.893159 4.189143 3.028219
JARQUE-BERA 5.634973 5.961565 0.266580 5.408437
PROBABILITY 0.059756 0.050753 0.050753 0.066923
SUM 1.85E+08 557.9000 557.9000 8.61E+08
SUM SQ. DEV 2.00E+15 10049.79 10049.79 3.95E+16
OBSERVATION 25 25 25 25
Table 1 show that two variables namely premium and interest rate are leptokurtic (peaked) relative to the normal as kurtosis of this series exceeds three. However, the remaining two are not as their kurtoses are below three. Finally, the probability that the Jarque-Bera statistics exceeds (in absolute value) the observed values is generally low for all the series.
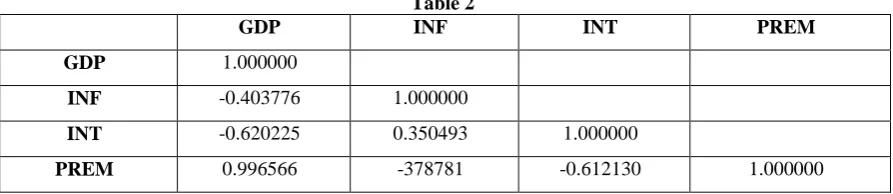
In order to examine the possible degree of association among the variables we obtained the correlation matrix of the dependent and independent variables. Table 2 below reports the sample correlation matrix of the variables employed in the study. The correlation table gives a preliminary idea of direction of relationship between the selected variables. In general, the results in table 2 shows that in terms of magnitude, the correlation coefficient is generally high while some have positive correlation others are negative.
Table 2
GDP INF INT PREM
GDP 1.000000
INF -0.403776 1.000000
INT -0.620225 0.350493 1.000000
PREM 0.996566 -378781 -0.612130 1.000000
The results in Table 2 show that premium is positively correlated with GDP. The coefficient is 0.997. This seems to suggest that increase in premium will lead to increase in economic growth. The negative correlation between inflation and GDP suggests that inflation is inversely related to GDP. Also the results show that there is negative correlation between interest rate and GDP. The correlation matrix shows that there is positive relationship between inflation and interest rate.
The correlation matrix has shown interesting results on relationship between dependent variable and independent variables. However, care must be exercised while interpreting the correlation matrix. This is because they cannot provide a reliable indicator of association in a manner which controls for additional explanatory variables. Examining simple bivariate correlation in a conventional matrix does not take account of each variable correlation with other explanatory variables. This is why the study proceeded further to use multivariate analysis. The results from both ADF and KPSS in table 3 shows that all the variables are nonstationary at level but they are all stationary at first difference therefore are integrated of order 1(1).
Table 3
ADF KPSS
level 1st difference level 1st difference
GDP(Constant)
Constant & Linear
-1.916
-1.284
-3.065**
-3.822**
1.307
0.266
0.395
0.043
PREM(Constant)
Constant & Linear
-1.456
-1.952
-2.770**
-3.170
1.260
0.238
0.277
0.051
INF(Constant)
Constant & Linear
-3.172
-4.295
-5.716***
-5.416***
0.326
0.087
0.089
0.063
INT(Constant)
Constant & Linear
-1.624
-1.638
-4.447***
-5.667***
0.488
0.200
0.346
0.052
Note. Mackinon critical values for rejection of hypothesis of a unit root. ** Denote significant at 5% critical values. ***Denote significant at 1% critical values
Having established that the variables are integrated of the same order 1(1), in order to determine whether there is at least one linear combination of these variables that is 1(0), Trace test and Maximum Eigenvalue test were conducted as proposed by Johansen and Juselius (1990). The result of the cointegration condition is presented in the panel A of Table 4 below. In the Cointegration tables, both trace and maximum Eigenvalue test indicated that there is one cointegration relationship between real GDP and other variables. In essence, both the test statistics (trace and -max) reject the null hypothesis of : r = 0 at 5 percent level of significance. The conclusion from this result is that there is a long run relationship between economic growth and other variables. The co-integrating equation (normalized on growth variable) shown in panel B of Table 2 result shows the coefficients of interest rate and insurance premium are statistically significant at one per cent (1%) and ten per cent (10%) significance level. The results also show that premium and interest rate are positively signed while inflation is negatively signed. This means that premium and interest rate have positive relationship with economic growth while inflation has negative relationship with economic growth.
Table 4
Cointegration results (with a linear) where r in the number of co-integrating vectors.
Null Alternative r λ-max Critical
Values 95%
Trace Critical
Values 95%
0 1 47.094 27.584 75.706 47.856
≤ 1 2 17.322 21.132 28.612 29.797
≤ 2 3 10.115 14.265 11.291 15.494
≤ 3 4 1.176 3.841 1.176 3.841
Panel (B): Estimates of co-integrating vector
dlog(gdp) dlog(prem) dlog(inf) dlog(int)
-1.000 0.162
(1.65)*
-0.081 (0.293)
4.766 (5.278)***
Note: t ratios are in parentheses
***denote significant at 1% and * significant at 10%.
The existence of a cointegrating relationship amongst real GDP, premium, inflation and interest rate suggest that there must be Granger causality in at least one direction; however, it does not indicate the direction of temporal causality between the variables. Both the short run and long run Granger causality are examined. The short run effects are obtained by the F-test of the lagged explanatory variables while the significance of the error correction term based on t-statistics indicates the significance of the long run causal effect.
The results obtained are shown in table 5. In the real GDP equation, both real interest rate and inflation are significant at 1% while premium is not significant. This implies that both interest rate and inflation Granger cause economic growth in the short run. In the premium equation, both interest rate and inflation Granger cause premium. In the interest rate equation, premium and inflation are significant but GDP is insignificant. This implies that both premium and inflation Granger cause interest rate. In inflation equation, premium and interest are significant while GDP is insignificant. This means that premium and interest rate Granger cause inflation. In the short run, the results in table 3 clearly show that there is bidirectional relationship between premium and interest rate. Also, there is bidirectional relationship between premium and inflation and between inflation and interest rate. However, there is unidirectional causality running from interest rate to GDP, also from inflation to GDP. The results also show that that there is no causality between economic growth and premium.
Granger cause GDP, meaning the causality runs interactively through the three other variables to GDP. In the same way, causality runs interactively from GDP, premium and inflation to interest rate in the long run.
Table 5:
Granger Causality Results F-test (2)
Dependent variable Sources of Causation (independent variables)
Short run Long run
ΔGDP ΔPREM ΔINT ΔINF
ΔGDP - 3.51
(0.173)
5.01* (0.08)
5.11* (0.078)
-0.06** (-2.44)
ΔPREM 2.33
(0.31)
- 7.93***
(0.019)
10.51*** (0.005)
0.02 (0.52)
ΔINT 2.52
(0.282)
22.60*** (0.00)
- 22.22***
(0.00)
-0.15*** (-4.44)
ΔINF 3.22
(0.199)
9.21*** (0.01)
6.62*** (0.037)
- 0.28**
(2.28)
6. CONCLUSION
The paper investigated the causal relationship between insurance development and economic growth in Nigeria over the period from 1980-2010. The estimation process starts with examining stationarity property of the underlying time series data by applying unit root test. The estimated result confirmed that GDP, premium, inflation and interest rate are non-stationary at the level data but stationary at the first differences. The existence of cointegration among variables was examined. The results show that there is one cointegrating vector amongst the variables and hence, confirmed the existence of long run relationship between the variables. The cointegrating equation also showed that premium and interest rate are positive signed while the inflation is negatively signed in the long run. The Granger causality test showed bi-directional relationship between premium and interest rate, premium and inflation; a unidirectional causality from interest rate to GDP, inflation to GDP while there is no causality between premium and GDP.
What are the policy implications of these findings? One, in the long run development of the insurance sector will have positive impact on economic growth. This suggests that Government should provide appropriate environment for insurance business to grow. Two, low rate of inflation will impact positively on economic growth in Nigeria. This suggests that government should implement monetary and fiscal policies to reduce the rate of inflation in Nigeria. Three, reduction in the rate of interest will lead to increased growth rate with possible positive effect on insurance development. Government should continue to pursue the policy of low interest rate in the country.
7. LIMITATIONS TO THE STUDY
This study only uses insurance premium as a measure of insurance development. There is the need to develop a more comprehensive measure of insurance development using the principal component analysis. This of course constitutes an area of future research
REFERENCES
1. Arena, M. (2008). Does Insurance Market Activity Promote Economic Growth? A Cross-country Study of industrialized and Developing Countries, Journal of Risk and Insurance, Vol. 75, Pp. 921-946. 2. Barro, R. J. and Sala-I-Martin, X. (1995). Economic Growth. New York: McGraw Hill, Inc.
3. Beck, T. and Webb, I. (2002). Economic, Demographic and institutional Determinant of Life Insurance Consumption across Countries, World Bank and International Insurance association.
5. Campbell, J. Y and Perron, P. (1991). Pitfall and opportunities: what macroeconomics should know about unit roots. In NBER Macroeconomics Annual, Blanchard and Fishers eds., 141-201. Cambridge, MA: MIT Press.
6. Catalan, M., Impavido, G. and Musalem, A. (2000). Contractual Savings or Stock Market Development: Which Leads? Policy research Paper Nr.2421, World Bank, Washington.
7. Central Bank of Nigeria Statistical Bulleting (2007).
8. Ching, K.S., Kogid, M. and Furuoka,F. (2010). Causal relation between life insurance funds and economic growth: evidence from Malaysia, ASEAN Economic Bulletin, August.
9. Dickey, D. A. and Fuller, W. A. (1979). Distribution of estimators for autoregressive time series with a unit root. Journal of American Statistical Association 74, 427-431.
10. Dickey, D. A., Fuller, W. A. (1981). Likelihood ratio statistics for autoregressive time series with a unit root. Econometrica, 49, 1057-1072.
11. Engle, R.F. and Granger C.W.J. (1987). Cointegration and Error Correction: Representation, Estimation and Testing. Econometrica, 55(2), 251-276.
12. Esho, N., Kirievsky, A., Ward, D., and Zubruegg, F. (2004). Law and the Determinant of Properties-Causality Insurance. The journal of Risk and Insurance, 71(2), 265-283, American Risk and Insurance Association.
13. Fatula, O. (2007). The Imperative of Recapitalization and Consolidation in the Nigerian Insurance Industry’ 1 (I&II) Ikeja Bar Review 128
14. Granger, C. and Newbold, P. (1974). Spurious regression in Econometrics. Journal of Econometrics, 2, 111-120.
15. Gujarati, D. (1995). Basic Econometrics. New York: Mcgraw-Hill.
16. Haiss, P. and Sumegi, K. (2008). The Relationship of Insurance and Economic Growth In Europe: A Theoretical and Empirical Analysis. Empirical, 35(4), 405-431.
17. Hussels, S., Ward, D. and Zurbruegg, R. (2005). Stimulating the Demand for Insurance. Risk
Management and Insurance Review, 8, 257-278.
18. Johansen, S. & Juselius, K. (1990). Maximum Likelihood Estimation and Inference on Co-integration – with Application to the Demand for Money, Oxford Bulletin of Economics and Statistics, 52, 169-210. 19. Kwiatkowski, D., Philips, C. B., Schmidt, P. and Shin, Y. (1992). Testing null hypothesis of
stationarity against the alternative of a unit root. Journal of Econometrics, 54, 159-178.
20. Kugler, M., and Ofoghi, R. (2005). Does Insurance Promote Growth? Evidence from the UK, Working paper, University of Southampton.
21. Ming,S. H., Yung,W. C. & Ting,Y. W. (2012). Does insurance demand or financial development promote economic growth? Evidence from Taiwan. Applied Economics Letters, 19(2), 105-111. 22. Nelson, C. R. and Plosser, C. I. (1982). Trend and random walks in macroeconomics time series; some
evidence and implications. Journal of Money Economics, 10, 139-162.
23. National Bureau of Statistics (Nigeria). Nigeria Annual Abstract of Statistics (2009). Abuja, Nigeria: National Bureau of Statistics (Nigeria).
24. National Insurance Commission (2010). Annual Report and Audited Account. 25. Osoka, O. (1992). Insurance and Nigeria Economy, Abiola Press Limited, Lagos.
26. Patrick, H.T. (1966). Financial Development and Economic Growth in Underdeveloped Countries.
Economic Development and Cultural Change, XXXXIV, 174-89.
27. Skipper, H. D. (2001). Insurance in the general agreement on trade in services (America Enterprise Institute).
28. Stock, J. H and Mark, W. W. (1988). Testing for common trends. Journal of America Statistical Association, 83, 1097-1107.
29. Uche, C. U and Chikeleze, B. E. (2001). Reinsurance in Nigeria: The Issue of Compulsory Legal Cession. The Geneva Papers on Risk and Insurance, 26(3), 490-504.
30. Ward, D. and Zurburegg, R. (2000). Does Insurance Promote Economic Growth? Evidence from OECD Countries. Journal of Risk and Insurance, 67(4), 489-506.