Asian J. Med. Biol. Res. 2015, 1 (3), 396-405; doi: 10.3329/ajmbr.v1i3.26445
Asian Journal of
Medical and Biological Research
ISSN 2411-4472 (Print) 2412-5571 (Online)www.ebupress.com/journal/ajmbr
Article
Formulation and evaluation of metformin HCl floating microspheres
Johura Ansary1*, Amit Kumar Chaurasiya1 and K. M. Bashirul Huq2
1
Department of Pharmacy, The University of Asia Pacific, Dhaka, Bangladesh
2
City Medical College, Gazipur, Bangladesh
*Corresponding author: Johura Ansary, Department of Pharmacy, The University of Asia Pacific, Dhaka, Bangladesh. E-mail: [email protected]
Received: 12 October 2015/Accepted: 03 November 2015/ Published: 30 December 2015
Abstract: The purpose of the present investigation was the preparation and evaluation of gastro-retentive
floating drug delivery system for anti-diabetic drug metformin hydrochloride that would retain the drug in stomach and continuously release the drug in controlled manner up to a predetermined time leading to improve bioavailability. The microspheres were prepared by oil-in-oil emulsion solvent evaporation technique using ethyl cellulose, methacrylic acid copolymer (Eudragit RS100, Eudragit RSPO and Eudragit RLPO). The dried floating microspheres were evaluated for percentage yield (%), actul drug content (%), drug entrapment efficiency, floating behavior, scanning electron microscopy and in vitro drug release studies. The microspheres were found spherical, porous and free flowing with a size range. Compatibility studies were performed by fourier transform infra-redand (FTIR) and differential thermal analysis (DTA) techniques. The DTA and FTIR data stated that drug and excipient were compatible. In-vitro release kinetics were studied in different mathematical release models following the zero order, Higuchi and Korsemeyer to find out the linear relationship and release rate of drug. The drug might be released by both diffusion and erosion as the correlation coefficient (R2) best fitted with Korsemeyer model and release exponent (n) was 0.45-0.89. In most cases good in vitro floating behavior was observed and a broad variety of drug release pattern was achieved by variation of the polymer which optimized to match target release profile. The developed floating microspheres of metformin hydrochloride may be used in clinic for prolonged drug release in stomach for at least 8 hrs, thereby improving the bioavailability and patient compliance.
Keywords: floating microspheres; metformin hydrochloride; ethyl cellulose; methacrylic acid copolymer; In
vitro release; bioavailability
1. Introduction
Diabetes is one of the major causes of death and disability in the world. The latest, WHO estimate for the number of people with diabetes worldwide, in 2000, is 171 million, which is likely to be at least 366 million by 2030. The focus of medical community is on the prevention and treatment of the disease, as is evident from the rising number of research papers every year on the subject(Patel et al., 2006). Floating drug delivery systems (FDDS) have a bulk density lower than gastric fluids and thus remain buoyant in the stomach for a prolonged period of time, without affecting the gastric emptying rate. While the system is floating on the gastric contents, the drug is released slowly at a desired rate from the system. After the release of the drug, the residual system is emptied from the stomach. This results in an increase in the GRT and a better control of fluctuations in the plasma drug concentrations. (Yeole and Khan, 2005; Gopalakrishnan and Chenthilnathan, 2011;Patil et al., 2010).
of riboflavin CR-GRDF is significantly enhanced in comparison to the administration of non-GRDF CR polymeric formulations (Gudis and Sakamoto, 2005). Gastro retentive dosage forms are designed to retain in the stomach for a prolonged time and release their active ingredients and thereby enable sustained and prolonged input of the drug to the upper part of the gastrointestinal tract (Garg and Gupta, 2008).
Oral controlled release drug delivery increases interest in pharmaceutical field to achieve improved therapeutic advantages, such as ease of dosing administration, patient compliance and flexibility in formulation (Nayak et al., 2010). After oral administration, drug delivery is retained in the stomach and release the drug in a controlled manner, so that the drug is supplied continuously to its absorption sites in the gastrointestinal tract (GIT). But oral sustained drug delivery formulations show some limitations connected with the gastric emptying time; variants and prompt gastrointestinal transit could result in incomplete drug release from the device into the absorption window leading to diminished efficacy of the administered dose (Streubel et al., 2003). To overcome these limitations several controlled oral drug delivery systems with prolonged gastric residence times including floating drug dosage systems is recently reported. (Baumgarter et al., 2000, Singh and Kim, 2000).
Metformin is an insulin-sensitizing, anti- diabetic drug from the Biguanide class of oral anti-hyperglycemic agent. Metformin HCl is 50-60% is a safe drug and it has a half-life of 1.5-3 hrs. It is not absorbed completely and poses low bioavailability problem. Almost 80-100% of the drug is excreted unchanged. The total daily requirement of metformin HCl is 1.5-3g, which leads to high incidence of GI side effects and toxicity .The slow but complete drug release in the stomach increase bioavailability of the drug as well its complete utilization which result in lower dose and GI side effects. Keeping the above facts in consideration the present study is performed with a view to formulate and evaluate floating microsphere of metformin hydrochloride in order to maintain a sustained drug concentration for longer period of time.
2. Materials and Methods 2.1. Sample collection
Metformin hydrochloride was a gift sample from Popular Parma, Bangladesh. Ethyl cellulose (14 cps), Eudragit RS-100, Eudragit RSPO and Eudragit RLPO were collected from Eskayef Bangladesh Limited, Bangladesh. Dichloromethane, ethanol, cyclohexen, sodium hydroxide, potassium dihydrogen phosphate, distilled water was collected from Pharmaceutics research lab. All other chemicals were of analytical grade.
2.2. Preparation of microsphere
Floating microspheres containing highly water-soluble metformin HCl were prepared by non-aqueous emulsion solvent evaporation method using ethyl cellulose, Eudragit RS100 Eudragit RLPO and RSPO. Some quantities of polymer (s) in combination of ethanol and dichloromethane were weighed at a ratio of 2:1 in a volumetric flask. Then appropriately weighed metformin HCl was added in the internal phase slowly and stirrer for 20-30 minutes. After proper mixing prepared polymeric phase was added drop wise to the external phase. The drug polymer mixture was then slowly introduced into 70 ml liquid paraffin previously emulsified with 1% Span 80, while stirring at 600 rpm held by the mechanical stirrer equipped with a three-blade propeller, at room temperature. The whole system was stirred for 3 hrs. The prepared microspheres were kept undisturbed for few minutes to allow settling. The settled microspheres are then washed several times with cyclo-hexen. The washed microspheres were dried in an oven at room temperature not exceeding 250C. The various batches of floating microspheres were prepared as follow and subsequently stored in desiccators over fused calcium chloride as shown in Table 1.
2.3. Determination of drug content
2.4. Determination of percentage yield
The prepared microspheres were collected and weighed. The measured weight was divided by the total amount of all non- volatile components which were used for the preparation of the microspheres. The yield percentage was determined with the following formula of Patel et al. (2009):
Weight of microspheres
Yield (%) = × 100
Total expected weight of drug and polymer
2.5.Estimation of drug entrapment efficiency (DEE)
Amount of drug entrapped in to the microspheres is determined by using the formula. (%) Yield
% Drug entrapment efficiency (DEE) = x100 Actual drug loaded
2.6. Buoyancy determination
The microspheres about (0.3 g) was weighed and were spread over the surface of USP dissolution type II apparatus which was filled with 900 ml of 0.1 N HCl containing 0.02% of Tween 80. The medium was agitated with a paddle rotating at 100 rpm. The floating and the settled portions of microspheres were recovered separately. The microspheres were dried and weighed. Buoyancy percentage was calculated as the ratio of the mass of the microspheres that remained floating and total mass of the microspheres (Debjit et al., 2009).
Weight of floating microspheres after time
Buoyancy (%) = X 100 Initial weigh of microspheres
2.7. In-vitro drug release study from metformin HCl loaded floating microspheres
In-vitro dissolution study was performed in a paddle type (Type II) dissolution apparatus. Weighed amount of microspheres containing 100mg drug was taken from each batch of formulation for dissolution purpose. Phosphate buffer of pH 6.8 was used as dissolution media, paddle speed was set at 100 rpm and temperature was maintained fixed at 37°C. The dissolution process was carried out for 8 hours and 5 ml dissolution sample from each dissolution media was withdrawn at a predetermined intervals of 1st hour, 2nd hour, 3rd hour, 4th hour, 5th hour, 6th hour, 7th hour and 8th hour. Each and every time 5 m1 of dissolution sample was compensated by fresh 5 m1 phosphate buffer (pH 6.8). Dissolution samples were withdrawn, filtered and taken in test tubes. The dissolution samples were then analyzed spectrophotometrically in a UV-VIS spectrophotometer at 233 nm. The dissolution studies were carried out in triplicate and then mean values were plotted as percentage cumulative drug release against time. The dissolution studies were repeated using 0.1 N HCI as dissolution medium.
2.8. Kinetics of drug release
To study the drug release kinetics, data obtained from in-vitro release were plotted in various kinetic models such as zero order equation, Higuchi kinetics and Korsmeyer– Peppas equation. If n value is 0.45 or less, the release mechanism follows “Fickian diffusion” and higher values of 0.45 to 0.89 for mass transfer follow a non-fickian model (anomalous transport). The drug release follows Higuchi model of drug release and case II transport if the n value is 0.89. For the values of n higher than 0.89, the mechanism of drug release is regarded as super case II transport. The model is used to analyze the release of pharmaceutical polymeric dosage forms when the release mechanism is not known or more than one type of release phenomenon was involved. The n value could be obtained from slop of the plot of log cumulative % of drug released Vs log time.
2.9.IR spectroscopy
2.10. Surface morphology
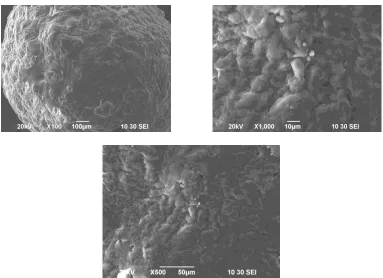
Surface nature of floating microspheres was examined with the help of Scanning Electron Microscope (JEOL, JSM-6490 LA, Japan).The floating microspheres were dried completely before examination SEM was done at different magnifications of 20 kV X 40, 20 kV X 100, 20 kV X 200, 20 kV X 500 to examine the surface picture and size of the microcapsules that changed from formula to formula.
2.11. Differential thermal analysis (DTA)
Differential thermal analysis or DTA is a thermo analytical technique in which the difference in the amount of heat required to increase the temperature of a sample and reference is measured as a function of temperature. The drug-polymer interaction was studied by DTA analysis. The crystallinity and amorphicity of individual components were further tested by differential Thermal Analysis (Seiko Japan. DSC model 6300). Sample were sealed in platinum pans and the DTA thermo grams were reported at a constant heating rate of 20ºC/ min over the temperature range of 20 to 600 ºC.
Table 1. Formulation table for floating microsphere of metformin HCl.
Formulation code Drug :
Polymer Drug (gm) EC (gm) EuRS 100 (gm) EuRSPO (gm) Eu RLPO (gm)
MF1 1:1 0.5 0.25 0.25 --- ---
MF2 1:3 0.5 1.00 0.50 ---- ---
MF3 1:5 0.5 1.50 1.00 ---- ---
MF4 1:1 0.5 ---- 0.25 ---
MF5 1:3 0.5 ---- 1.00 ---
MF6 1:5 0.5 ---- 1.50 ---
MF7 1:1 0.5 0.25
MF8 1:3 0.5 1.00
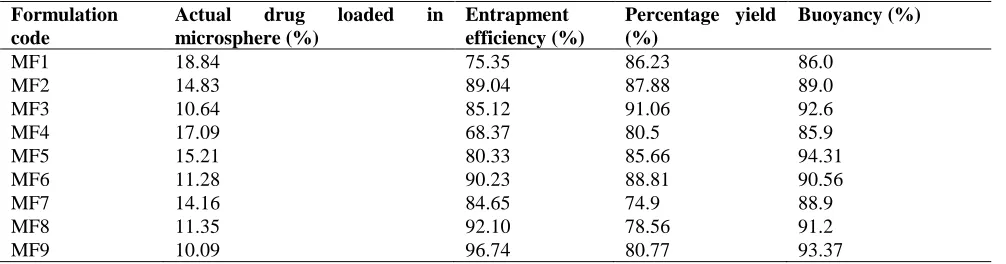
Table 2. Results on percentage yield, drug content (mg), drug loading in microsphere (mg) and entrapment efficiency (%).
Formulation code
Actual drug loaded in
microsphere (%)
Entrapment efficiency (%)
Percentage yield (%)
Buoyancy (%)
MF1 18.84 75.35 86.23 86.0
MF2 14.83 89.04 87.88 89.0
MF3 10.64 85.12 91.06 92.6
MF4 17.09 68.37 80.5 85.9
MF5 15.21 80.33 85.66 94.31
MF6 11.28 90.23 88.81 90.56
MF7 14.16 84.65 74.9 88.9
MF8 11.35 92.10 78.56 91.2
MF9 10.09 96.74 80.77 93.37
Table 3. Kinetic data for zero order, Higuchi and Korsmeyer peppas model.
Code Zero order Higuchi Korsmeyer Intercept
k0 R2 k R2 N R2
MF1 10.4 0.989 31.51 0.966 0.767 0.991 -0.76
MF2 9.537 0.961 29.16 0.976 0.689 0.976 -0.709
MF3 8.457 0.988 25.54 0.959 0.852 0.99 -0.929
MF4 8.793 0.983 26.47 0.959 0.735 0.986 -0.798
MF5 8.999 0.974 26.93 0.963 0.741 0.993 -0.784
MF6 7.961 0.916 26.47 0.919 0.483 0.992 -0.582
MF7 8.359 0.768 28.27 0.935 0.652 0.968 -0.734
MF8 9.119 0.948 26.93 0.963 0.736 0.991 -0.773
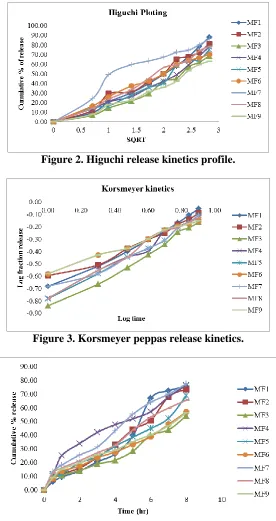
Figure 1.In-vitro release profile in 0.1 N HCl and zero order graph of metformin HCl microspheres.
Figure 2. Higuchi release kinetics profile.
Figure 3. Korsmeyer peppas release kinetics.
Figure 5. Scanning electron microscope (SEM) image of MF5 formulation.
Figure 6. Differential thermal analysis DTA of pure metformin HCl.
Figure 7. Differential thermal analysis DTA of metformin loaded microspheres formulation MF5.
Figure 8. FTIR spectra of pure metformin HCl.
3. Results and Discussion
3.1. Actual drug loaded and percentage yield
Actual drug loading and percentage yield of the prepared microspheres were carried and the results are summarized in Table 2. The range of actual drug loading varies from 10.64% to 18.84%. Percentage yield of different formulation was determined by weighing the microspheres after drying. The percentage yield of different formulation was in range of 74.90% to 91.06 %. Percentage yield increases with increasing polymer concentration in the formulation.
3.2. Drug entrapment efficiency (DEE)
Drug entrapment efficiency increases from 73.33 % to 96.74 % (Table 2) as polymer concentration increase respectively. When concentration of the polymer increased high viscosity and fast solidification of the dispersed phase contributed to reduce porosity of the micro particles as well. The contribution of a high polymer concentration to the loading efficiency can be interpreted in three ways. First, when highly concentrated, the polymer precipitates faster on the surface of the dispersed phase and prevents drug diffusion across the phase boundary. Second, the high concentration increases viscosity of the solution and delays the drug diffusion within the polymer droplets (Bodmeier and McGinity, 1988). Third, the high polymer concentration results large size of microspheres which result in loss of drug from surface during washing of microspheres is very less as compare to small microsphere.
3.3.Floating behaviour of microsphere
The purpose of preparing floating microspheres was to extend the gastric residence time of a drug. The microspheres were spread over the surface of a simulated gastric fluid and the fraction of microspheres buoyant and settled down as a function of time was quantities. Hollow Microspheres were dispersed in 0.1 HCl containing Tween 20 (0.02% w/v) to simulate gastric fluid. Eudragit polymer goes into solution forming pores on microspheres due to matrix erosion. This phenomenon makes the microspheres to float (Manish et al., 2012). Floating ability of different formulations was found to be differed according to drug polymer ratio. The percentage buoyancy for different formulation was found in range from 86.0% to 94.31% respectively as shown in Table 2. The buoyancy result indicates that all formulations floated for more than 12 hours over the surface of the dissolution medium without any apparent gelation. The microsphere showing lower densities influence buoyancy, and they were to be retained for longer than 12 hours, which helped in improving the bioavailability of Metformin Hcl Percentage buoyancy of prepared microspheres are high and showing Combination of E.C and Eudragit RSPO are good carrier for FDDS.MF5 formulation showed best appropriate balance between buoyancy and drug release rate.
3.4. In-vitro drug release study
Ideal property of floating microspheres includes high buoyancy and sufficient sustained release of drug in pH 6.8. Percent drug release rate of MF3, MF6 and MF9 (68.51%,70.22% and 63.02%) formulations in 8h, which is slow and incomplete drug release. In order to increases the percent drug release rate, decrease the ratio of Eudragit and ethyl cellulose MF1, MF4 and MF7 (87.97%, 78.13% and 86.19%) formulation shows high release rate with low buoyancy because of low polymer concentration (1:1). MF2 and MF8 (81.14% and 78.64%) shows sufficient sustained release with less buoyancy. MF5 formulation showed appropriate balance between buoyancy (94.31%) and drug release rate (74.81%), it may consider as a best formulation. The release profiles are shown in Figures 1, 2, 3 and 4. Different release profile were plotted to find out the best fitted models and to observe the release pattern of metformin HCl from the ethyl cellulose (EC) and Eudragit containing floating microspheres. Drug release pattern was evaluated in 0.1 N HCl and phosphate buffer pH 6.8. Eudragit RS100, Eudragit RSPO and Eudragit RLPO which is present in all formulation has low permeability in acid medium. Since Eudragit is less soluble in acidic pH, release of drug in 0.1 N HCl was generally low compared to phosphate buffer pH 6.8.
3.5. IR spectroscopy
IR spectra of metformin HCl alone and its combination with polymers are shown in Figures 8 and 9. An FT-IR spectrum of pure metformin HCl showed the peaks such as primary-amine (N-H) asymmetric stretching (3370.66cm−1), primary-amine (N-H) symmetric stretching (3292.55 cm−1), secondary-amine (N-H) symmetric stretching (3173.92 cm−1), primary-amine (N-H) bending (1629.88cm−1), C−H stretch (2813.23cm−1), C-H bending (1447.60), imines (C=N) stretching (1572.01 cm−1 ), C-N stretching (1166.95 cm−1 ). These peaks can be considered as characteristic peaks of metformin HCl which indicate there is no drug polymer incompatibility was observed.
3.6. Surface morphology
SEM studies has shown that particles made MF5 was spherical with a slight rough surface morphology as shown in Figure 5 and aggregated with small pores. The surface of the drug loaded microspheres manifested the presence of drug particles which is clearly visible from outside at high magnification. Pores present in the microspheres may be supposed to allow drug release from microspheres by the mechanism of surface erosion and diffusion (non-Fickian transport).
3.7. Differential thermal analysis (DTA)
The Physical state of drug inside the ethyl cellulose and Eudragit containing microspheres was assessed by thermal analysis. DTA has been one of the most widely used calorimetric techniques to characterize the physical state of drug in the polymeric matrix. Figures 6 and 7 depicts the DTA thermo gram of metformin HCL and formulation MF5 (metformin HCl, ethyl cellulose and Eudragit-RSPO) respectively. The DTA thermo gram of metformin exhibited a single sharp endothermic peak at 233°C corresponding to its melting transition temperature. The thermo gram of the formulation of formulation MF5 showed same melting point 235°C as pure metformin HCL endothermic peak of 233°C and no such characteristic peak, indicating that the drug was uniformly dispersed at the molecular level in microspheres and compatible with polymers.
4. Conclusions
From this study it is concluded that the formulation MF5 was a good formulation. Where the formulation was having 94.31% buoyancy with 8 hour control release or longer and would be capable of reducing the frequency of administration depending upon the formulation variable. All the formulations prepared by emulsion solvent evaporation were found to follow the Korsemeyer release mechanism. SEM studies the formulation was found in spherical nature. From FTIR study, there is no interaction between drug and polymer. From the DTA curves, the drug was found; there was not thermal change in formulations compared to pure metformin HCl which indicates that metformin HCl is compatible with the polymers. So, the formulation MF5 is more effective and it is concluded that the prepared floating microspheres of metformin HCl may prove to be potential candidate for safe and effective sustained drug delivery over an extended period of time which can reduce dosing frequency.
Conflict of interest
None to declare
References
Baumgarter S, J Kristl, F Vrecer, P Vodopivec and B Zorko , 2000. Optimization of floating matrix tablets and evaluation of their gastric residence time. Int. J. Pharm., 195: 125-135.
odmeier and c inity, 1998. olvent selection in the preparation of microspheres prepared by the solvent evaporation method. Int. J. Pharm., 43: 179-186.
Chein G and W Hao, 1998. In-vitro performance of floating sustained- release capsule of verapamil. Drug Dev. Ind. Pharm., 24: 1067-1072.
Debjit B, B Chiranjib, C Margret, B Jayakar and KP Sampath, 2009. Floating drug delivery system a review. Scholars Research Library, 1:199-218.
Garg R and GD Gupta, 2008. Progress in controlled gastro retentive delivery systems. Trop. J. Pharm. Res. , 7: 1055-1056.
Gudis K and C Sakamoto, 2005. The role of cyclooxygenase in gastric mucosal protection. Dig. Dis. Sci., 50:16–23.
Nayak K, R Maji and B Das, 2010. Gastro retentive drug delivery systems: a review. Asian J. Pharm. Clin. Res., 3: 1-10.
Patel A R, S Ram and S Thakur, 2006. In-vitro evaluation and optimization of controlled release floating drug delivery system of metformin hydrochloride. DARU Journal of Pharmaceutical Sciences, 2:57-64.
Patel MP, MM Patel, KM Patel, DR Patel and UL Patel, 2009. Designing and evaluation of microspheres of verapamil hydrochloride: effect of methocel. Research Journal of Pharmaceutical Dosage Forms and Technology, 1:22-28.
Singh BN and HK Kim, 2000. Floating drug delivery systems: an approach to oral controlled drug delivery via gastric retention. J. Control. Release , 63: 235-59.
Streubel A, J Siepmann and R Bodmeier, 2003. Multiple unit gastroretentive drug delivery systems: a new preparation method for low density microparticles. J. Microencapsul., 20: 329-347.