Original Research Article
Assessment of food insecurity and its correlates in a rural
community of Karnataka: a case study
Ankeeta Menona Jacob
1*, Dinesh Rajaram
2, Bhanu Manjunath
3,
Radhika Kunnavil
2INTRODUCTION
The World Food Summit 1996 identified food security as all individuals, always have physical and economic access to nutritious safe and sufficient food meeting their dietary needs and preferences for an active and healthy
life.1 For any country, food security forms a prerequisite
to sustainable, equitable economic development and also
is a critical factor for economic and social stability.2 The
domains of food security as defined by the food and agricultural organization (FAO) include food availability,
accessibility, utilization and stability.1 Food insecurity
thus is defined as the “limited or uncertain availability of nutritionally adequate and safe foods or limited or uncertain ability to acquire acceptable foods in socially
acceptable ways.”3 Food insecurity is complex and
multidimensional and is associated with poverty and low income, inadequacy in variety, quality and quantity of food. Household food insecurity (HFI) is one of the key determinants of chronic undernutrition in Indian children, especially among children living in resource-poor
settings.4 The only data survey that captures this
information from Indian settings is the National Sample
Survey Organization (NSSO).5 However due to scarce
data on the extent and severity of food insecurity in
ABSTRACT
Background: Food insecurity exists when people are undernourished due to the physical unavailability of food, lack of social or economic access to adequate food, and inadequate food utilization. As per FAO, India is home to 25% of world’s hungry population and 194.6 million undernourished people for the period of 2014-2016. The objectives were to assess the food insecurity and determine its correlates in a rural community of Karnataka.
Methods: A cross sectional study was undertaken to assess food insecurity and its correlates in households of a rural community of Karnataka using the “Household Food Insecurity Access Scale (HFIAS) for measurement of food access: Version 3” questionnaire during December 2014. The data collected was analyzed using SPSS version 20.0 and mean, proportion and chi-square were calculated as appropriate.
Results: The average HFIAS score was as low as 4.15. 80.8% of the 52 households were food insecure, of which 17.3% were mildly insecure, 48.1% were moderately insecure and 15.4% were severely food insecure.
Conclusions: With 80.8% food insecurity in the rural agriculture-based community, there is a need for improvements in stability, accessibility and utilization of available food through use of fair price shops and garden kitchen promotion.
Keywords: Food security, HFIAS version 3, Rural households, Public distribution system
Department of Community Medicine, 1K.S. Hegde Medical Academy, NITTE (Deemed to be University),
Nithyananda Nagar, Deralakatte, Mangaluru, 2M. S. Ramaiah Medical College, MSRIT Post, MSR Nagar, Bangalore,
Karnataka, India
3
Former Assistant Professor,M. S. Ramaiah Medical College, MSRIT Post, MSR Nagar, Bangalore, Karnataka, India
Received: 15 September 2018
Accepted: 04 October 2018
*Correspondence:
Dr. Ankeeta Menona Jacob, E-mail: [email protected]
Copyright: © the author(s), publisher and licensee Medip Academy. This is an open-access article distributed under the terms of the Creative Commons Attribution Non-Commercial License, which permits unrestricted non-commercial use, distribution, and reproduction in any medium, provided the original work is properly cited.
Indian households, the underlying causes for food
insecurity are not yet fully understood.5 There is also a
need to identify links between household food security and nutrition which is necessary for realization of sustainable development goal 2 to end poverty and
malnutrition in all its forms.6
Need for the study
India is home to 190.7 million undernourished people and
has 24.3% prevalence of food inadequacy as per FAO.7
Hence this study was undertaken to assess the food insecurity and determine its correlates among a rural community of Karnataka. The objectives of the study were to estimate the prevalence of household food insecurity (access) prevalence and determine its correlates in a rural community of Karnataka.
METHODS
A cross-sectional study was conducted in the rural field practice area of M. S. Ramaiah Medical College and Hospitals, Bangalore in the month of December 2014.
Method of data collection
The unit of study was a Household, which was defined as – individuals who sleep under the same roof and take
meals together at least four days in a week.8 This was
conducted by convenient sampling of households where the questions were directed to the person involved in preparation of meals and who was available for interview after giving written informed consent. After obtaining ethical clearance for this study, a pre-tested semi-structured questionnaire was used to collect information on demographic details like age, gender, family composition, socio- economic status as per modified B G Prasad classification and details of procurement of food grains grown by self per annum and the fair price shops. The Household Food Insecurity Access Scale (HFIAS) for measurement of food access: version 3. It contains 9 questions on food insecurity which was used to collect the data of the past 4 weeks (30 days) with questions relating to anxiety and uncertainty about the household food supply, insufficient quality (includes variety and preferences of the type of food), insufficient food intake
and its physical consequences.8 This scale has been
validated in India.9 The interview was conducted using
the Kannada translation of the questionnaire. Back translation to English was done to ensure linguistic validity of the Household Food Insecurity Access Scale (HFIAS) for measurement of food access: version 3. The questions were asked to the respondent whether the above conditions had happened rarely (once or twice), sometimes (three to 10 times), or whether they occurred often (more than 10 times) in the past 30 days. Any individual of the household involved in decision making or preparation with respect to food available for interview were interviewed. The responses on the nine items having 3 important dimensions mainly anxiety and uncertainty
(question 1), insufficient quality (questions 2-4) and insufficient food intake and its physical consequences (questions 5–9), The households with minimum score food access insecurity score 0 were considered most food access secure and households with maximum score of 27 were considered most food access insecure households. All households unavailable in the village after 3 consecutive visits were excluded from the study.
The sample size was calculated based on study conducted in rural Gujarat by Dand et al in 2006, Food insecurity was found to be 73.66%, thus expecting similar results at 12% absolute precision and 95% confidence level, sample size was estimated to be 52 households using N
master software version 2.0.10 The qualitative variables
such as religion, socio-economic status as per Modified and updates B G Prasad classification, type of family, social group, staple food, details of food procurement from the public distribution systems, domains of the Household Food insecurity access scales, degree of food security were expressed in terms of percentages and proportions. The quantitative variables of monthly income, family size, weight of grains procured through public distribution system (PDS), Household Insecurity Access score were expressed in terms of median and interquartile range [IQR]. The association with socio-demographic characteristics of the study population like family size, below poverty card holders, availing Public Distribution System, staple food and food security access prevalence conditions and domains were assessed using chi-square test, and the correlation of the study variables and the household food insecurity access domains and scores was done using spearman’s correlation.
RESULTS
Of the 52 individuals from 52 households interviewed 51 (98.1%) were Hindus, 32 (61.5%) belonged to nuclear families, and 20 (38.5%) belonged to non- nuclear families. 13 (25.0%) belonged to scheduled caste, 12 (23.1%) belonged to scheduled tribe and 27 (51.9%) belonged to others. The median monthly income of the study population was Rs. 6000/-. As per the modified B G Prasad Classification- 20 (38.5%) belonged to lower middle, 17 (32.7%) belonged to poor and 15 (28.9%) belonged upper middle and above class of socio-economic status. The median family size was 4.5[4.0-5.0]
Of the 52 households 42 (80.8%) were below poverty line card holders (BPL) and 32 (61.5%) availed food grains at a subsidized rate from the public distribution system. The staple food of majority of the households was Ragi 40 (76.9%) and 12 (23.1%) consumed rice as staple food. The average per-capita rice availed from public distribution system (PDS) per month was 4.9±2.1 kg. The average per-capita wheat availed from PDS per month was 0.86±0.5 kg.
Table 1: Source of food grains of the study population.
Source Frequency
n (%)
Self 24 (46.2)
Public distribution system 7 (13.5)
Multiple sources (self, PDS, Anganwadi) 18 (34.6)
Barter system 3 (5.8)
Total 52 (100)
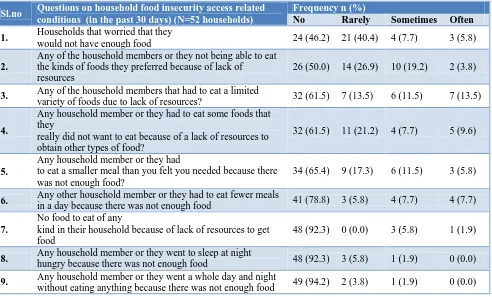
The results of household food insecurity access scale questions are shown in the table (Table 2).
Based on these questions the household food insecurity access related domains were estimated for the following parameters as shown in the table (Table 3).
The scores for each of these domains were computed and the median household insecurity access score was 5.0 (3.0-6.0). The household food insecurity access
Prevalence was calculated and depicted in the following figure (Figure 1). Using the household food insecurity access prevalence, the number of households which were food insecure was found to be 42 (80.8%).
Figure 1: Household food insecurity access prevalence in the study population.
Table 2: Household food insecurity access related conditions using the household food insecurity access related scale (version 3) response in the study population.
Sl.no Questions on household food insecurity access related
conditions (in the past 30 days) (N=52 households)
Frequency n (%)
No Rarely Sometimes Often
1. Households that worried that they
would not have enough food 24 (46.2) 21 (40.4) 4 (7.7) 3 (5.8)
2.
Any of the household members or they not being able to eat the kinds of foods they preferred because of lack of
resources
26 (50.0) 14 (26.9) 10 (19.2) 2 (3.8)
3. Any of the household members that had to eat a limited
variety of foods due to lack of resources? 32 (61.5) 7 (13.5) 6 (11.5) 7 (13.5)
4.
Any household member or they had to eat some foods that they
really did not want to eat because of a lack of resources to obtain other types of food?
32 (61.5) 11 (21.2) 4 (7.7) 5 (9.6)
5.
Any household member or they had
to eat a smaller meal than you felt you needed because there was not enough food?
34 (65.4) 9 (17.3) 6 (11.5) 3 (5.8)
6. Any other household member or they had to eat fewer meals
in a day because there was not enough food 41 (78.8) 3 (5.8) 4 (7.7) 4 (7.7)
7.
No food to eat of any
kind in their household because of lack of resources to get food
48 (92.3) 0 (0.0) 3 (5.8) 1 (1.9)
8. Any household member or they went to sleep at night
hungry because there was not enough food 48 (92.3) 3 (5.8) 1 (1.9) 0 (0.0)
9. Any household member or they went a whole day and night
without eating anything because there was not enough food 49 (94.2) 2 (3.8) 1 (1.9) 0 (0.0)
Table 3: Household food security access related domains.
Type of food insecurity access (N=52 households) Frequency n (%)
Food insecure Food secure Anxiety and uncertainty about the household food supply 28 (53.8) 24 (46.2)
Percent of households with insufficient food quality referring to insufficient quality (includes variety and preferences of the type of food)
Sufficient quality 15 (28.8) 37 (71.2)
Sufficient quantity 24 (46.2) 28 (53.8)
48.1
19.2 17.3
15.4
0 10 20 30 40 50 60
MODERATELY FOOD INSECURE
FOOD SECURE MILDLY FOOD INSECURE
SEVERE FOOD INSECURE
Preva
lence
o
f
ho
useho
ld f
o
o
d
insecurity
a
ccess(
in
percentag
e)
The association with socio-demographic characteristics of the study population like family size, below poverty card holders, availing public distribution services, staple food and food security access prevalence conditions and domains were assessed using chi-square test and spearman’s correlation test, but none of them was found to be associated significantly.
DISCUSSION
Study conducted in rural Aligarh, Uttar Pradesh by Ali, Rehman, Husain showed that though the public distribution system (PDS) was in place and individuals had below poverty line (BPL card) about 21% of them did not avail the facilities whereas present study showed that of the 20 (38.5%) household that did not avail PDS about 13 (31.0%) of them possessed BPL card and yet did not use the public distribution systems for food grains and this accounted for 17 (40.5%) of the food insecurity
experienced.11 The present study also found that even
after obtaining food grains from Public distribution system 25 (78.1%) were food insecure which was found to be highest among Class V (poor) accounting for 14 (33.3%) of the households. The study of food security measures in this rural community of Karnataka showed 28 (53.8)% of the houses were anxious and experienced uncertainty about the household food supply, when compared to study conducted by Virginia et al in a rural community in Allahabad, Uttar Pradesh by Virgina et al which showed that 81.6%, and had similar experience in the present study, households that had insufficient quality and quality were about 15 (28.8%) and 24 (46.2%) when compared to 45.6% experiencing insufficient quality and 21% insufficient quantity in the study conducted at
Allahabad.12
When comparing present study results to the results seen in a study conducted by Ntwenya et al showed in 21.6% rural Tanzania and similar results were seen in present study settings also 19.2% the present study results were also comparable to the household food security access study conducted by Chinakali et al in a urban resettlement colony of South Delhi which showed that of the 250 households interviewed 77.2% were food insecure when compared to the present study which
showed 80.8%.13,14
However higher levels of severely food insecure were seen in present study 15.4% compared to 9.2% in the urban resettlement colony of South Delhi which could be attributed to the differences in determinants of food security in urban and rural areas. The limitations of the study were due to this study being conducted during the day, where most of these community members used to go to work in the field, many of the households were not available for interview which could have affected the validity of the results. The use of purposive sampling could also have affected the present study results. A larger sample size would improve the precision of the study results. The bias due to convenient sampling
because of generalizability and validity of the study results.
CONCLUSION
The present study revealed that one-fifth of the households were food secure and most of the food insecure households belonged to Class IV and Class V socio-economic class as per Modified B G Prasad’s classification. Among the food insecure household’s half of them availed food grains from the Public distribution system. The association of family size, below poverty card holders, availing Public distribution services, staple food and food security access prevalence scale and domains were however not found to be statistically significant.
Recommendations
The study can be conducted in a larger number of households and correlates of the food insecurity could be determined. Further, households that experienced food insecurity even though they were BPL card holders can be made aware of schemes in Public Distribution Systems. Many of the households that experienced food insecurity had staple food of Ragi which was not available in the Public Distribution System. Hence Public Distribution System could be made more sensitive to the type of food grains consumed by the people.
ACKNOWLEDGEMENTS
The authors acknowledge the contributions of the students who attended community orientation programme held between December 2014-January 2015.
Funding: No funding sources Conflict of interest: None declared
Ethical approval: The study was approved by the Institutional Ethics Committeeof M S Ramaiah Medical College, Bangalore
REFERENCES
1. Food Security- Policy Brief. Rome: Food &
Agriculture organization; 2006: 1-4. Available at: http://www.fao.org/fileadmin/templates/faoitaly/doc uments/pdf/pdf_Food_Security_Cocept_Note.pdf. Accessed on 25 May 2018.
2. Parvathi C, Arulselvam K. A Situational Analysis of
Agricultural Production and Food Security in India. Res World. 2013;4(1):95.
3. Kodyalamoole NK, Kundapur R, Udaykiran N,
Badiger S. Food Security and nutrition consumption among households in the semi-urabn field practise area of K S Hegde Medical Academy, Mangalore: A Pilot study. Nitte Univ J Health Sci. 2015;5(2):31– 7.
4. Internal Validity and Reliability of
from India. Available from: http://poshan.ifpri. info/2016/02/08/internal-validity-and-reliability-of- experience-based-household-food-security-scales-evidence-from-india/. Accessed on 28 May 2018.
5. Sethi V, Maitra C, Avula R, Unisa S, Bhalla S.
Internal validity and reliability of experience-based household food insecurity scales in Indian settings. Agric Food Secur. 2017;6(1):1.
6. FAO, editor. Building resilience for food and food
security. Rome: FAO; 2017: 117. (The state of food security and nutrition in the world).
7. Food and Agriculture Organization. State of food
insecurity in the world 2015. Food & Agriculture Org; 2015.
8. Coates J, Swindale A, Bilinsky P. Household Food
Insecurity Access Scale (HFIAS) for Measurement of Food Access: Indicator Guide VERSION 3. Food and Nutrition Technical Assistance III Project (FANTA); 2007.
9. Psaki S, Bhutta ZA, Ahmed T, Ahmed S, Bessong
P, Islam M, et al. Household food access and child malnutrition: results from the eight-country MAL-ED study. Popul Health Metr. 2012;10(1):24.
10. Chakravarty SA, Dand S. Food Insecurity in
Gujarat: A Study of Two Rural Populations. Econ Polit Wkly. 2006;41:2248–58.
11. Ali M, Rehman H, Husain SM. Status of food
insecurity at household level in rural India: A case study of Uttar Pradesh. Int J Phys Soc Sci. 2012;2(8):227–44.
12. Virginia P, Singh P, Neda S. Assessment of
household food insecurity among the rural population of Allahabad District. Int J Home Sci. 2016;2(2):353–5.
13. Ntwenya J, Kinabo J, Msuya J, Mamiro P, Mamiro
D, Katalambula L. Household food insecurity and associated factors in rural communities: A case of Kilosa District, Tanzania. Afr J Agric Res. 2015;10(52):4783–94.
14. Chinnakali P, Upadhyay RP, Shokeen D, Singh K,
Kaur M, Singh AK, et al. Prevalence of Household-level Food Insecurity and Its Determinants in an Urban Resettlement Colony in North India. J Health Popul Nutr. 2014;32(2):227–36.
Cite this article as: Jacob AM, Rajaram D, Manjunath
B, Kunnavil R.Assessment of food insecurity and its
correlates in a rural community of Karnataka: a case study. Int J Community Med Public Health