Abstract—Domain specific modelling (DSM) is used typically on various computer application domains to alleviate application programming by altering error prone text editing work to graphical modelling and code generation. One rather different domain is design space exploration of embedded computer systems which composes greatly from complex programming phases resulting abstract application and platform models needed in system simulations. Objective of this paper is to show that the advantages of DSM can be harnessed perfectly well to this engineering domain. Previously has been shown that with a little pinch of imagination the concept of DSM can be applied on virtual system modelling phases. In this paper we describe how DSM tool and domain specific language are applied to practical exploitation of virtual system model, i.e. to performance simulation and analysis of simulation results. We share also pros and cons from explored appliance of DSM for performance exploration which according our research is valid method.
Index Terms—Back-annotation, embedded system, DSM, performance exploration, simulation, virtual system.
I. INTRODUCTION
Interactive mobile devices are nowadays everywhere and they are capable for running impressive multimedia applications. Trend is that application complexity increase continues like it has done many years. Expectations towards new gadgets, on which the applications of future are used, are therefore high. Because of the increasing application complexity it is easy to figure out that complexity of embedded system computing architecture increases also rapidly. Application complexity and computing architecture complexity are already difficult issues to cope for designers and the need for new ideas and design methods is continuously underlined and explored [1].
Complexity can be managed by developing new development methods which support future trends of applications and computing platforms. Applications are nowadays often multithreaded and parallel programming paradigms are under continuous exploration [2]. Application development framework which alleviates the multithreading and parallel programming challenges can be the way to enable the development of future applications. Domain specific modelling (DSM) is an intelligent application development methodology which has been adopted on
Manuscript received February 20, 2013; revised April 16, 2013. This work is supported by the European Commission, Tekes – the Finnish Funding Agency for Technology and Innovation, and VTT under the grant agreements ARTEMIS-2010-1-269362 PRESTO.
Janne Vatjus-Anttila is with the VTT Technical Research Centre of Finland, Oulu, FI-90571 Finland (e-mail: [email protected]).
various domains already and there is no reason for abandoning DSM during era of parallel programming.
In computing platform development, the network-on-chip architectures are explored and platform design methods should evolve towards their requirements. All in all the development of both software (SW) and hardware (HW) are going in a sense to same direction and certain correlations can be found from them. Still it seems that some similarities of these two engineering domains are not fully and utilised e.g. in the development tools. E.g. DSM and domain specific language (DSL) solutions could be utilised strongly also in HW development e.g. for VHDL and SystemC modelling [3].
SW development and platform development have their own characteristics, but they are also linked together because they support each other. The development work of SW and HW are different because of simple reasons. E.g. SW and HW development tools differ from each other and study programs to the SW and HW engineering domains are different in universities. However SW development is nowadays dependent of HW development and vice versa. This is because SW needs to be tested in early development phase on computer model of the HW. This is accomplished with simulations in which application or abstract model of application is executed on computer model of the target platform. Likewise the HW designs are tested with simulations by running applications on the computer models of the designed HW.
Computer simulations are effective way for exploring different features of platform design and modern design space exploration of embedded system is based on simulations. In order to run computer simulations simulator and simulation model of explored systems, which comprises from HW and SW descriptions, must be developed. The simulation model is piece of code written with suitable programming language, e.g. with SystemC. In other words making simulation model is programming task as well as writing piece of application code especially when simulation model modelling GUI is not available. This perception is important key for finding more similarity from application development and simulation model development. What helps programming of application can indeed help developing of the abstract application and platform models needed in simulation model design which supports the idea of using DSLs for design space exploration.
One obvious similarity between application and simulation model development tools is user interface that are not so different. Nowadays there are graphical user interfaces (GUI) for everything one can imagine. Designing of the GUIs has been done very easy with WYSIWYG GUI builder tools (what you see is what you get) [4]. Command line interfaces Janne Vatjus-Anttila
(CLI) are also used for various purposes like compiling which can’t be skipped in either application or simulation model development. Scripting is often used as supporting mean of CLI or as simulator interface. Integrated development environments (IDE) are highly configurable SW development frameworks which can be modified and used as wall to wall development environments in several application and platform design domains by utilising plugins that enable use of external tools in handy way from the IDEs [5]. DSL can also work as user interface in cases where DSL or hosting DSM tool enables running of external tools and pass data from design modelled with DSL to the external tools.
There have been few big revolutions in productivity of SW development [6]. Assembly was the programming language before C language. Object oriented language increased features of clause languages and UML started the era of graphical programming. DSM can be seen also as one revolution in the SW development methods. As well as it suits for application development it suits perfectly well also for developing simulation models for design space exploration which comprises greatly from programming tasks. This is why DSM suits also for performance exploration i.e. a form of design space exploration. ABSOLUT is a methodology and tool framework which has been developed for that purpose [7]. Recently a front-end comprising from DSLs has been prototyped for ABSOLUT modelling purposes [8].
The research of ABSOLUT and DSM integration has been continued towards practical exploration work where ABSOLUT methodology based virtual system is used for performance exploration with the domain specific front-end. With this paper we show how front-end has been upgraded to enable running of performance simulations and analysis of performance results. In addition, our approach for configuring sampling of the performance data and performance data back-annotation to the domain specific front-end is covered.
Following sections of paper enlarge on few relevant topics of our work. Section II reviews virtual system exploration front-end characteristics. In Section III, the potential of DSM in composing of exploration front-end is considered. Section IV presents the performance exploration front-end. Section V shows use example of performance simulation and exploration. Finally Section VI sums up conclusions.
II. VIRTUAL SYSTEM EXPLORATION FRONT-END
CHARACTERISTICS
Virtual system is a simulateable model of embedded system which comprises from abstract application model and abstract platform model where application is allocated on platform resources [9]. It can be used for producing simulation results by recording characteristics of the application execution or load of platform resources during simulation which after analysis can be used as guideline for improving of either application and/or platform i.e. for design space exploration. In ideal case the modelling and exploration work can be done with single development environment like CoFluent Studio [10]. The virtual system
modelling related characteristics were discussed in our former paper [8]. Rest of this section describes our outlook of virtual system front-end characteristics which relate to the exploration part.
ABSOLUT framework is a special design space exploration method and toolset for early phase performance exploration. Among others it enables generation of application workload models from application source code, modelling of transaction level platform from existing component models, making workload to platform allocations and running performance simulations which result information of many different performance matters. The modelling front-end for ABSOLUT prototyped in the first phase of our work is used basically for defining the virtual system simulation model and its configuration which is needed in order to make any exploration. The actual usage of ABSOLUT virtual system model has its own characteristics and understanding them helps to perceive requirements for simulation and exploration user interface.
The simulation procedure may require configuration in addition to the virtual system configuration. E.g. sample rate according which performance data is recorded is simulation parameter which must be selected in front-end. Badly chosen sample rate produces too coarse performance data and makes exploration according simulation results inaccurate.
ABSOLUT performance data recording contains built-in averaging. However second averaging controlled from front-end is required in order to adjust the amount of recorded data. And it is also good to include the possibility to select whether averaging is done during simulation or afterwards because the performance data may be observed either during or after the simulation.
ABSOLUT uses different performance probes and counters to record information. In this study only status probe that measures platform resource utilisation is observed. Status probe records 6 different performance metrics. It means that front-end should include possibility for filtering the irrelevant performance data and record only interesting metrics. This is another way to constrain amount of recorded data.During simulation ABSOLUT outputs performance information to terminal window. In addition to this visualisation of recorded performance data in front-end should be possible with exploration front-end. To enable this performance data back-annotation from simulation model to front-end is needed. Front-end should therefore include data visualisation diagrams and/or animation according received data.
III. POTENTIAL OF DSM FOR EXPLORATION FRONT-END
COMPOSITION
Basic use of DSM is defining and implementing of new DSLs which are basically graphical programming languages and DSLs are then used for developing applications e.g. for mobile devices. DSM is mostly done with DSM tools which provide handy way for developing new DSLs [11], commercial and free tool alternatives are available. The DSM tool applicability for something else than just developing DSLs or using these specific languages to develop the applications, depends of the possibility to interact with external tools from the DSM tool. This means running of external tools and different ways to request, receive, send and reply data. When external tools can be used e.g. by pressing button on the toolbar and output of external tool can be passed back to the used tool the DSM tool can be used to develop front-end DSLs for external tools.
MetaEdit+ 4.5 [12], tool developed by MetaCase is DSM tool which has interesting features for developing DSLs that can also work as modeling and/or exploration front-ends. External tools can be run from it and variety of data import and export means is provided. Its features enable many characteristics presented in Section II.
MetaEdit+ rererence language (MERL) is used for defining generators which can be used to start external programs and scripts. It enables also basic text file operations which can be used for basic data passing through files. MetaEdit+ contains also import and export features which can be used for reading data in or writing data out. Generators can be used manually and integrated also to objet symbols.
Tool hosts built-in SOAP server [13], which provides API that can be used from SOAP client for reading information from the object properties as well as writing new data to the properties. API includes also few commands for animation and updating of MetaEdit+ presentations. The client can be implemented with number of programming languages with existing open source libraries like gsoap for c/c++ [14]. MERL generator is handy way for running such client.
DSLs consists from objects which include properties and to these properties it is possible to pass all configuration information that is needed to configure the simulation, data recording, data filtering, data back-annotation, data visualisation, object animation etc.
Limitations of MetaEdit+ are in the simulation data visualisation features. Reason is that there is no real simulation data presentation support in the tool. But it is possible to compose objects and symbols for them that can work as histograms. It is possible to use single object as histogram or compose it from several objects. SOAP client takes care of the updating of histogram according data generated in simulation.
IV. MEDICINE–DSMTOOL FRONT-END FOR
PERFORMANCE EXPLORATION
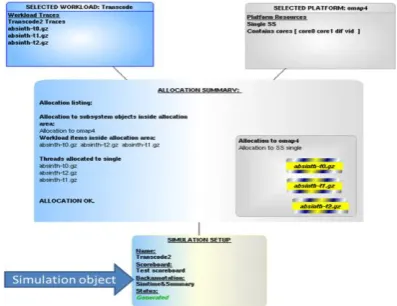
The ABSOLUT virtual system modelling front-end has been upgraded with some simulation and exploration features and front-end has been named to MEDICINE (MetaEdit+ interface for ABSOLUT design space exploration), Fig. 1. Time will tell how MEDICINE can alleviate the ABSOLUT
users in performance exploration but here we describe the new features of front-end that enable the front-end usage as performance exploration user interface.
Fig. 1. MEDICINE is extension of modelling front-end which enables also performance simulation and result analysis.
For now a special simulation or exploration front-end is not developed but the workload to platform allocation front-end is used as the user interface for defining the simulation and exploration configuration and running simulations. Front-end has been refined with Simulation object which gives Y-chart form for the diagram used on the front-end, Fig. 2.
Fig. 2. Y-chart that has been used to depict ABSOLUT in many contexts suits well also for the simulation user interface.
During writing this article, Simulation object included three properties: Simulation setup for naming the simulation, Backannotation for defining performance data back-annotation and Generation path to which simulation output generates from simulation.
The Backannotation property points to Backannotation object to allow reuse of the used back-annotation configuration. This object has Name property and Configuration property for the actual back-annotation configuration which is list of back-annotation configurations for platform resources of the virtual system.
The configuration defines the performance details that are back-annotated and the way they are visualised in MetaEdit+ and rest of performance data recorded by status probe is filtered. Example of back-annotation configuration for two processors is presented below:
Arm0:4:Bar:a: :Arm1:5:BarGroup:
SOAP has been used for back-annotation. MetaEdit+ API is used by SOAP client developed in the ABSOLUT status probe to pass the performance data. Client is also used to compose the visualisation histogram on MetaEdit+ diagram editor which visualises the performance data. Client must have ids of the correct back-annotation object so that it can fetch the back-annotation configuration. Current implementation passes the id information via text file but eventually after development is continued client can search the correct back-annotation configuration.
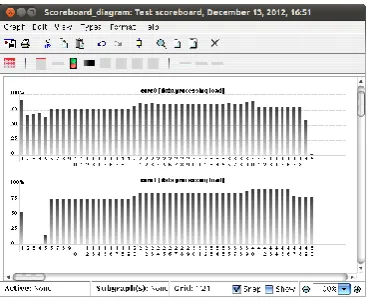
A special Scoreboard diagram has been added to MEDICINE front-end for performance data analysis. Histograms are automatically set and visualised here according back-annotation configuration and performance data passed the SOAP client. Scoreboard diagram can be used for both simulation time visualisations and summary visualisations after simulations. Example of ScoreBoard diagram is presented in Fig. 3. X-axis of histogram depicts sample number and Y-axis depicts percentage of capacity.
Fig. 3. Score board histograms are used for performance data visualisation.
After setting the needed configurations to the Simulation and Backannotation objects a performance simulation can be started by a click of Simulation button on MetaEdit+ toolbar. Simulation can be observed via textual output produced by ABSOLUT and via MEDICINE ScoreBoard diagram. After simulation the summary histogram of selected performance metrics is updated on same ScoreBoard diagram.
The development of MEDICINE simulation back-annotation and performance data visualisation features has not been burdensome and it can be continued. However, visualisation of performance data puts host machine in heavy load and extra loading is not good when complex system is being simulated. Therefore external simulation data visualisation tools should be explored especially for simulation time performance data visualisation. Back-annotation with SOAP instead works well and it can be used for other purposes like animation of the front-end elements according performance data.
V. LOAD OBSERVATION CASE WITH THE PERFORMANCE
EXPLORATION FRONT-END
The purpose of this demonstration is to indicate that the improvements made to MEDICINE can be used in ABSOLUT performance exploration. Demonstration consists of virtual system performance simulations implemented in VirtualBox Ubuntu image on Windows 7
host machine and comparison of recorded performance results. Focus is on the performance data back-annotation and visualisation produced on ScoreBoard diagram.
MEDICINE was used to model the virtual system platform and workload. Explored platform model is OMAP4 [15], which have been modelled with MEDICINE Platform Modelling Front-end. The platform model is simplified version of real OMAP4 and it is built from components of ABSOLUT component library. The workload for the case is generated from FFMPEG video codec package [16] with MEDICINE Workload Modelling Front-end, which utilises the ABSOLUT workload generation tool [17]. Workload was generated from transcoding use case where divx format video clip was decompressed and compressed to avi format. Single workload model and platform model can be used in the exploration case.
Adjusting of platform parameters can be used to produce differing performance results which are relevant for this demonstration. Other means to produce differing performance results are of course changing or altering of either used workload or platform model between simulations.
Fig. 4. Data processing load of performance simulation 1.
Fig. 5. Data processing load of performance simulation 2.
Two different simulations were executed and the differing simulation results are shown in figures Fig. 4 and Fig. 5. Histograms of the figures present data processing load of OMAP4 ARM cores. The difference results from adjusting of cycle per instruction (CPI) value of both ARM cores. In simulation 1 CPI value was 0.72 and in simulation 2 the CPI value vas 0.52. CPI values are invented just for this demonstration case. Adjusting of cache hit probabilities and latencies could have been used instead of adjusting CPI among other configuration alternatives. From resulted histograms we see that in simulation 2 the platform data processing load was lower than in simulation 1 which is correct because the CPI value is lower in simulation 2.
simulation time and in simulation 2 the average data processing load of ARM core0 was 70.1 % of the simulation time which verifies the result of histograms. Dropping of CPI values naturally changes the duration of simulation which can’t be seen from histograms because they are presentations of the recorded performance data and in both figures histograms comprises from 50 bars.
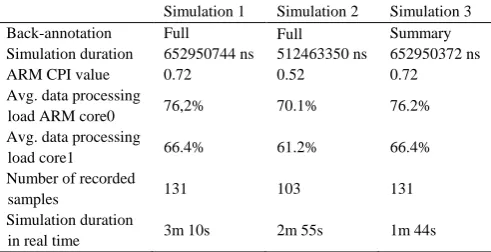
Table I summarises the demonstration results. Results validate the goodness of histogram visualisation accuracy when compared to the exact figures produced by ABSOLUT and show that performance data back-annotation with SOAP and performance data visualisation with MetaEdit+ can be used in performance exploration.
TABLE I: FILTERED RESULTS OF THREE PERFORMANCE SIMULATIONS Simulation 1 Simulation 2 Simulation 3
Back-annotation Full Full Summary
Simulation duration 652950744 ns 512463350 ns 652950372 ns
ARM CPI value 0.72 0.52 0.72
Avg. data processing
load ARM core0 76,2% 70.1% 76.2%
Avg. data processing
load core1 66.4% 61.2% 66.4%
Number of recorded
samples 131 103 131
Simulation duration
in real time 3m 10s 2m 55s 1m 44s
Table I includes also results from third simulation. In simulation 3, which is rerun of simulation 1, used back-annotation scheme was summary, which means that performance data was back-annotated back to MEDICINE once after simulation. Simulations 1 and 2 used back-annotation scheme full which in addition to the summary contains also simulation time back-annotation of performance data. This distinction causes the big difference of real time simulation duration between simulations 1 and 3. Running of simulation 1 takes as much as 86 seconds longer than running of simulation 3. Using of simulation time back-annotations clearly slows down simulation, in this case about 83%.
Reasons for slowdown can be found in both the SOAP client and SOAP server. The client in ABSOLUT status probe slows the simulation and the server slows down MetaEdit+ which in addition of interpreting the SOAP messages updates the histograms on ScoreBoard diagram. Conclusion from this observation is that used method is no good for simulation time back-annotation and performance data visualisation. By using averaging or extra filtering in client the simulation slowdown can be reduced. Other means for decreasing slow down are e.g. developing of histogram objects(s) or MetaEdit + API.
VI. CONCLUSION
In this paper the idea of exploiting of DSM and DSM tool for performance exploration was set in test. The ABSOLUT performance exploration front-end was upgraded during work. Simulation, back-annotation and visualization of performance data during and after simulation were under observation in the demonstration and result show that performance exploration can be done with the MEDICINE
front-end. Current implementation suits poorly for simulation time performance data back-annotation and visualization because of the significant simulation slowdown. MEDICINE can however be developed further towards exploration environment with some configurable IDE.
REFERENCES
[1] C. Driver, S. Reilly, É. Linehan, V. Cahill, and S. Clarke, “Managing embedded systems complexity with aspect-oriented model-driven engineering,”ACM Transactions on Embedded Computing Systems, vol. 10, no. 2, pp. 1-26, December 2010.
[2] M. Forsell and V. Leppänen, “An extended PRAM-NUMA model of computation for TCF programming,” in Proc. the 2012 IEEE 26th International Parallel and Distributed Processing Symposium
Workshops, IPDPSW 2012, Shanghai, pp. 786-793, May 2012.
[3] V. Štuikys and R. Damaševičius, “Meta-programming and model-driven meta-program development: Principles, processes and techniques (advanced information and knowledge processing),” Springer, August 22, 2012, pp. 66-74.
[4] W. O. Galitz, “The essential guide to user interface design: an introduction to GUI design principles and techniques,” in Wiley Desktop Editions Series, Third Edition, John Wiley & Sons, 2007, pp. 16-27.
[5] J. Rivieres and J. Wiegand, “Eclipse: a platform for integrating development tools,”IBM Systems Journal, vol. 43, no. 2, pp. 371-383, 2004.
[6] J. P. Tolvanen. Implementing Your Own Domain-Specific Modeling Languages: Hands-on. [Online]. Available: http://www.sigs.de/download/oop_2011/downloads/files/Mo4_Tolvan en_Implementing.pdf
[7] J. Kreku, M. Hoppari, T. Kestilä, Y. Qu, J-P. Soininen, P. Andersson, and K. Tiensyrjä, “Combining UML2 application and SystemC platform modelling for performance evaluation of real-time embedded systems,”EURASIP Journal on Embedded Systems, vol. 2008, pp. 1-18, January 2008.
[8] J. V. Anttila, J. Kreku, and K. Tiensyrjä, “Domain-specific front-end for virtual system modeling,” EIAC-RTESMA’12 / workshop on Graphical Modeling Language Development, Copenhagen, July 2-5, 2012.
[9] J. Borel, “European EDA Roadmap: Design Solutions for Europe,” in
MEDEA+/CATRENE Office, 6th Edition, March 2009, pp. 352.
[10] Cofluent Methodology for UML, UML SysML MARTE Flow for
CoFluent Studio, A CoFluent Design White Paper,2010, pp.19.
[11] A. E. Kouhen, C. Dumoulin, S. Gérard, and P. Boulet, “Evaluation of modeling tools adaptation,” hal-00706701, version 2 - 11, pp. 27, June 2012.
[12] MetaEdit+ Domain-Specific Modeling (DSM) environment. [Online]. Available: http://www.metacase.com/products.html
[13] R. M. Lerner, “At the forge: introducing SOAP,”Linux Journal, vol. 2001, no. 83es, Article No. 11, March 2001.
[14] R. A. V. Engelen and K. Gallivan, “The gSOAP toolkit for web services and peer-to-peer computing networks,” inproc. the 2nd IEEE International Symposium on Cluster Computing and the Grid
(CCGrid2002), Berlin, Germany, May 21-24, 2002, pp. 128-135.
[15] OMAP 4 Mobile Applications Platform. (2013). [Online]. Available: http://www.ti.com/product/omap4430
[16] About FFmpeg. [Online]. Available:http://ffmpeg.org/about.html [17] J. Kreku, “Early-phase performance evaluation of computer systems
using workload models and SystemC,” Ph.D. dissertation, University of Oulu Graduate School; University of Oulu, Faculty of Technology, Department of Computer Science and Engineering, 2012.
Janne Vatjus-Anttila received his M.Sc. (Tech.)