R E G U L A R A R T I C L E
Open Access
The emotional arcs of stories are
dominated by six basic shapes
Andrew J Reagan
1*, Lewis Mitchell
2, Dilan Kiley
1, Christopher M Danforth
1and Peter Sheridan Dodds
1*Correspondence:
1University of Vermont, 85 South
Prospect St, Burlington, VT 05405, USA
Full list of author information is available at the end of the article
Abstract
Advances in computing power, natural language processing, and digitization of text now make it possible to study a culture’s evolution through its texts using a ‘big data’ lens. Our ability to communicate relies in part upon a shared emotional experience, with stories often following distinct emotional trajectories and forming patterns that are meaningful to us. Here, by classifying the emotional arcs for a filtered subset of 1,327 stories from Project Gutenberg’s fiction collection, we find a set of six core emotional arcs which form the essential building blocks of complex emotional trajectories. We strengthen our findings by separately applying matrix decomposition, supervised learning, and unsupervised learning. For each of these six core emotional arcs, we examine the closest characteristic stories in publication today and find that particular emotional arcs enjoy greater success, as measured by downloads.
Keywords: stories; sentiment mining; narratology; language; society
1 Introduction
The power of stories to transfer information and define our own existence has been shown time and again [–]. We are fundamentally driven to find and tell stories, likened toPan NarransorHomo Narrativus. Stories are encoded in art, language, and even in the math-ematics of physics: We use equations to represent both simple and complicated functions that describe our observations of the real world. In science, we formalize the ideas that best fit our experience with principles such as Occam’s Razor: The simplest story is the one we should trust. We tend to prefer stories that fit into the molds which are familiar, and reject narratives that do not align with our experience [].
We seek to better understand stories that are captured and shared in written form, a medium that since inception has radically changed how information flows []. Without evolved cues from tone, facial expression, or body language, written stories are forced to capture the entire transfer of experience on a page. An often integral part of a written story is the emotional experience that is evoked in the reader. Here, we use a simple, robust sen-timent analysis tool to extract the reader-perceived emotional content of written stories as they unfold on the page.
We objectively test aspects of the theories of folkloristics [, ], specifically the common-ality of core stories within societal boundaries [, ]. A major component of folkloristics is the study of society and culture through literary analysis. This is sometimes referred to asnarratology, which at its core is ‘a series of events, real or fictional, presented to the
reader or the listener’ []. In our present treatment, we consider the plot as the ‘back-bone’ of events that occur in a chronological sequence (more detail on previous theories of plot are in Appendix A in Additional file ). While the plot captures the mechanics of a narrative and the structure encodes their delivery, in the present work we examine the emotional arc that is invoked through the words used. The emotional arc of a story does not give us direct information about the plot or the intended meaning of the story, but rather exists as part of the whole narrative (e.g., an emotional arc showing a fall in senti-ment throughout a story may arise from very different plot and structure combinations). This distinction between the emotional arc and the plot of a story is one point of misunder-standing in other work that has drawn criticism from the digital humanities community []. Through the identification of motifs [], narrative theories [] allow us to analyze, interpret, describe, and compare stories across cultures and regions of the world []. We show that automated extraction of emotional arcs is not only possibly, but can test previ-ous theories and provide new insights with the potential to quantify unobserved trends as the field transitions from data-scarce to data-rich [, ].
The rejected master’s thesis of Kurt Vonnegut - which he personally considered his greatest contribution - defines theemotional arcof a story on the ‘Beginning-End’ and ‘Ill Fortune-Great Fortune’ axes []. Vonnegut finds a remarkable similarity between Cin-derella and the origin story of Christianity in the Old Testament (see Figure S in Ap-pendix B in Additional file ), leading us to search for all such groupings. In a recorded lecture available on YouTube [], Vonnegut asserted:
‘There is no reason why the simple shapes of stories can’t be fed into computers, they are beautiful shapes.’
For our analysis, we apply three independent tools: matrix decomposition by singular value decomposition (SVD), supervised learning by agglomerative (hierarchical) cluster-ing with Ward’s method, and unsupervised learncluster-ing by a self-organizcluster-ing map (SOM, a type of neural network). Each tool encompasses different strengths: the SVD finds the underlying basis of all of the emotional arcs, the clustering classifies the emotional arcs into distinct groups, and the SOM generates arcs from noise which are similar to those in our corpus using a stochastic process. It is only by considering the results of each tool in support of each other that we are able to confirm our findings.
We proceed as follows. We first introduce our methods in Section , we then discuss the combined results of each method in Section , and we present our conclusions in Section . A graphical outline of the methodology and results can be found as Figure S in Appendix B in Additional file .
2 Methods
2.1 Emotional arc construction
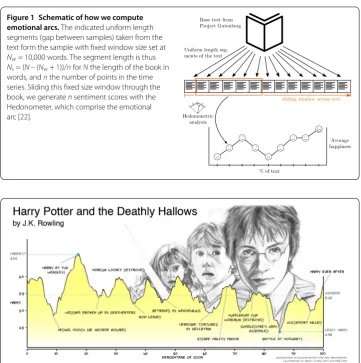
Figure 1 Schematic of how we compute emotional arcs.The indicated uniform length segments (gap between samples) taken from the text form the sample with fixed window size set at Nw= 10,000 words. The segment length is thus Ns= (N– (Nw+ 1))/nforNthe length of the book in words, andnthe number of points in the time series. Sliding this fixed size window through the book, we generatensentiment scores with the Hedonometer, which comprise the emotional arc [22].
Figure 2 Annotated emotional arc ofHarry Potter and the Deathly Hallows, by JK Rowling, inspired by the illustration made by Medaris for The Why Files [23].The entire seven book series can be classified as a ‘Kill the monster’ plot [24], while the many sub plots and connections between them complicate the emotional arc of each individual book: this plot could not be readily inferred from the emotional arc alone. The emotional arc shown here, captures the major highs and lows of the story, and should be familiar to any reader well acquainted with Harry Potter. Our method does not pick up emotional moments discussed briefly, perhaps in one paragraph or sentence (e.g., the first kiss of Harry and Ginny). We provide interactive
visualizations of all Project Gutenberg books at http://hedonometer.org/books/v3/1/ and a selection of classic and popular books at http://hedonometer.org/books/v1/.
sentences scores, it begets a basic misunderstanding of similar efforts []. In Figure , we show the emotional arc of Harry Potter and the Deathly Hallows, the final book in the popular Harry Potter series by JK Rowling. While the plot of the book is nested and complicated, the emotional arc associated with each sub-narrative is clearly visible. We analyze the emotional arcs corresponding to complete books, and to limit the conflation of multiple core emotional arcs, we restrict our analysis to shorter books by selecting a maximum number of words when building our filter. Further details of the emotional arc construction can be found in Appendix C in Additional file .
2.2 Project Gutenberg corpus
set of books that represent English works of fiction. We start by selecting for only En-glish books, with total words between , and ,, with more than downloads from the Project Gutenberg website, and with Library of Congress Class corresponding to English fiction.a To ensure that the -download limit is not influencing the results
here, we further test each method for , , , and download thresholds, in each case confirming the download findings to be qualitatively unchanged. Next, we re-move books with any word in the title from a list of keywords (e.g., ‘poems’ and ‘collection’, full list in Appendix C in Additional file ). From within this set of books, we remove the front and back matter of each book using regular expression pattern matches that match on .% of the books included. Two slices of the data for download count and the total word count are shown in Appendix C, Figure S in Additional file . We pro-vide a list of the book ID’s which are included for download in the Online Appendices at http://compstorylab.org/share/papers/reaganb/, the books are listed in Table S in Appendix D in Additional file , and we attempt to provide the Project Gutenberg ID when we mention a book by title herein. Given the Project Gutenberg IDn, the raw ebook is available online from Project Gutenberg at http://www.gutenberg.org/ebooks/n/,
e.g., Alice’s Adventures in Wonderland by Lewis Carroll, has ID and is available at http://www.gutenberg.org/ebooks//. We also provide an online, interactive version of the emotional arc for each book indexed by the ID,e.g.,Alice’s Adventures in Wonderland
is available at http://hedonometer.org/books/v//.
2.3 Principal component analysis (SVD)
We use the standard linear algebra technique singular value decomposition (SVD) to find a decomposition of stories onto an orthogonal basis of emotional arcs. Starting with the sentiment time series for each bookbias rowiin the matrixA, we apply the SVD to find
A=UVT=WVT, ()
whereUcontains the projection of each sentiment time series onto each of the right sin-gular vectors (rows ofVT, eigenvectors ofATA), which have singular values given along the diagonal of, withW=U. Different intuitive interpretations of the matricesU,, andVT are useful in the various domains in which the SVD is applied; here, we focus on right singular vectors as an orthonormal basis for the sentiment time series in the rows of
A, which we will refer to as themodes. We combineandU into the single coefficient matrixWfor clarity and convenience, such thatWnow represents the mode coefficients.
2.4 Hierarchical clustering
We use Ward’s method to generate a hierarchical clustering of stories, which proceeds by minimizing variance between clusters of books []. We use the mean-centered books and the distance function
D(bi,bj) =l– l
t=
bi(t) –bj(t) ()
2.5 Self-organizing map (SOM)
We implement a self-organized map (SOM), an unsupervised machine learning method (a type of neural network) to cluster emotional arcs []. The SOM works by finding the most similar emotional arc in a random collection of arcs. We use an × SOM (for nodes, roughly % of the number of books), connected on a square grid, training according to the original procedure (with winner take all, and scaling functions across both distance and magnitude). We take the neighborhood influence function at iterationias
Nbdk(i) =
j∈N|D(k,j) <√N·(i+ )α ()
for a nodekin the set of nodesN, with distance functionDgiven above and total number of nodesN. For results shown here we takeα= –.. We implement the learning adapta-tion funcadapta-tion at training iteraadapta-tioniasf(i) = (i+ )β, again withβ= –., a standard value
for the training hyper-parameters.
3 Results
We obtain a collection of , books that are mostly, but not all, fictional stories by using metadata from Project Gutenberg to construct a rough filter. We find broad support for the following six emotional arcs:
• ‘Rags to riches’ (rise).
• ‘Tragedy’, or ‘Riches to rags’ (fall). • ‘Man in a hole’ (fall-rise). • ‘Icarus’ (rise-fall).
• ‘Cinderella’ (rise-fall-rise). • ‘Oedipus’ (fall-rise-fall).
Importantly, we obtain these same six emotional arcs from all possible arcs by observing them as the result of three methods: As modes from a matrix decomposition by SVD, as clusters in a hierarchical clustering using Ward’s algorithm, and as clusters using unsuper-vised machine learning. We examine each of the results in this section.
3.1 Principal component analysis (SVD)
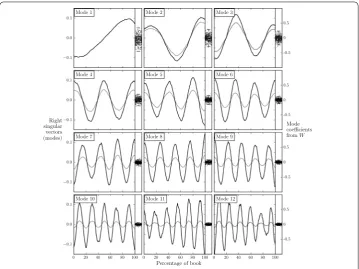
Figure 3 Top 12 modes from the singular value decomposition of 1,327 Project Gutenberg books.We show in a lighter color modes weighted by their corresponding singular value, where we have scaled the matrixsuch that the first entry is 1 for comparison (for reference, the largest singular value is 34.5). The mode coefficients normalized for each book are shown in the right panel accompanying each mode, in the range –1 to 1, with the ‘Tukey’ box plot.
We emphasize that by definition of the SVD, the mode coefficients inWcan be either positive and negative, such that the modes themselves explain variance with both the pos-itive and negative version. In the right panels of each mode in Figure we project the , stories onto each of first six modes and show the resulting coefficients. While none are far from (as would be expected), mode has a mean slightly above and both modes and have means slightly below . To sort the books by their coefficient for each mode, we normalize the coefficients within each book in the rows ofW to sum to , accounting for books with higher total energy, and these are the coefficients shown in the right panels of each mode in Figure . In Appendix E in Additional file , we provide supporting, intu-itive details of the SVD method, as well as example emotional arc reconstruction using the modes (see Figures S-S in Additional file ). As expected, less than modes are enough to reconstruct the emotional arc to a degree of accuracy visible to the eye.
Figure 4 First 3 SVD modes and their negation with the closest stories to each.To locate the emotional arcs on the same scale as the modes, we show the modes directly from the rows ofVTand weight the emotional arcs by the inverse of their coefficient inWfor the particular mode. The closest stories shown for each mode are those stories with emotional arcs which have the greatest coefficient inW. In parentheses for each story is the Project Gutenberg ID and the number of downloads from the Project Gutenberg website, respectively. Links below each story point to an interactive visualization on http://hedonometer.org which enables detailed exploration of the emotional arc for the story.
the most categorical tragedies we findLady Susan() andWarlord of Kor(,). Number in the sorted list of tragedies is perhaps the most famous tragedy:Romeo and Julietby William Shakespeare. Mode is the ‘Man in a hole’ emotional arc, and we find the stories which most closely follow this path to beThe Magic of Oz() andChildren of the Frost(,). The negation of mode most closely resembles the emotional arc of the ‘Icarus’ narrative. For this emotional arc, the most characteristic stories areShadowings
(,) andBattle-Pieces and Aspects of the War(,). Mode is the ‘Cinderella’ emo-tional arc, and includesMystery of the Hasty Arrow(,) andThrough the Magic Dorr
(,). The negation of Mode , which we refer to as ‘Oedipus’, is found most characteris-tically inThis World is Taboo(,),Old Indian Days(), andThe Evil Guest(,). We also note that the spread of the stories from their core mode increases strongly for the higher modes.
3.2 Hierarchical clustering
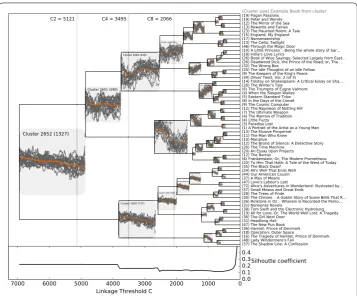
Figure 5 Dendrogram from the hierarchical clustering procedure using Ward’s minimum variance method.For each cluster, a selection of the 20 most central books to a fully-connected network of books are shown along with the average of the emotional arc for all books in the cluster, along with the cluster ID and number of books in each cluster (shown in parenthesis). The cluster ID is given by numbering the clusters in order of linkage starting at 0, with each individual book representing a cluster of size 1 such that the final cluster (all books) has the ID 2(N– 1) for theN= 1,327 books. At the bottom, we show the average Silhouette value for all books, with higher value representing a more appropriate number of clusters. For each of the 60 leaf nodes (right side) we show the number of books within the cluster and the most central book to that cluster’s book network.
distance to other books in the cluster (e.g., considering each intra-cluster collection as a fully connected weighted network, we take the most central node), and in parenthesis the number of books in that cluster. In other words, we label each cluster by considering the network centrality of the fully connected cluster with edges weighted by the distance be-tween stories. By cutting the dendrogram in Figure at various linkage costs we are able to extract clusters of the desired granularity. For the cuts labeled C, C, and C, we show these clusters in Figures S, S, and S in Additional file . We find the first four of our final six arcs appearing among the eight most different clusters (Figure S in Additional file ).
Figure 6 Results of the SOM applied to Project Gutenberg books.Left panel: Nodes on the 2D SOM grid are shaded by the number of stories for which they are the winner. Right panel: The B-matrix shows that there are clear clusters of stories in the 2D space imposed by the SOM network.
3.3 Self-organizing map (SOM)
Finally, we apply Kohonen’s self-organizing map (SOM) and find core arcs from unsu-pervised machine learning on the emotional arcs. On the two dimensional component plane, the prescribed network topology, we find seven spatially coherent groups, with five emotional arcs. These spatial groups are comprised of stories with core emotional arcs of differing variance.
In Figure we see both the B-matrix to demonstrate the strength of spatial clustering and a heat-map showing where we find the winning nodes. The A-I labels refer to the individual nodes shown in Figure S in Additional file , and we observe seven spatial groups in the both panels of Figure : () A and G, () B and I, () C, () D, () E, and () H, and () F. These spatial clusters reinforce the visible similarity of the winning node arcs, given that nodes H and F are close spatially but separated by the B-matrix and contain very distinct arcs. We show the winning node emotional arcs and the arcs of books for which they are the winners in Figure S in Additional file . The legend shows the node ID, numbers the cluster by size, and in parentheses indicates the size of the cluster on that individual node. In panels A and G we see varying strengths of the ‘Man in a hole’ emotional arc. In panels B and I, the second largest individual cluster consists of the ‘Rags to riches’ arcs. In panel C, and in panel F, we find the ‘Oedipus’ emotional arc, with a more pronounced positive start and decline in panel C. In panel D we see the ‘Icarus’ arc, and in panel E and panel H we see the ‘Tragedy’ arc. Each of these top stories are all readily identifiable, yet again demonstrating the universality of these story types.
3.4 Null comparison
Figure 7 Download statistics for stories whose SVD Modes comprise more than 2.5% of books, forN the total number of books andNmthe number corresponding to the particular mode.ModesSV3
through -SV4 (both polarities of modes 3 and 4) exhibit a higher average number of downloads and more variance than the others. Mode arcs are rows ofVTand the download distribution is show in log
10space from 20 to 30,000 downloads.
the English fiction Gutenberg Corpus with the null versions of each book and verify that the emotional arcs of real stories are not simply an artifact. The singular value spectrum from the SVD is flatter, with higher-frequency modes appearing more quickly, and in total representing % of the total variance present in real stories (see Figures S and S in Additional file ). Hierarchical clustering generates less distinct clusters with considerably lower linkage cost (final linkage cost , vs ,) for the emotional arcs from nonsense books, and the winning node vectors on a self-organizing map lack coherent structure (see Figures S and S in Appendix H in Additional file ).
3.5 The success of stories
To examine how the emotional trajectory impacts success, in Figure we examine the downloads for all of the books that are most similar to each SVD mode (for additional modes, see Figure S in Appendix B in Additional file ). We find that the first four modes, which contain the greatest total number of books, are not the most popular. Along with the negative of mode , both polarities of modes and have markedly higher median down-loads, while we discount the importance of the mean with the high variance. The success of the stories underlying these emotional arcs suggests that the emotional experience of readers strongly affects how stories are shared. We find ‘Icarus’ (-SV ), ‘Oedipus’ (-SV ), and two sequential ‘Man in a hole’ arcs (SV ), are the three most successful emotional arcs. These results are influenced by individual books within each mode which have high numbers of downloads, and we refer the reader to the download-sorted tables for each mode in Appendix E in Additional file .
4 Conclusion
Using three distinct methods, we have demonstrated that there is strong support for six core emotional arcs. Our methodology brings to bear a cross section of data science tools with a knowledge of the potential issues that each present. We have also shown that con-sideration of the emotional arc for a given story is important for the success of that story. Of course, downloads are only a rough proxy for success, and this work may provide an outline for more detailed analysis of the factors that impact meaningful measures of suc-cess,i.e., sales or cultural influence.
Extensions of our analysis that use a more curated selection of full-text fiction can an-swer more detailed questions about which stories are the most popular throughout time, and across regions []. Automatic extraction of character networks would allow a more detailed analysis of plot structure for the Project Gutenberg corpus used here [, , ]. Bridging the gap between the full text stories [] and systems that analyze plot sequences will allow such systems to undertake studies of this scale []. Place could also be used to consider separate character networks through time, and to help build an analog to Randall Munroe’s Movie narrative charts [].
We are producing data at an ever increasing rate, including rich sources of stories writ-ten to entertain and share knowledge, from books to television series to news. Of profound scientific interest will be the degree to which we can eventually understand the full land-scape of human stories, and data driven approaches will play a crucial role.
Additional material
Additional file 1: Supplementary material (as Appendices A-H).(pdf )
Competing interests
The authors declare that they have no competing interests.
Authors’ contributions
All authors contributed equally to the writing of this paper. All authors read and approved the final manuscript.
Author details
1University of Vermont, 85 South Prospect St, Burlington, VT 05405, USA.2University of Adelaide, Adelaide, SA 5005,
Australia.
Acknowledgements
PSD and CMD acknowledge support from NSF Big Data Grant #1447634.
Endnote
a The specific classes have labels PN, PR, PS, and PZ.
Received: 2 July 2016 Accepted: 26 October 2016
References
1. Pratchett T, Stewart I, Cohen J (2003) The science of Discworld II: the globe. Ebury Press, London 2. Campbell J (2008) The hero with a thousand faces, 3rd edn. New World Library, Novato 3. Gottschall J (2013) The storytelling animal: how stories make us human. Mariner Books, New York 4. Cave S (2013) The 4 stories we tell ourselves about death.
http://www.ted.com/talks/stephen_cave_the_4_stories_we_tell_ourselves_about_death 5. Dodds PS (2013) Homo narrativus and the trouble with fame. Nautilus magazine.
http://nautil.us/issue/5/fame/homo-narrativus-and-the-trouble-with-fame
6. Nickerson RS (1998) Confirmation bias: a ubiquitous phenomenon in many guises. Rev Gen Psychol 2:175-220 7. Gleick J (2011) The information: a history, a theory, a flood. Pantheon, New York
8. Propp V (1968) Morphology of the folktale (1928). University of Texas Press, Austin
9. MacDonald MR (1982) Storytellers sourcebook: a subject, title, and motif index to folklore collections for children. Gale Group, Farmington Hills
10. da Silva SG, Tehrani JJ (2016) Comparative phylogenetic analyses uncover the ancient roots of Indo-European folktales. R Soc Open Sci 3(1):150645. doi:10.1098/rsos.150645.
http://rsos.royalsocietypublishing.org/content/3/1/150645.full.pdf
11. Min S, Park J (2016) Narrative as a complex network: a study of Victor Hugo’s Les Misérables. In: Proceedings of HCI Korea
12. Jockers M (2014) A novel method for detecting plot.
http://www.matthewjockers.net/2014/06/05/a-novel-method-for-detecting-plot/ 13. Dundes A (1997) The motif-index and the tale type index: a critique. J Folklore Res 34:195-202 14. Dolby SK (2008) Literary folkloristics and the personal narrative. Trickster Press, Bloomington
15. Uther H-J (2011) The types of international folktales. A classification and bibliography. Based on the system of Antti Aarne and Stith Thompson. Part I. Animal tales, tales of magic, religious tales, and realistic tales, with an introduction. FF communications, vol 284. Finnish Academy of Science and Letters, Helsinki
17. Moretti F (2013) Distant reading. Verso, New York
18. Vonnegut K (1981) Palm sunday. RosettaBooks LLC, New York
19. Vonnegut K (1995) Shapes of stories. https://www.youtube.com/watch?v=oP3c1h8v2ZQ
20. Reagan A, Tivnan B, Williams JR, Danforth CM, Dodds PS (2015) Benchmarking sentiment analysis methods for large-scale texts: a case for using continuum-scored words and word shift graphs. arXiv:1512.00531
21. Ribeiro FN, Araújo M, Gonçalves P, Gonçalves MA, Benevenuto F (2016) SentiBench - a benchmark comparison of state-of-the-practice sentiment analysis methods. EPJ Data Sci 5(1):23. doi:10.1140/epjds/s13688-016-0085-1 22. Dodds PS, Harris KD, Kloumann IM, Bliss CA, Danforth CM (2011) Temporal patterns of happiness and information in a
global social network: hedonometrics and Twitter PLoS ONE 6(12):e26752. doi:10.1371/journal.pone.0026752 23. Tenenbaum DJ, Barrett K, Medaris SV, Devitt T (2015) In 10 languages, happy words beat sad ones.
http://whyfiles.org/2015/in-10-languages-happy-words-beat-sad-ones/
24. Booker C (2006) The seven basic plots: why we tell stories. Bloomsbury Academic, New York 25. Various (2010) Project Gutenberg. http://gutenberg.org
26. Ward JH Jr (1963) Hierarchical grouping to optimize an objective function. J Am Stat Assoc 58(301):236-244 27. Kohonen T (1990) The self-organizing map. Proc IEEE 78(9):1464-1480
28. Dodds PS, Clark EM, Desu S, Frank MR, Reagan AJ, Williams JR, Mitchell L, Harris KD, Kloumann IM, Bagrow JP, Megerdoomian K, McMahon MT, Tivnan BF, Danforth CM (2015) Human language reveals a universal positivity bias. Proc Natl Acad Sci USA 112(8):2389-2394
29. Rousseeuw PJ (1987) Silhouettes: a graphical aid to the interpretation and validation of cluster analysis. J Comput Appl Math 20:53-65
30. Li B, Lee-Urban S, Johnston G, Riedl M (2013) Story generation with crowdsourced plot graphs. In: Proceedings of the twenty-seventh AAAI conference on artificial intelligence
31. Bex FJ, Bench-Capon TJ (2010) Persuasive stories for multi-agent argumentation. In: AAAI fall symposium: computational models of narrative, vol 10, p 4
32. Riedl MO, Harrison B (2015) Using stories to teach human values to artificial agents
33. Bost X, Labatut V, Linarès G (2016) Narrative smoothing: dynamic conversational network for the analysis of TV series plots. arXiv:1602.07811
34. Prado SD, Dahmen SR, Bazzan ALC, Carron PM, Kenna R (2016) Temporal network analysis of literary texts. arXiv:1602.07275
35. Nenkova A, McKeown K (2012) A survey of text summarization techniques. In: Mining text data. Springer, Berlin, pp 43-76