R E S E A R C H A R T I C L E
Open Access
V-Model: a new perspective for EHR-based
phenotyping
Heekyong Park
1†and Jinwook Choi
1,2*†Abstract
Background:Narrative resources in electronic health records make clinical phenotyping study difficult to achieve. If a narrative patient history can be represented in a timeline, this would greatly enhance the efficiency of
information-based studies. However, current timeline representations have limitations in visualizing narrative events. In this paper, we propose a temporal model named the‘V-Model’which visualizes clinical narratives into a timeline. Methods:V-Model which models temporal clinical events in v-like graphical structure. It visualizes patient history on a timeline in an intuitive way. For the design, the representation, reasoning, and visualization (readability) aspects were considered. Furthermore, the unique graphical notation helps to find hidden patterns of a specific patient group. For evaluation, we verified our distinctive solutions, and surveyed usability. The experiments were carried out between the V-Model and a
conventional timeline model group. Eighty medical students and physicians participated in this evaluation.
Results:The V-Model was proven to be superior in representing narrative medical events, provide sufficient information for temporal reasoning, and outperform in readability compared to a conventional timeline model. The usability of the V-Model was assessed as positive.
Conclusions:The V-Model successfully resolves visualization issues of clinical documents, and provides better usability compared to a conventional timeline model.
Background
As electronic health record (EHR) systems rapidly become popular, studies on EHR-driven phenotyping have begun to emerge across countries [1-5]. Identifying patient co-horts is an essential part in EHR-driven genomic research. Various types of EHR data, ranging from structured data to unstructured narrative documentation, are selected and reviewed for validation. Of the many types of data that EHR provides, clinical documentation is considered to be the best resource. It contains rich information, and rela-tions among events (such as why the medication was used) which are not provided under a predefined struc-tural input system. However, Nastruc-tural Language Processing (NLP) content is the most difficult part in phenotype algo-rithm construction [6]. Although there are many NLP tools for medical domains [7-11] and previous studies
have adopted tools to extract useful information from enormous clinical documentations [12], human interfer-ence is still required. In the i2b2 project, clinical experts reviewed the full clinical narrative text of a random sub-sample to establish a “gold-standard”phenotype [2]. Kho et al. [13] reported that the eMERGE project also validated the EMR phenotype through manual review by experts. The process is time consuming and may cause mistakes.
Hripcsak and Albers [14] emphasized the need for a new model populated with characteristics learned from the data. We paid attention to temporal information and causality information, which constitute the main stream of clinical documentation. It would be greatly beneficial if narrative patient data and causality were incorporated into a timeline. The i2b2 project tried to adopt a timeline for phenotyping [15,16]. To support the validation of newly derived NLP data, the i2b2 Workbench rendered a time-line of the observed data. Lifetime-lines2 displayed clinical data generated by the i2b2 query system to help find hidden patterns in the EHR, by aligning patient histories on senti-nel events [17]. However, these timelines are limited to temporally explicit events and therefore not applicable to
* Correspondence:[email protected] †Equal contributors
1Interdisciplinary Program of Biomedical Engineering, Seoul National
University, Seoul, Republic of Korea
2Department of Biomedical Engineering, College of Medicine, Seoul National
University, Seoul, Republic of Korea
implicit events which frequently appear in clinical docu-mentation. In this paper, we propose a novel model to visualize narrative patient history called the V-Model. The V-Model displays narrative patient data and causal rela-tion on a timeline in a patterned format.
Related works
There have been attempts to visualize patient history using timelines. Various types of data have been used. Many of the systems have proposed an interface design for raw time-oriented data. Cousins and Kahn [18] devel-oped Time Line Browsers, an interactive environment for displaying and manipulating sets of timelines. Plaisant et al. [19,20] developed LifeLines that reorganize and visualize personal history to enhance navigation and analysis. Bui et al. [21,22] introduced the TimeLine system with the goal to provide a generalized meth-odology that could be applied to tailor UIs for differ-ent medical problems. More advanced attempts that have used abstracted data were also studied. The Knave-II offered timeline visualization on both raw data and on multiple levels of concepts abstracted from the data [23-25]. However, little work has been done that targets narrative clinical documents and events that have been visualized selectively. Bashyam et al. [26] developed a problem-oriented medical rec-ord (POMR) system for clinical documents. The exist-ence of problems or findings was visualized on a timeline grid which is a collection of explicit date cells. However, the timeline does not display other useful infor-mation, which does not belong to the problem list of their interests (e.g., narrative descriptions about situations that caused problematic symptoms). In addition, POMR view is difficult for reviewing clinical flow for general purposes. Jung et al. [27] developed a system that constructs time-lines of narrative clinical records, applying the deep nat-ural language understanding technique. The approach was generic covering a variety of clinical domains. However, they focused on explicit temporal expressions and present tense sentences only. LifeLines2 displays selected temporal categorical data from multiple patients. The data are not numerical in nature but time-stamped ones [17,28]. The restrictive implementations are due to difficulties in the NLP of clinical documents.
There have been studies suggesting solutions for visualization problems. In regards to granularity issues, LifeLines suggested a zooming function [19,20] and KNAVE-II proposed a content-based zoom method [25] to solve multiple granularity problems. Implicit prob-lems were solved by graphical variations of the point/ interval notation. TVQL modeled ambiguous temporal relationships with sliders, boxes, and line segments [29]. Combi et al. [30] defined graphical symbols that repre-sented a starting/ending instant, and minimum/maximum
duration to represent undefined durations. Causality rela-tion is one of the key features to understanding clinical context in its original description. Hallet [31] used color-coded arrows only when a user requested causality infor-mation. However, previous solutions cannot fully support diverse visualization problems in medical texts.
Problem definition
Representing narrative patient history with conventional timeline representation (i.e., representing point/interval events as a point and time span proportion as time length) comes with specific problems. We reviewed fifty randomly selected discharge summaries from Seoul National University Hospital (SNUH), and categorized the difficulties below.
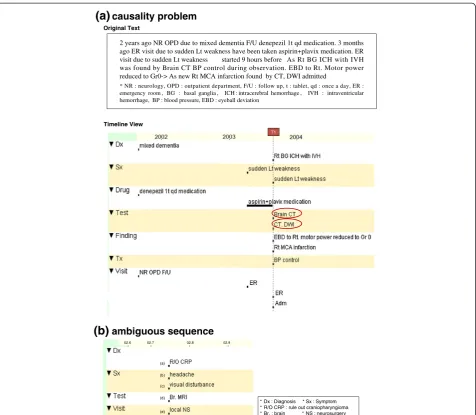
Representation Causality
Causality should be extrapolated using medical knowledge. Sometimes it gets very hard even for physicians. For example, in Figure 1(a), a CT test (marked in a red circle) was done twice on date ‘T1’. The original text depicts the rea-sons for each CT test. However, a physician cannot determine which one is the causal event from the timeline. Although rare, there have been attempts to show causality. However, they do not directly show the relation within a timeline to maintain visual clarity. Moreover, the quality of the information highly depends on the accuracy of the extraction system, which is not applicable to a broad medical domain.
Non-explicitness
Implicitness, fuzziness and uncertainty, incomplete-interval problem, and omission of temporal expressions cannot be displayed on a conventional timeline. Point/ interval variations to express as possible ranges have been attempted. However, a timeline full of such notations would make it more complex than the original text. Fur-thermore, some useful information contained in the ori-ginal expression might be missed. For example,“Since this
Korean Thanksgiving Day”implies both time information and a possible reason that caused the symptom such as heavy housework.
Granularity
Reasoning
Temporal relation is often hard to infer. As shown in Figure 1(b), the internal sequence can be interpreted ambiguously. The temporal relationship from a non-explicit time event is also a difficult problem.
Visualization
Many of the previous medical timeline systems have tried to organize events in semantic categories. However, the representation terribly disturbs readability when tracing a long history. As the conventional timelines expand vertically in proportion to unique event numbers, one should scroll the page up and down multiple times for understanding. When there is a long healthy
period among one’s medical history, the timeline will contain a long blank space, which can cause confusion and unnecessary scrolling.
Methods
Main axis of design concepts
We set requirements that took into consideration the repre-sentation of narrative clinical events and its utilization (reason-ing and visualization aspects).
Representation
The model should be able to represent any kind of med-ical event preserving the integrity of the original context. Especially, the model should be able to solve causality,
(a)
causality problem(b)
ambiguous sequenceTimeline View
* Dx : Diagnosis * Sx : Symptom * R/O CRP : rule out craniopharyngioma * Br. : brain * NS : neurosurgery
T1
(a)
(b)
(c)
(d)
(e)
02.6 02.7 02.8 02.9
non-explicit temporal information, and uneven granular-ity problems.
Reasoning
The model should provide sufficient information for quantitative and qualitative temporal reasoning.
Visualization
The model should provide an intuitive view that helps to understand patient history.
V-Model
The V-Model is a time model for narrative clinical events. Figure 2 shows the basic structure of the V-Model. With its special v-like structure and modeling strategies, the V-Model is able to resolve causality, non-explicitness, granu-larity, and reasoning issues. Furthermore, it conveys clin-ical situation: who (patients or health care providers, not specified but implied), what and how (Actions), where (Visit), when (TAP), and why (Problems).
It models why a patient visited the hospital on the Prob-lemwing and what actions were done for the problems on theActionwing. Modeling causality is complicated work. It may differ depending on personal perspectives, and sometimes it cannot be explained as a simple one-dimensional causal relation. Therefore, we simplified the modeling strategy as follows. All symptoms and purposes are modeled as aProblem. For diagnoses and findings, we limit causality in the V-Model to the causality explicitly described in the original text. For example, for “cervix cancer” in “due to cervix cancer, concurrent chemo RT was done”the expression is modeled as aProblem, but the same event without causality expression is modeled as an
Action. Our strategy is to convey the original context and let caregivers properly interpret the information for their use. The rest of clinical events are modeled as an Action. Actionmodels any event that happened because of the pa-tient’s problems. It includes diagnosis, clinical tests,
findings, drug, plans, operations, treatments or any other kinds of events. Visit models administrative information such as outpatient/emergency room visit, transfer, consult-ation, and department information.
Temporal information is written inTAP. It can be dis-played in both formal and informal temporal expres-sions, so that even a temporal proximity description can be represented. It is possible because we assume that the V-Model uses a dynamic scaled timeline, which implies the length between any two marking points (TAP) is not proportional to the temporal length. Therefore, we dis-play v-structures in sequence, without considering the temporal length between two v-structures.
Events accompanying the same temporal expression share TAP. However, when there is more than one causal relationship within the same time expression, we visualize them as multiple v-structures. Represent-ing only the Problem or Action wing is also available. When there are several events to be located on the same wing, the V-Model allows displaying them all within one wing, regardless of the number.
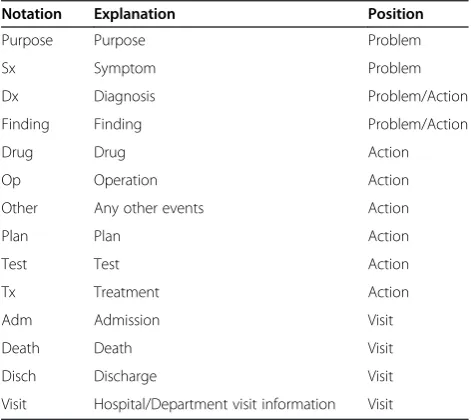
Semantic types are shown in Table 1. The Semantic
type for clinical events is shown ahead of a bunch of events which are in the same category. The V-Model uses a colored box to indicate a semantic tag: red for
Problemevents and blue forActionevents.
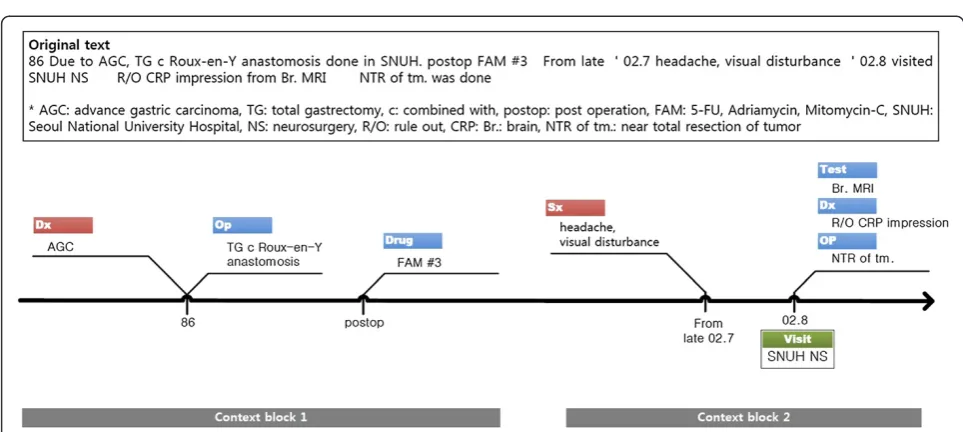
Figure 3 shows part of a clinical text represented in the V-Model. Temporal information, events, and caus-ality (problem-action) relationships are modeled, and the original context is successfully displayed.
Characteristics
The distinctive features of the V-Model are listed in Table 2.
Figure 2V-Model structure.
Table 1 Semantic types of the V-Model
Notation Explanation Position
Purpose Purpose Problem
Sx Symptom Problem
Dx Diagnosis Problem/Action
Finding Finding Problem/Action
Drug Drug Action
Op Operation Action
Other Any other events Action
Plan Plan Action
Test Test Action
Tx Treatment Action
Adm Admission Visit
Death Death Visit
Disch Discharge Visit
Representation aspects
The V-Model can represent problem-action relations, non-explicit temporal information, and uneven granular-ity expressions.
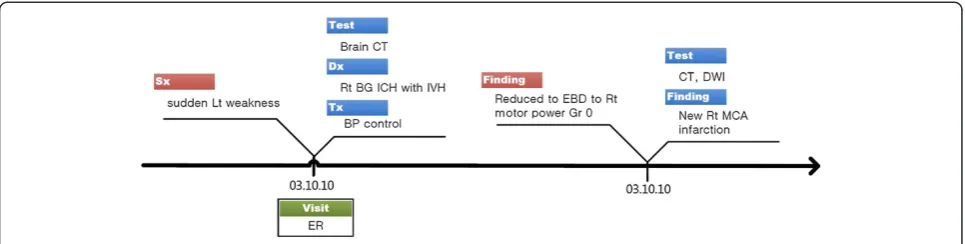
First, the V-Model provides a frame to connect problem-action relations (P1). For example, in Figure 4, we can clearly notice the two causal relations why the patient had to take MRI tests, which was impossible in Figure 1(a). The opposite directed pair of wings also en-ables linking a problem to a temporally separate action event. For example, chief complaints starting in late July and related actions done in August are visually connected by the left and following right wing pair (Figure 3).
Second, contrary to conventional methods, the model enables us to represent and understand implicit tem-poral information (P2). For example, in Figure 3, the im-plicit temporal expressions,‘86’and ‘02.8’, and the fuzzy and semi-interval temporal expression,‘from late 02.7’, are successfully described in TAP. The strategy allows TAP to contain diverse temporal expressions unless exactly matched to a calendar date. This is possible be-cause the V-Model uses a dynamic scaled timeline, and events in a patient’s clinical documents mostly appear in chronological order.
Implicitness on a finer granularity level is also solved by simply wrapping in the wing structure (P5). For instance, Figure 3V-Model example.Note that the gray context block rectangles are not part of the V-Model visualization. They are added to aid in understanding.
Table 2 Distinctive features of the V-Model
Id Distinctive features Related issue
Representation P1 Connection of Problem-Action relationship (P-A connection) Causality
P2 Non-explicit temporal expression (non-explicitness) Granularity
P3 Temporal proximity implied in medical terms (proximity hint) Non-explicitness
P4 Uneven granularity (uneven granularity) Non-explicitness
P5 Implicit internal sequence Non-explicitness
Reasoning R1 Problem starts before Action (P precedes A) Reasoning
R2 Qualitative temporal relation (qualitative relation) Reasoning
R3 Temporal distance from non-explicit event (implicit distance) Reasoning
Visualization V1 Intuitive view in discovering Problem-Action relationship (intuitive P-A relation) Visual enhancement
V2 Blocking effect of Problem-Action relationship among successive events (blocking effect) Visual enhancement
V3 Overview of events' flow Visual enhancement
V4 Dynamic scaled timeline (dynamic scale) visual enhancement
in Figure 3,‘Br. MRI’,‘r/o CRP diagnosis’, and‘NTR of tm’. share the same temporal expression ‘02.8’. However, it seems clear that the events are sequential events that oc-curred on a different day or at a different time. The V-Model does not require an internal order or temporal gap to model such cases. Even non-temporal expressions are utilized as temporal proximity hints (P3). For example, we can approximate that the FAM treatments in Figure 3 were done temporally close to a previous operation by referencing the “postop (post operation)” expression in TAP.
Third, the V-Model can display uneven granularity ex-pressions in one timeline view (P4). Medical texts tend to describe events occurring in the year as one in a very ab-stract manner with coarse granularity temporal expres-sions, i.e., at the years or decades level. Representing the coarser past histories together with the recent finer ones in one timeline is more natural and informative. Further-more, the V-Model view can convey emergent situations described on the hours or minutes level, which generally is ignored in conventional timelines.
Reasoning aspects
Although the V-Model timeline handles non-explicit information, a user can determine temporal relation-ships from the timeline.
First, the V-Model illustrates that problems start before actions (R1). As the V-Model separately structures causal problems from related actions, we can intuitively extrapo-late that Problems occurred before Actions although they have the same time expression. It is especially useful when a physician wants to know if the described symptom is a chief complaint or a newly developed symptom during the visit.
Second, reasoning the other temporal relationships is also possible (R2). This inference is done by calculating the TAP information manually whereas conventional timelines show the relationship intuitively. However, the weakness is deemed acceptable when considering the other powerful advantages that the TAP expression presents.
Third, the V-Model suggests TAP as a reference time point in temporal reasoning between non-explicit events (R3). When calculating the temporal distance between two operations,‘TG c Roux-en-Y anastomosis’and‘NTR of tm’. in Figure 3, the V-Model provides‘86’and ‘02.8’ as temporal reference information. One can simply infer that the distance is about sixteen years. It is much more natural and informative than previous attempts suggest-ing more accurate and concrete possible temporal dis-tance ranges, like 15 years and 8 months ~16 years and 7 months.
Visualization aspects
The V-Model timeline helps reading and understanding a patient’s history. The two wings help to discover problem-action relation intuitively (V1). Moreover, successive events in a causal relation are visually grouped together (V2) (e.g., context blocks 1 and 2 in Figure 3). Semantic information tag helps to quickly grasp the situation (V3), without read-ing in detail. In addition, the use of the dynamic scaled timeline (V4) is effective when there are long periods of blank history. The V-Model is especially effective in read-ing long histories (V5). Many of the previous medical time-line systems have tried to organize events in semantic categories. However, the category collective representation terribly disturbs readability when tracing long history sequences. Because the conventional timelines expand ver-tically in proportion to a unique event, one should scroll the page up and down multiple times for understanding. Because our model visualizes events in both vertically and horizontally compact space (by dynamic scale and seman-tic tag position), one can review patient history by just reading a v-structure one by one. This would prevent acci-dentally missing sparse data, reduce scrolling work, and allow one to grasp a patient’s history faster.
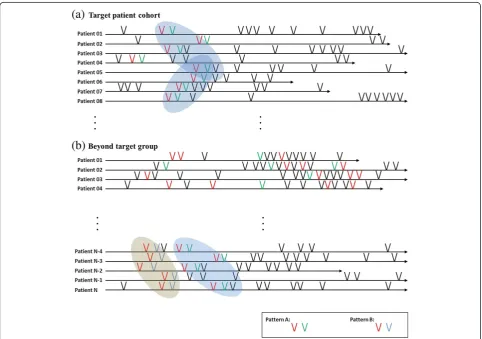
Pattern recognition
wings (V2). If a context block is found repetitively in a specific patient group (e.g., a red context block followed by a green one in Figure 5(a)), the block is recognized as a pattern. The pattern may be improved by further analysis, such as by refining temporal constraints, boundary redef-inition, etc.
The extracted patterns can be useful in developing a high throughput phenotype algorithm. Figure 5 shows the V-Model timelines each representing a patient’s lifelong clinical records (note that one V-shape in Figure 5 is an abstract representation of a context block to make the il-lustration simple). Figure 5(a) shows timelines of a target patient cohort, and (b) shows timelines beyond the target group. In all timelines in (a), one red P-A relation directly followed by one green P-A relation is found. The red-green events are recognized as a pattern (pattern A). We could guess ‘pattern A’ might be an important feature to identify a patient group. In the beyond target group, there are some patients that also have‘pattern A’. However, in this group, before ‘pattern A’appears, another pattern B (red P-A directly followed by blue one) exists. From the visualization, we can induce a phenotype algorithm that
includes‘pattern A’but excludes‘pattern A’following‘ pat-tern B’. This algorithm can be refined after further ana-lysis. For example, if all the‘pattern A’s in (a) occurred in early childhood, we could add temporal constraints for higher throughput.
Experimental design
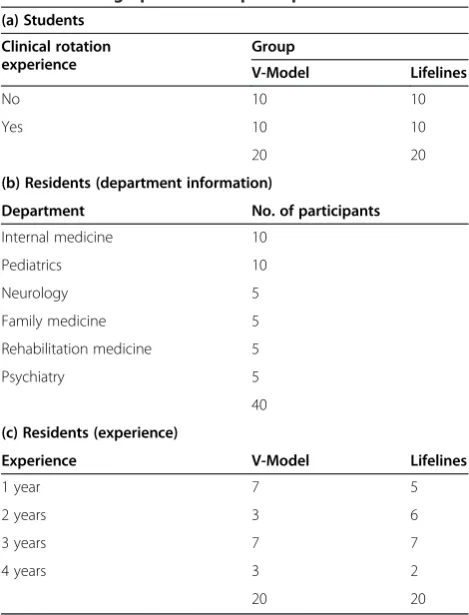
An automatic visualization system for the V-Model has not yet been implemented. Therefore, we evaluated our model focusing on the suitability of the V-Model dealing with narrative documents. Effectiveness in detecting pat-terns over other phenotyping methods was not measured at this stage. We used LifeLines [32], which is one of the best known visualization environments in medicine, as a representative of a conventional timeline representation. Forty medical students and forty residents from SNUH participated in this experiment (Table 3). We selected departments as ones that largely used narrative clin-ical notes and had comparatively less emergent situa-tions. Due to difficulties in recruiting participants, we designed all experiments to be completed in thirty minutes.
Step 1: verification of design requirements
In this step, we tested if our model was able to represent unresolved natural language issues (representation), provide sufficient information to reason temporal rela-tions (reasoning), and enhance readability (visualization) (Table 2). The test consists of information seeking prob-lems from a given timeline. Accuracy (i.e., percentage of correct answers within one evaluation item) and response time (i.e., time spent to solve one ques-tion) were used as the evaluation measurements. The questions were designed to maximize the differ-ence between the V-Model and the conventional timeline properties. For example, a P1 question tested a causality relation from an ambiguous case (i.e., “why the patient had to take the CT test twice on date ‘T1’?” as in the case for Figure 1(a)). In this case, we used accuracy to compare the representation power. However, in a V1 question, it targeted a simpler case that both model users could find the answer clearly. Additionally, we used response time to contrast readability.
Due to the time limitation, we carefully selected pas-sages that definitely contrasted the two models. The reviewed documents were randomly selected from our database, a collection of anonymized discharge summaries generated from SNUHa. We used discharge summaries for this experiment because each of them presents overall
clinical events, and contains a long history in narrative description. The selected documents contained up to 40 years of clinical histories in the present history sec-tion, and admission duration ranged from 0 to 224 days. Overall, nineteen timeline fragments from fourteen docu-ments were selected for the evaluation.
We manually visualized all fifty-discharge summaries in the V-Model with the MS Visio tool, and reviewed them to find the best examples. Questions made for this experiment are listed in Additional file 1. For the Life-Lines experimental group, we generated corresponding timelines with the LifeLines program. To exclude any system specific influence such as zooming, we used captured images.
Although the V-Model supports implicit sequential events (P5) and overview of events’flows (V3), the items were excluded from the evaluation because these fea-tures were very hard to evaluate objectively with simple questions. Non-explicitness (P2), proximity (P3), and implicit distance (R3) were tested only in the V-Model group because it was impossible to display in LifeLines. For uneven granular-ity (P4) and dynamic scale (V4), we exceptionally showed both types of timelines to both group participants. For P4 evaluation, we asked them to choose a model that represented uneven granularity. And for V4, we asked which type of representation (dynamic vs. static view) is more useful.
Step 2: usability evaluation
To compare the usability of the two visualization models, we adapted the System Usability Scale (SUS) questionnaire [33]. SUS is one of the popular and simple, ten-item attitude Likert scale assessing usability. We modified the general questions for the V-Model evaluation [see Additional file 1].
Results
Step 1: verification of design requirements
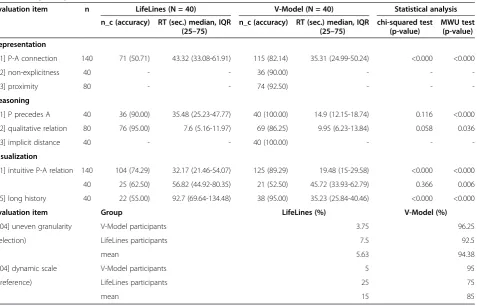
The step 1 experimental results are shown in Table 4. Although we explained that the response time is an im-portant measurement and urged participants to concen-trate on this experiment, uncontrollable interruptions occurred frequently (e.g., request for an immediate order, phone call, etc.). They mostly took just a few sec-onds but these interruptions significantly affected the distribution of the results. Therefore, we analyzed the difference in the response time with the Mann–Whitney
U-test (MWU test). We used the chi-squared test (or Fisher’s exact test) for an accuracy analysis. The results were analyzed at a 0.95 confidence level.
Representation aspects
We used accuracy to evaluate the representation power. For the P-A connection (P1), the V-Model showed about Table 3 Demographics of the participants
(a) Students
Clinical rotation experience
Group
V-Model Lifelines
No 10 10
Yes 10 10
20 20
(b) Residents (department information)
Department No. of participants
Internal medicine 10
Pediatrics 10
Neurology 5
Family medicine 5
Rehabilitation medicine 5
Psychiatry 5
40
(c) Residents (experience)
Experience V-Model Lifelines
1 year 7 5
2 years 3 6
3 years 7 7
4 years 3 2
32% higher accuracy. The test considered finding the causality relation, which could be interpreted ambigu-ously in a conventional timeline. The problem-action link made the participants find the right answers sig-nificantly better. Ninety percent of the participants in the V-Model group provided correct responses for the non-explicitness (P2) test. This result shows that the non-explicit temporal expression case was successfully modeled and conveyed in our timeline. Next, 92.5% of the V-Model participants could determine the tem-poral proximity (P3) from the non-temtem-poral TAP expressions. Overall, 94.38% of the participants from both groups agreed that the V-Model represented uneven granularity in one view (P4).
Reasoning aspects
To evaluate reasoning aspects, we used both accur-acy and response time as measurements. Accuraccur-acy showed whether the timeline sufficiently provided infor-mation for temporal reasoning. And response time mea-sured the easiness of the temporal reasoning process. In reasoning, P precedes A (R1), and both groups showed high performance. However, the V-Model group took less than one-third the response time compared to the Life-Lines group with the help of the graphical separation of the problem and action. In reasoning the qualitative
relation, the two groups showed no statistical difference in accuracy. However, the LifeLines group completed the questions in a statistically significantly less time. All of the V-Model participants provided a correct response to the question that required implicit distance reasoning (R3) (which was impossible in the LifeLines view).
Visualization aspects
To measure the easy-to-catch property established by the visualization aspects, we compared response times. The response times were statistically significantly faster in the V-Model group for all the evaluation items (V1, V2, and V5). In regards to the dynamic scale preference problem (V4), a prominent number of participants (85%) from both groups selected the dynamic timeline of the V-Model as more appropriate for patient history. Although the LifeLines users were unfamiliar with the V-Model, 75% of the LifeLines users chose this unfamil-iar timeline description as better.
Step 2: usability evaluation
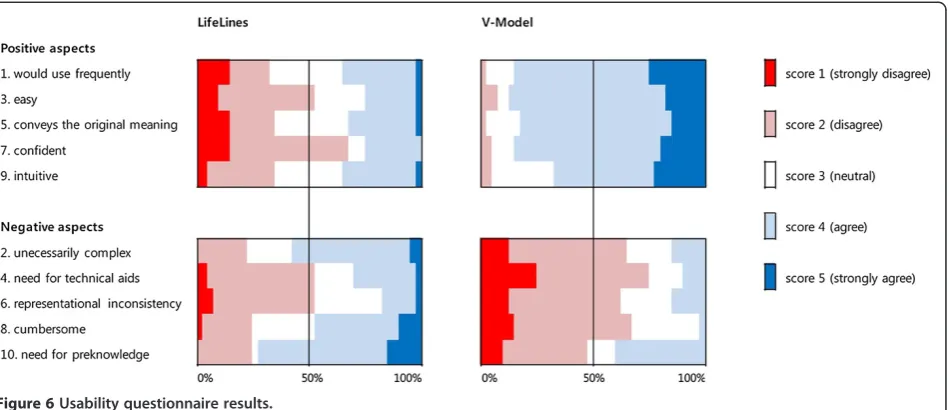
Figure 6 shows the answer distribution of the usability questionnaire, grouping the results related to positive questions and negative ones. The V-Model was assessed as superior to LifeLines in terms of usability. In regards to positive questions (questions 1, 3, 5, 7, Table 4 Step 1 experimental results
Evaluation item n LifeLines (N = 40) V-Model (N = 40) Statistical analysis
n_c (accuracy) RT (sec.) median, IQR (25–75)
n_c (accuracy) RT (sec.) median, IQR (25–75)
chi-squared test (p-value)
MWU test (p-value)
Representation
[P1] P-A connection 140 71 (50.71) 43.32 (33.08-61.91) 115 (82.14) 35.31 (24.99-50.24) <0.000 <0.000
[P2] non-explicitness 40 - - 36 (90.00) - -
-[P3] proximity 80 - - 74 (92.50) - -
-Reasoning
[R1] P precedes A 40 36 (90.00) 35.48 (25.23-47.77) 40 (100.00) 14.9 (12.15-18.74) 0.116 <0.000
[R2] qualitative relation 80 76 (95.00) 7.6 (5.16-11.97) 69 (86.25) 9.95 (6.23-13.84) 0.058 0.036
[R3] implicit distance 40 - - 40 (100.00) - -
-Visualization
[V1] intuitive P-A relation 140 104 (74.29) 32.17 (21.46-54.07) 125 (89.29) 19.48 (15-29.58) <0.000 <0.000
40 25 (62.50) 56.82 (44.92-80.35) 21 (52.50) 45.72 (33.93-62.79) 0.366 0.006
[V5] long history 40 22 (55.00) 92.7 (69.64-134.48) 38 (95.00) 35.23 (25.84-40.46) <0.000 <0.000
Evaluation item Group LifeLines (%) V-Model (%)
[P04] uneven granularity V-Model participants 3.75 96.25
(selection) LifeLines participants 7.5 92.5
mean 5.63 94.38
[V04] dynamic scale V-Model participants 5 95
(preference) LifeLines participants 25 75
mean 15 85
and 9), a prominent number of participants expressed (strong) agreement (score 4 and 5). Negative opinions were very few, and there was no strong disagreement (score 1). Conversely, in the results for the LifeLines group, we could not find a consensus. In the results for the negative aspect questions (questions 2, 4, 6, 8, and 10), the majority percentage of the V-Modelgroup answers were in disagreement (score 1 and 2), except for question 10. However, all participants could understand the V-Model without any information. We suppose the necessity for an explanation to the multiple P-A link problem affected the result. In the LifeLines group, a different factor affected the result. It is our guess that the lack of causality and difficul-ties in tracing patient history were the main reasons.
Discussion
The V-Model enables visualization of textual informa-tion in a timeline. It represents apparent P-A relainforma-tions only and describes the other minor relationships in nat-ural language. There might be a criticism that the P-A link is insufficient to cover the various contexts that clinical documents have. However, it is our belief that we com-pensated well balancing sustaining simplicity and inform-ing the original context at an adequate level.
The V-Model deals with universal natural language problems, such as causality, granularity, and non-explicitness problems. Although the experiment was per-formed based on Korean EHR data only, the results can be applied to any other language. It was proven that the V-Model functionally achieved our design goals. Further-more, it outperformed in the overall evaluation aspects. However, recognizing qualitative temporal relations (R2) took more time than conventional timeline representation.
Providing qualitative temporal information while preserving the V-Model’s simplicity would be a challenging work.
For the evaluation, we compared manually-visualized V-Model timelines with conventional timelines that were automatically generated by LifeLines. The comparison was fairly performed as we focused on timeline proper-ties, rather than systematic issues. System implementa-tion using the V-Model is not covered by this paper.
We demonstrated that the V-Model reflects design considerations for the NLP. For example, we simplified semantic tags as only 14 categories, clarifying how to de-termine an event as aProblem or anAction, and how to visualize events in the order of appearance when tem-poral information is missing.
The ultimate goal of our model is practical use in pa-tient treatment and medical research. We anticipate that the V-Model would play a crucial role in phenotype def-inition and algorithm development. The model extends our perspective on the data unit from a concept to a se-quence of concepts (context block). The V-Model time-line integrates distributed patient data regardless of its original source, type or institution. It enables a user to trace patient history considering semantic, temporal, and causality information in a short time. The view would ease and shorten the unavoidable manual reviewing process accelerating phenotyping more efficiently.
Conclusions
facilitates pattern finding, which would promote high-throughput phenotyping. The V-Model was shown to excel in representing narrative medical events, provide sufficient information for temporal reasoning, and out-perform in readability. The only disadvantage was taking a longer time in recognizing qualitative relationships. Subjects assessed our model positively on the usability evaluation. We conclude that the V-Model can be a new model for narrative clinical events, and it would make EHR data more reusable.
Endnote
a
Approved by SNUH Institutional Review Board (IRB) (IRB No. 1104-027-357).
Additional file
Additional file 1:Questions used in the experiments.
Competing interests
The authors declare that they have no competing interests.
Authors’contributions
Both authors contributed to the conception and design of the study, analysis, and interpretation of data, drafting of the article and final approval for submission. HP and JC designed the study. HP carried out data collection, analysis, and drafted the manuscript, with significant contributions from JC. HP and JC performed data interpretation. Both authors read and approved the final manuscript.
Acknowledgements
This research was supported by a grant of the Korean Health Technology R&D Project, Ministry of Health & Welfare, Republic of Korea. (A112005), and was supported by the National Research Foundation of Korea (NRF) funded by the Korea government (MSIP) (No. 2010–0028631).
Received: 31 October 2013 Accepted: 14 October 2014 Published: 23 October 2014
References
1. Roden DM, Pulley JM, Basford MA, Bernard GR, Clayton EW, Balser JR, Masys DR:Development of a large-scale de-identified DNA biobank to enable personalized medicine.Clin Pharmacol Ther2008,84:362–369.
2. Murphy S, Churchill S, Bry L, Chueh H, Weiss S, Lazarus R, Zeng Q, Dubey A, Gainer V, Mendis M, Glaser J, Kohane I:Instrumenting the health care enterprise for discovery research in the genomic era.Genome Res2009,
19:1675–1681.
3. Murphy SN, Mendis ME, Berkowitz DA, Kohane I, Chueh HC:Integration of clinical and genetic data in the i2b2 architecture.AMIA Annu Symp Proc
2006,2006:1040.
4. Manolio TA:Collaborative genome-wide association studies of diverse diseases: programs of the NHGRI's office of population genomics.
Pharmacogenomics2009,10:235–241.
5. Kaiser Permanente, UCSF Scientists Complete NIH-Funded Genomics Project Involving 100,000 People.In [http://www.dor.kaiser.org/external/ news/press_releases/Kaiser_Permanente,_UCSF_Scientists_Complete_NIH-Funded_Genomics_Project_Involving_100,000_People/]
6. Conway M, Berg RL, Carrell D, Denny JC, Kho AN, Kullo IJ, Linneman JG, Pacheco JA, Peissig P, Rasmussen L, Weston N, Chute CG, Pathak J:
Analyzing the heterogeneity and complexity of Electronic Health Record oriented phenotyping algorithms.AMIA Annu Symp Proc2011,
2011:274–283.
7. Zeng QT, Goryachev S, Weiss S, Sordo M, Murphy SN, Lazarus R:Extracting principal diagnosis, co-morbidity and smoking status for asthma
research: evaluation of a natural language processing system.BMC Med Inform Decis Mak2006,6:30.
8. Denny JC, Smithers JD, Miller RA, Spickard A III:"Understanding" medical school curriculum content using KnowledgeMap.J Am Med Inform Assoc
2003,10:351–362.
9. Savova GK, Masanz JJ, Ogren PV, Zheng J, Sohn S, Kipper-Schuler KC, Chute CG:Mayo clinical Text Analysis and Knowledge Extraction System (cTAKES): architecture, component evaluation and applications.J Am Med Inform Assoc2010,17:507–513.
10. Friedman C, Hripcsak G, DuMouchel W, Johnson SB, Clayton PD:Natural language processing in an operational clinical information system.Nat Lang Eng1995,1:83–108.
11. Aronson AR:Effective mapping of biomedical text to the UMLS Metathesaurus: the MetaMap program.AMIA Annu Symp Proc2001, 17–21.
12. Carroll RJ, Thompson WK, Eyler AE, Mandelin AM, Cai T, Zink RM, Pacheco JA, Boomershine CS, Lasko TA, Xu H, Karlson EW, Perez RG, Gainer VS, Murphy SN, Ruderman EM, Pope RM, Plenge RM, Kho AN, Liao KP, Denny JC:Portability of an algorithm to identify rheumatoid arthritis in electronic health records.J Am Med Inform Assoc2012,19:e162–e169. 13. Kho AN, Pacheco JA, Peissig PL, Rasmussen L, Newton KM, Weston N,
Crane PK, Pathak J, Chute CG, Bielinski SJ, Kullo IJ, Li R, Manolio TA, Chisholm RL, Denny JC:Electronic medical records for genetic research: results of the eMERGE consortium.Sci Transl Med2011,3:79re71. 14. Hripcsak G, Albers DJ:Next-generation phenotyping of electronic health
records.J Am Med Inform Assoc2013,20:117–121.
15. Murphy SN, Mendis M, Hackett K, Kuttan R, Pan W, Phillips LC, Gainer V, Berkowicz D, Glaser JP, Kohane I, Chueh HC:Architecture of the open-source clinical research chart from Informatics for Integrating Biology and the Bedside.AMIA Annu Symp Proc2007,2007:548–552.
16. Murphy SN, Weber G, Mendis M, Gainer V, Chueh HC, Churchill S, Kohane I:
Serving the enterprise and beyond with informatics for integrating biology and the bedside (i2b2).J Am Med Inform Assoc2010,17:124–130. 17. Wang TD, Plaisant C, Quinn AJ, Stanchak R, Murphy S, Shneiderman B:
Aligning temporal data by sentinel events: discovering patterns in electronic health records.InProceedings of the SIGCHI Conference on Human Factors in Computing Systems (CHI '08).New York, NY, USA: ACM; 2008:457–466.
18. Cousins SB, Kahn MG:The visual display of temporal information.Artif Intell Med1991,3:341–357.
19. Plaisant C, Milash B, Rose A, Widoff S, Shneiderman B:LifeLines: visualizing personal histories.InProceedings of the SIGCHI conference on Human factors in computing systems: common ground.Vancouver, British Columbia, Canada: ACM; 1996:221–227.
20. Plaisant C, Mushlin R, Snyder A, Li J, Heller D, Shneiderman B:LifeLines: using visualization to enhance navigation and analysis of patient records.AMIA Annu Symp Proc1998, 76–80.
21. Bui AAT, Aberle DR, Hooshang K:TimeLine: Visualizing Integrated Patient Records.Inform Technol Biomed IEEE Transactions on2007,11:462–473. 22. Bui AA, Taira RK, El-Saden S, Dordoni A, Aberle DR:Automated medical
problem list generation: towards a patient timeline.Stud Health Technol Inform2004,107:587–591.
23. Martins SB, Shahar Y, Goren-Bar D, Galperin M, Kaizer H, Basso LV, McNaughton D, Goldstein MK:Evaluation of an architecture for intelligent query and exploration of time-oriented clinical data.Artif Intell Med2008,43:17–34.
24. Martins SB, Shahar Y, Galperin M, Kaizer H, Goren-Bar D, McNaughton D, Basso LV, Goldstein MK:Evaluation of KNAVE-II: a tool for intelligent query and ex-ploration of patient data.Stud Health Technol Inform2004,107:648–652. 25. Goren-Bar D, Shahar Y, Galperin-Aizenberg M, Boaz D, Tahan G:KNAVE II:
the definition and implementation of an intelligent tool for visualization and exploration of time-oriented clinical data.InProceedings of the working conference on Advanced visual interfaces.Gallipoli, Italy: ACM; 2004:171–174.
26. Bashyam V, Hsu W, Watt E, Bui AA, Kangarloo H, Taira RK:Problem-centric organization and visualization of patient imaging and clinical data.
Radiographics2009,29:331–343.
28. Shneiderman TDWCPB:Visual Information seeking in multiple electronic health records: design recommendations and a process model.In
Proceedings of the 1st ACM International Informatics Symposium (IHI '10).
2010:46–55.
29. Hibino S, Rundensteiner EA:User interface evaluation of a direct manipulation temporal visual query language.InProceedings of the fifth ACM international conference on Multimedia.Seattle, Washington, United States: ACM; 1997:99–107.
30. Combi C, Portoni L, Pinciroli F:Visualizing Temporal Clinical Data on the WWW Artificial Intelligence in Medicine.InLecture Notes in Computer Science, Volume 1620.Edited by Horn W, Shahar Y, Lindberg G, Andreassen S, Wyatt J. Berlin/Heidelberg: Springer; 1999:301–311.
31. Hallett C:Multi-modal presentation of medical histories.InProceedings of the 13th International Conference on Intelligent User Interfaces.Gran Canaria, Spain: ACM; 2008:80–89.
32. LifeLines for Visualizing Patient Records.In [http://www.cs.umd.edu/hcil/ lifelines/]
33. J B:SUS: a‘quick and dirty’usability scale.InUsability Evaluation in Industry.London: Talylor & Francis; 1996:189–194.
doi:10.1186/1472-6947-14-90
Cite this article as:Park and Choi:V-Model: a new perspective for
EHR-based phenotyping.BMC Medical Informatics and Decision Making201414:90.
Submit your next manuscript to BioMed Central and take full advantage of:
• Convenient online submission
• Thorough peer review
• No space constraints or color figure charges
• Immediate publication on acceptance
• Inclusion in PubMed, CAS, Scopus and Google Scholar
• Research which is freely available for redistribution