Computational Fluid Dynamics Simulation of the Dynamics of a Tilting Disc Heart
Valve Prosthesis during the Opening and Fully Open Phases
Ranjith G
Muraleedharan C V
Device Testing Laboratory
Sri Chitra Tirunal Institute of Medical Sciences and Technology
Trivandrum
India
Abstract
The study of the hemodynamics is an important component in the design and validation of artificial heart valves. The removal of natural valves and their replacement by artificial valves may considerably alter the physiological flow. This necessitates an extensive verification and validation process involving in-vivo, in-vitro and in-silico models. The pulse duplicator is an in-vitro setup used to validate the performance of the valve dynamics. Physiological pressure and flow waveforms across the valve can be simulated using this setup using lumped impedances representing the systemic resistances and compliances. The use of Computational Fluid Dynamics(CFD) models to simulate the pulse duplicator allows access to parameters like velocity profiles, shear stresses and areas of separation and recirculation which are critical in the design of a heart valve prosthesis. A CFD analysis of the dynamics of a 25 mm sized tilting disc aortic valve was done with geometry and flow waveforms as in the in-vitro pulse duplicator setup. Two phases of the flow were simulated –the opening phase and the fully open phase. The results of the simulation were validated with results from the in-vitro experimental setup.
Keywords:
Heart Valve Prosthesis, Computational Fluid Dynamics ,Pulse Duplicator, Immersed Boundary Method1. Introduction
Natural heart valve dysfunction is a common disease which may be caused by a variety of pathologies. The dysfunctional valve fails to function as a unidirectional check valve, it becomes too leaky in the closed state (regurgitation) or very narrow and offer a higher resistance to blood flow in the open state (stenosis). There are many modes of management feasible for valve dysfunctions depending on the state of the valve and the patient. These include valve corrections using a catheter balloon expansion in case of a stenosis or use of an annuloplasty ring in cases of regurgitation. But correction methods cannot be used in all cases. Depending on the severity of the dysfunction a surgical removal of the natural valve and its replacement by a prosthetic heart valve might be necessary.
The performance of mechanical heart valves is in several ways related to valve design and the structural mechanics. The structural design and the choice of materials determine the load distribution on the valve, the dynamics of valve motion and thus the performance and durability of the valve. The design of the valve also determines the blood flow patterns of which flow separation and high shear regions are issues of concern. Regions of flow stagnation, which may cause localized thrombosis, may in turn restrict occluder movement.
The earlier approach in the numerical simulation of the cardiac prosthesis was to focus on the peak systole phase of the cardiac cycle. This neglects the movement of the leaflets and their interplay with blood. With the advent of new algorithms and capabilities in numerical methods recent studies provide a more indepth insight into the dynamics of leaflet motion and the associated hemodynamics.
Computational Fluid Dynamics simulation of artificial heart valves was initiated by Peskin1 with the immersed boundary method. The immersed boundary method allows the use of a separate non conforming solid mesh in addition to the fluid mesh. This was a huge improvement over the use of an adaptive mesh considering the large excursions of the disc (occluder) while opening or closing. King2,3 et al and Mcqueen4 et al conducted two dimensional parametric design studies aimed at arriving at an optimum opening angle of a bileaflet valve. Lei5 et al in his study demonstrated the limitations of two dimensional simulations by comparing them with experimental results. In the experimental studies vortex shedding was observed from the tip of the disc in a tilting disc valve, which could not be captured in the two dimensional numerical simulations. It was postulated that a full 3D numerical simulation is necessary to capture such effects. King6,7 et al. later conducted a 3 dimensional study under laminar conditions using one-quarter of the valve geometry assuming symmetry on both planes. A time varying sinusoidal velocity profile was used at the inlet to simulate the systolic phase of the cardiac cycle.
Most of the recent work has been on Fluid Structure Interaction models involving moving leaflets and pulsatile flow. Dasi8 et al conducted a direct numerical simulation (DNS) of pulsatile flow through a bileaflet valve in an idealized axisymmetric aorta geometry by prescribing leaflet motion from experimental data. But a prescribed kinematics of leaflet motion does not capture the complex phenomena of fluid–leaflet interaction required for an accurate simulation of the valve function. Nobili9 et al carried out a Fluid Structure Interaction model for a bileaflet valve using the commercial code Fluent and the results were validated with an ultrafast cinematographic technique.
The current study aims to simulate the flow dynamics of a tilting disc. The dynamics involves a pulsatile velocity profile and moving leaflets. Different flow parameters like the pressure drop, velocity profiles, shear stresses, areas of stagnation and recirculation were studied. The study was validated by experimental results from the in-vitro pulse duplicator setup.
2. Materials and Methods
Pulse Duplicator Experimental Setup
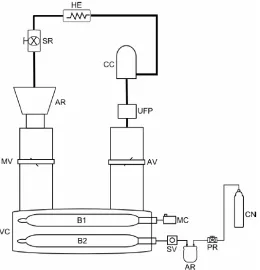
The pulse duplicator is a model of the left heart of humans. It simulates the entire systemic circulation using lumped resistances and compliances to model the flow through the vascular system. Fig. 1 shows the schematic setup of the pulse duplicator. The pulse duplicator is a device which simulates the function of the left heart by generating pulsatile flow through the heart valve prosthesis. It consists of the following components: an atrial reservoir, a ventricular chamber, compliance chambers, two unidirectional valves (aortic and mitral), and a pair of collapsible rubber balloons. The upper balloon B1 acts as a compliance element and is used for adjusting the rise time of the ventricular pressure wave. The lower balloon (B2) produces the pumping action as it is inflated by a supply of compressed nitrogen and deflated by venting to the atmosphere. The inflation and deflation cycles are controlled by a three way solenoid valve. In order to simulate the systemic impedance the circuit also includes additional hydraulic elements –a compliance chamber (CC) and resistance (SR). The experimental setup enables simulation of a pulse rate ranging from 40 beats per minute to 150 beats per minute and a systolic duration from 20% of the cardiac cycle to 50% of the cardiac cycle
CFD Simulation
Once the disc reaches the design opening angle the simulation is stopped and a new simulation with the disc remaining static in the fully open state is modeled. The second simulation starts with initial conditions extracted at the end of the first simulation.
A commercial solver Ansys CFX 13.0(Ms. Ansys Inc) was used for the simulation. A mesh was generated for the bulk of the fluid (including the cylindrical pipe and the housing and the valve cage) and a separate mesh was generated for the solid disc. Inorder to simulate the movement of the disc an immersed solid model was used which allows the solid mesh and the fluid mesh to be non-conforming. The immersed solid model is based on a mathematical framework developed by Peskin called the immersed boundary method1 in which a rigid or elastic structure is immersed in a fluid and the structure may be in motion.
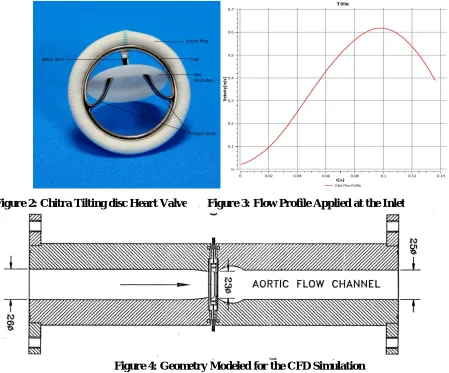
A transient simulation was defined with a total time period of 136ms which corresponds to the time period in which the valve is either opening or in the fully open state. A time step of 1ms was chosen for the simulation. At the inlet boundary a profile exported from the in-vitro pulse duplicator setup was used as the boundary condition (Fig 3). The applied profile corresponds to an average flow rate of 9 liters/minute. A constant static pressure was applied at the outlet. A Newtonian blood analogous fluid with density 1080 kg/m3 and viscosity 3.5 centipoise was used for the simulation. A k-ɛ turbulence model was used to model turbulence. The no-slip condition was applied at all the walls. Mesh Independence and time step independence was ensured using multiple iterations.
3. Results and Discussion
The simulation of the dynamics was done in two phases the opening phase and the fully open phase. The opening phase lasted for a duration of 75 milliseconds during which period the disc starts from the fully closed position and gradually opens to the design opening angle (75 degrees) as driven by the flow. When the disc reaches the fully open position an interrupt condition is triggered and the simulation was stopped. A new simulation was started with the disc remaining static in the fully open position with initial conditions exported from the end of the previous simulation. The valve was in the fully open position for a period of 61 milliseconds. The simulations were validated by comparing with the pressure drop across the valve in the in-vitro pulse duplicator setup. The drop was calculated by taking the difference in the average pressure measurements between two planes, one 1 TAD upstream and another 5 TAD downstream of the valve (TAD- Tissue Annulus Diameter- 25mm for the chosen valve). Fig 5. and Fig 6. show the comparison of the pressure drops in the experimental and numerical simulations.
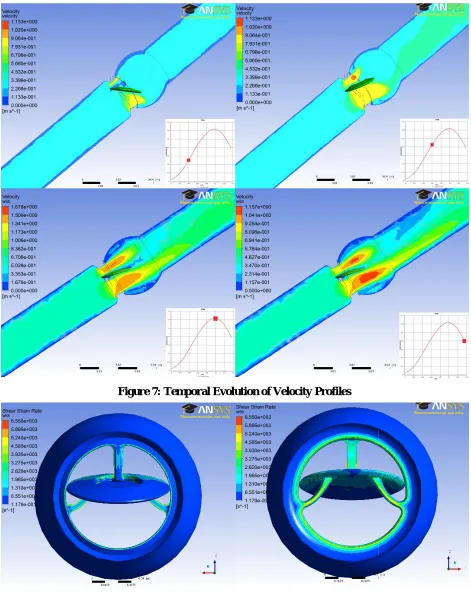
There is a good degree of correspondence between the experimental and numerical transvalvular pressure drops. The differences between them can be ascribed to the role played during the experiments by the systemic and the ventricular compliance, which have not been taken into account in the in silico model. The pictures below show the temporal evolution of the velocity contours on a longitudinal plane perpendicular to the disc. Four different phases in the evolution are illustrated-the opening phase (40 milliseconds), fully open phase(75 milli seconds), peak velocity(100 milliseconds) and retarding phase(136 milliseconds). The peak velocities obtained where around 1.67 m/s which corresponds with the in-vitro peak velocity values. Fig 8 shows the shear strain rates at the peak velocity point in the inlet profile (100 milliseconds)on the cage and disc of the valve. The shear strain rates were found to be largest on the cage of the valve (5240 s-1). The peak shear strain rates on the disc were about 3930 s-1.
4. Conclusion
The use of numerical methods can greatly reduce the design costs of prosthetic heart valves. They can to a large extend replace more costly in-vitro experiments since they provide access to more parameters than experimental setups.
References
Peskin, C. S., 1972, Flow Patterns Around Heart Valves: A Numerical Method, J. Comp. Phys., 10,pp. 252–271.. King, M. J. (1994) Computational and experimental studies of flow through a bileaflet mechanical heart valve.
Ph.D. Thesis, University of Leeds, UK.
King, M. J., David, T. and Fisher, J. (1994) An initial parametric study of fluid flow through bileaflet mechanical heart valves using computational fluid dynamics. J. Engng Med. 208,63-71.
McQueen, D. M. and Peskin, C. (1985) Computer-assisted design of butterfly bileaflet mechanical heart valves for the mitral position. J. Comput. Fluids 82, 289-297.
Lei, M., van Steenhoven, A. A. and van Campen, D. H. (1992) Experimental and numerical analyses of the steady flow field around an aortic Bjork-Shiley standard valve prostheses. J. Biomechanics 3, 213-222.
King, M. J., Corden, J., David, T., and Fisher, J., 1996, “A Three-Dimensional, Time-Dependent Analysis of Flow Through a Bileaflet Mechanical Heart Valve: Comparison of Experimental and Numerical Results,” J. Biomech., 29(5), pp. 609–618.
King, M. J., David, T., and Fisher, J., 1997,“Three-Dimensional Study of the Effect of Two Leaflet Opening Angles on the Time-Dependent Flow Through a Bileaflet Mechanical Heart Valve,” Med. Eng.Phys., 19(5), pp. 235–241.
Dasi, L.P., Ge, L., Simon, H.A., Sotiropoulos, F., Yoganathan, A.P.,2007. Vorticity dynamics of a bileaflet mechanical heart valve in an axisymmetric aorta. Physics of Fluids 19 (067105), 17.
Nobili M, Morbiducci U, Ponzini R, Del Gaudio C, Balducci A, Grigioni M, Maria Montevecchi F, Redaelli A. Numerical simulation of the dynamics of a bileaflet prosthetic heart valve using a fluid–structure interaction approach. J Biomech. 2008;41(11):2539–2550
Figure 4: Geometry Modeled for the CFD Simulation
Figure 2: Chitra Tilting disc Heart Valve Figure 3: Flow Profile Applied at the Inlet
Figure5. Comparison between Experimental and Numerical Transvalvular Pressure Gradients When the Disc is in the Opening Phase Red-Numerical Blue- Experimental
Fig6. Comparison between Experimental and Numerical Transvalvular Pressure Gradients When the Disc is in the Fully Open Phase Red-Numerical
Figure 7: Temporal Evolution of Velocity Profiles