e-ISSN: 2250-3021, p-ISSN: 2278-8719 Vol. 3, Issue 1 (Jan. 2013), ||V5|| PP 36-43
Color Image Enhancement Using Non Linear Transfer Function
and Quality Measurement Using Reduce Reference metrics
Divya Devan, Sree lekshmi Das, Neethu S.S, Shreyas L
Department of Computer Science and Engineering , Sree Buddha college of Engineering,Kerala University, Kerala, India
ABSTRACT: Image enhancement is carried out to improve some characteristic of an image to make it visually better one. This paper introduce a method for improving the dark region in digital images.It consist of two independent processes: luminance enhancement and contrast enhancement. The luminance enhancement, also regarded as a process of dynamic range compression, is essentially an intensity transformation based on a specifically designed nonlinear transfer function .The V channel is enhanced in two steps.First the V component image is divided into smaller overlapping blocks and for each pixel inside the block the luminance enhancement is carried out using nonlinear transfer function.then the contrast enhancement depending upon the central pixel value and its neighborhood pixel value. Finally enhanced V component image are converted back to RGB image. For measuring the visual quality of enhanced images reduced reference(RR) metrics are proposed. Experimental result showed that the proposed RR metrics work well for measuring the visual quality of spatially enhanced images.
Keywords: luminance enhancement, contrast enhancement, intensity transformation, reduced reference metrics.
I. INTRODUCTION
Color images provide more and richer information for visual perception than that of the gray images. Color image enhancement plays an important role in Digital Image Processing . The purpose of image enhancement is to get finer details of an image and highlight the useful information. Whhen an image capture under poor illumination conditions, the images appear darker or with low contrast. Image enhancement is a process involving changing the pixels’ intensity of the input image, so that the output image should subjectively looks better [1]. The purpose of image enhancement is to improve the interpretability or perception of information contained in the image for human viewers, or to provide a “better” input for other automated image processing systems.
The main purpose of image enhancement is to bring out detail that is hidden in an image or to increase contrast in a low contrast image. Whenever an image is converted from one form to other such as digitizing the image some form of degradation occurs at output. Improvement in quality of these degraded images can be achieved by using application of enhancement techniques. Processing techniques for image enhancement can be classified into spatial domain enhancement and transform domain enhancement distribution.
Various enhancement schemes are used for enhancing an image which includes gray scale manipulation, filtering and Histogram equalization. Histogram equalization is one of the well known image enhancement technique. Histogram Equalization became a popular technique for contrast enhancement because this method is simple and effective. HE technique can be applied in many fields such as in medical image processing, radar image processing, and sonar image processing. The basic idea of HE method is to remap the gray levels of an image based on the image’s gray levels cumulative density function. HE flattens and stretches the dynamic range of the resultant image histogram and as a consequence, it enhances the contrast of the image and gives an overall contrast improvement. HE normally changes the brightness of the image significantly, and thus makes the output image becomes saturated with very bright or dark intensity values. Hence, brightness preserving is an important characteristic needed to be considered in order to enhance the image for consumer electronic products [4].
II. RELATED WORK
block-overlapped histogram equalization algorithm for spatially adaptive contrast enhancement. Paul Scheunders[6] an orthogonal multivalued wavelet representation is developed.In this method detail images from different bands are combined into one single band.
In a different approach, Choi et al [7] proposed a color image enhancement method based on the single-scale retinex.All the processing was done in the HSV color space.In which only V component image is enhanced and H and S component images remain as they are.So it does not yield the color change.
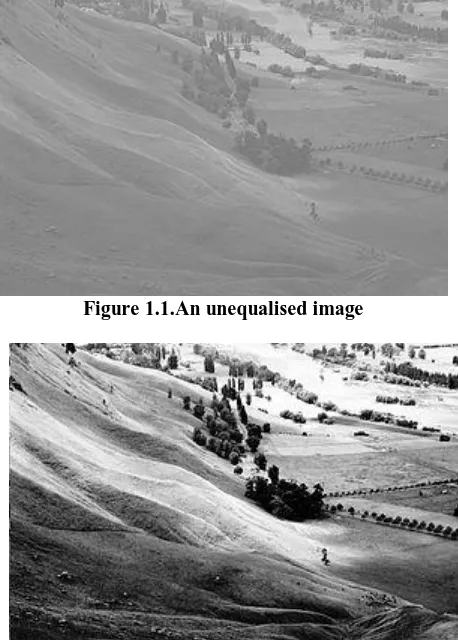
Figure 1.1.An unequalised image
Figure 1.2.The same after histogram equalization
The proposed algorithm has two steps. Luminance enhancement and contrast enhancement. Luminance enhancement is applied to the image through a pixel intensity transformation that is implemented by using a nonlinear transfer function. This transfer function can be manually or automatically adjusted to achieve appropriate luminance enhancement.
III. PROPOSED METHOD
In this paper we follow the algorithm described in [10] for the luminance and contrast enhancement of V component of the input image. In the original implementation of this process the shape of the nonlinear transfer function for luminance enhancement remains same for all the pixels.
The color image are represented in RGB color space.HSV space is closer to human perception in which the (H) refers to the spectral composition of color, saturation (S) defines the purity of colors and (V) refers the brightness of a color or just the luminance value of the color. The RGB values of an image are converted into HSV values using the following equations:
G
ifB
H
G
ifB
H
H
,
1
360
,
1
(1)
V Enhanced image
)
)(
(
)
(
)]
(
)
[(
5
.
0
cos
1
2 1B
G
G
R
G
R
G
R
G
R
H
(2))
,
,
max(
)
,
,
min(
)
,
,
max(
B
G
R
B
G
R
B
G
R
S
(3)
255
)
,
,
max(
R
G
B
V
(4)3.1. Luminance Enhancement
The luminance enhancement also known as process of dynamic range compression, which is the first step for enhancing the images captured under low or non uniform illumination conditions, is applied to the value component of the input image using specially designed nonlinear transfer function provided in [11]. The V
channel image given by (4) is subjected for luminance enhancement. Suppose VLE be the transferred value by applying nonlinear transfer function defined below:
2
)
1
(
)
1
)(
1
(
4
.
0
) 25 . 0 75 . 0 (x
V
V
x
V
V
x LE
(5)The shape of transfer function of (5) depends upon the parameter x, which is the image dependent parameter and is calculated by using the image histogram and is defined as:
150
1
150
50
100
50
50
0
forL
L
for
L
forL
x
(6)This transformation can largely increase the luminance for those dark pixels (regions) while brighter pixels(regions) have lower or even negative enhancement.
RGB to HSV conversion
Overlapped window based luminance enhancement
Pixel neighborhood based contrast
enhancement.
HSV to RGB conversion
Fig. 2 shows an image with global L and x parameter value as well as some local region bounded by rectangle and their corresponding L and x parameter values. The parameter x is different for different region of the image. Therefore the shape of transfer function is also different for different regions of that image. On the other hand luminance enhancement using global x parameter produces the output image with grayed out effect.
To solve all the problems stated above we treat the value component image locally for luminance enhancement. First the value component image is divided into smaller overlapping blocks. The parameter x in (5), which determines the shape of the transfer function, is now calculated for each overlapping blocks.
Fig. 2. An image and value of parameter x for whole image and for different regions bounded by rectangle.
A window of size N x N is taken and by using the histogram of the image inside this window the parameter x is calculated. The window is now shifted with some pixels n (less then N) along the row. The number of shift pixels of the window defines the amount of overlapping. After finishing along the first row of the image, the window is shifted along the column and process is repeated as before. In the similar way the window is moved all over the image for determination of the local x parameter of the transfer function (5). Here the window is shifted by an amount of n pixels in horizontal and vertical direction each, therefore now for each
n x n small blocks of the image we have four values of parameters x belonging to four corner of the n x n
window. Now the parameter value x for each pixels inside the n x n window are calculated by using the bilinear interpolation. Here the interpolation is used to remove the problem of the region transition and blocking artifacts in luminance enhancement process. Now for each pixel the amount luminance enhancement is calculated by using the local x parameter in (5). Fig. 3 shows the result of luminance enhancement using global x parameter as well as local x parameter. In Fig. 3 (c) the local detail in the image are stronger then in Fig. 3 (b) as well as the gray out problem of the luminance enhancement using global x is also solved partially.
)
,
(
)
,
(
)
,
(
x
y
V
x
y
G
x
y
V
c
F
(7)Fig. 3. Result of luminance enhancement using (a) global x parameter and (b) local x parameter in (5).
3.2. Contrast Enhancement
To improve the overall quality of the image a center-surround contrast enhancement is applied after luminance enhancement. As illustrated in [9] the normal global contrast enhancement technique simply increases the luminance for bright pixel and decreases the luminance for the dark pixels.Next, 2D discrete convolution is carried out on the original V channel image Vc(x, y) by using Gaussian function G(x, y) as the convolution kernel, which has a form like
The following equations defines the process of center surround contrast enhancement:
) , (
)
,
(
255
)
,
(
LE E xyCE
x
y
V
x
y
V
(8)Where E(x,y) is defind by:
p F
c p
y
x
V
y
x
V
y
x
R
y
x
E
(
,
)
(
,
)
[
(
,
)
(
,
)]
(9)VCE(x, y) is the contrast enhanced V channel image, R(x, y) is the ration between Gaussian filtered and original value component image. P is an image dependent parameter determined by using global standard deviation of the input value channel image VF.
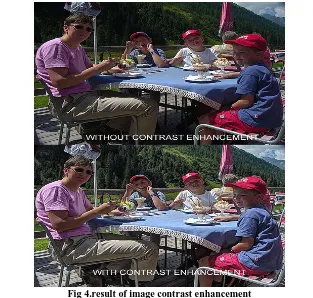
Fig 5:Result of image enhancement using different methods (a)original image.(b)Histogram Equalization.(c)AINDANE.(d)proposed method
Fig. 5 shows two input color images containing both dark and bright regions and result of the image enhancement by histogram equalization, AINDANE,and proposed method. histogram equalization changed the original color of the images,but the contrast is increased unnecessarily. AINDANE enhance the image globally but not consider the local detail. The global enhancement using AINDANE is satisfactory but the local details are still to be enhanced and the color is also changed slightly due to the use of color restoration process in RGB space. In the output images of proposed method one can see that both local and global contrast increase well with preserving image details.
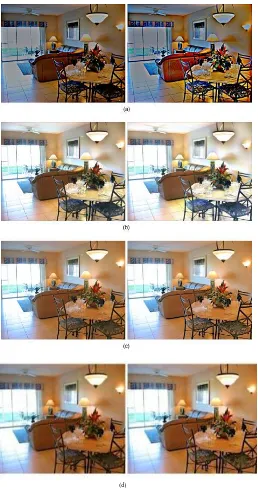
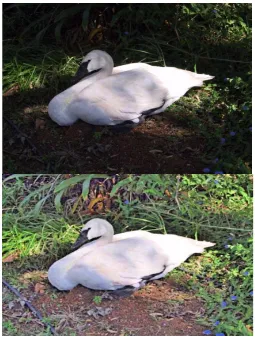
Fig 6:Original image and enhanced image using proposed method (Courtesy: Google –image enhanced by proposed method)
3.3. Quality Measurement
Fig. 5 shows two input color images containing both dark and bright regions and result of the image enhancement by histogram equalization, AINDANE, MSRCR and proposed method. The original color of the image is changed after enhancing using histogram equalization and AINDANE
Mean square error (MSE) is the simplest FR metric between the reference image x and the processed image y:
2
))
,
(
)
,
(
(
1
)
,
(
y
i
j
x
i
j
N
y
x
MSE
(10)Peak signal to noise ratio (PSNR) is also a popular FR metric to measure the quality of a reconstructed image, and it is defined as:
) )) , ( ) , ( ( 1
) max( (
log 10 ) , (
,
2 2 10
j i
j i x j i y N
x y
x
PSNR (11)
The PSNR has been used as a standard metric in image denoising and other related image processing tasks. Wang et al (2004) also developed the structural similarity (SSIM) index, which is also a FR metric, by comparing local correlations in luminance, contrast, and structure between the reference and distorted images. The SSIM index is defined as:
2 2 2 2
2
.
2
.
1
)
,
(
y x
y x
y x
y x
y x
xy
C
y
x
SSIM
(12))
16
(
)
2
:
2
:
2
,
2
:
2
:
2
(
)
15
(
)
2
:
2
:
1
,
2
:
2
:
2
(
)
14
(
)
2
:
2
:
2
,
2
:
2
:
1
(
)
13
(
)
2
:
2
:
1
,
2
:
2
:
1
(
22 21 12 11Q
P
g
g
Q
P
g
g
Q
P
g
g
Q
P
g
g
The following four RR metrics are proposed[12] for quality measurement:
2 1 2 1 2 1 2 1 2 1 2 1 2 1 2 1 ) 20 ( ) ; ( 4 1 ) ; ( ) 19 ( ) ; ( 4 1 ) ; ( ) 18 ( ) ; ( 4 1 ) ; ( ) 17 ( ) ; ( 4 1 ) ; ( i j ij j ij i i j ij i j ij g f VIF g f VIF g f MSSIM g f MSSIM g f Q g f Q g f PSNR g f PSNR IV. CONCLUSIONIn this paper we propose a color image enhancement method for both luminance and contrast enhancement .The luminance enhancement is carried out only on V component of the image. H and S component are not changed during enhancement..So that the original color of enhanced image cannot change after enhancement.Our proposed four new reduced reference(RR) metrics measuring the visual quality of images. The experimental result shows that our proposed method produces better images.
REFERENCES
[1] MS Thesis by Abhijit” On Color Processing in Still Images and Video”,May 2008
[2] Anisk Kumar, Vishwakarma Agya Mishra”Color Image enhancement Technique A critical Review”, International journal of Computer Science and Engineering Vol. 3 No. 1 Feb -Mar 2012 40
[3] Y.T.Kim”Contrast enhancement using brightness preserving bi histogram equalization”IEEE Trans.Consumer Electronics vol 43no ac1, pp1-8Feb,1997.
[4] Yu Wang, Q. Chen, and B. Zhang, “Image enhancement based on equal area dualistic sub-image histogram equalization method” IEEE Trans Consumer Electronics, vol. 45, no. 1, pp. 68-75, Feb. 1999.
[5] T. K. Kim, J. K. Paik, and B. S. Kang” Contrast enhancement system using spatially adaptive histogram equalization with temporal filtering” IEEE Trans. Consumer Electronics, vol. 44, no. 1, pp. 82-87, Feb. 1998.
[6] Paul Scheunders v “an orthogonal wavelet representation of multi valued images” IEEE Transactions On Image Processing, Vol. 12, No. 6, June 2003.
[7] Doo Hyun Choi1, Ick Hoon Ja2, Mi Hye Kim, and Nam Chul Kim ”Color Image enhancement using single scale retinex based on an improved information model”, European Signal Processing Conference (EUSIPCO 2008), Lausanne, Switzerland, August 25-29, 2008.
[8] Li Tao and Vijayan Asari “An Integrated Neighborhood Dependent Approach for Nonlinear Enhancement of Color Images” International Conference on Information Technology Coding and Computing (ITCC’04) 2004 IEEE.
[9] S. – D. Chen, and A. R. Ramli,”Contrast Enhancement using recursive mean separate histogram equalization for scalable Brightness preservation” IEEE Trans Consumer Electronics vol. 49 no. 4, pp 1301-1309, Nov. 2003.
[10] V. Buzuloiu, M. Ciuc, R. M. Rangayyan, and C. Vertan, “Adaptive neighborhood histogram equalization of color images” Journal of Electron Imaging, vol. 10, no. 2, pp. 445-459, 2001
[11] Deepak Ghimire and Joonwhoan Lee”Non Linear Transfer Function Based Local Approach for Color Image enhancement “” IEEE Transactions on Consumer Electronics, Vol. 57, No. 2, May 2011. [12] S.Quine G.Chen”Four Reduced Reference Metrics For Measuring Hyper Spectral Images After Spacial