Ramya et al. World Journal of Pharmaceutical and Medical Research Srilekhaet al. World Journal of Pharmaceutical and Medical Research
DEVELOPMENT AND EVALUATION OF FLOATING TABLETS FOR GASTRIC
RETENTION USING SILYMARIN AS A MODEL DRUG
Vundeti Srilekha1* and Dr. M. Dhanalakshmi2
Department of Pharmaceutics, KLR Pharmacy College, Bhadradri Kothagudem, Telangana, India.
Article Received on 02/10/2018 Article Revised on 23/10/2018 Article Accepted on 13/11/2018
INTRODUCTION
An orally administered controlled drug delivery system encounters a wide range of highly variable conditions, such as pH, agitation intensity, and composition of the gastrointestinal fluids as it passes down the G.I tract. Considerable efforts have been made to design oral controlled drug delivery systems that produce more predictable and increased bioavailability of drugs. However, the development process is precluded by several physiological difficulties, like inability to retain and localize the drug delivery system within desired regions of the G.I tract and highly variable nature of the gastric emptying process. An important factor, which may adversely affect the performance of an oral controlled drug delivery system, is the G.I transit time. The time for absorption in the G.I transit in humans, estimated to be 8-10 hr from mouth to colon, is relatively brief with considerable fluctuation. G.I transit times vary widely between individuals, and depend up on the physical properties of the object ingested and the physiological conditions of the gut. This variability may lead to predictable bioavaialability and times to achieve peak plasma levels. One of the important determinants of G.I transit is the residence time in the stomach.
Gastroretentive Drug Delivery Systems
Gastroretentive systems can remain in the gastric region for several hours and hence significantly prolong the
gastric residence time of drugs. Prolonged gastric retention improves bioavailability, reduces drug waste, and improves solubility for drugs that are less soluble in a high pH environment. It has applications also for local drug delivery to the stomach and proximal small intestines. Gastro retention helps to provide better availability of new products with new therapeutic possibilities and substantial benefits for patients.
Floating Drug Delivery System:
Floating drug delivery systems (FDDS) have a bulk density less than gastric fluids and so remain buoyant in the stomach without affecting gastric emptying rate for a prolonged period of time.
Mechanism of floating systems
Various attempts have been made to retain the dosage form in the stomach as a way of increasing the retention time. FDDS have a bulk density less than gastric fluids and so remain buoyant in the stomach without affecting the gastric emptying rate for a prolonged period of time. While the system is floating on the gastric contents, the drug is released slowly at the desired rate from the system. After release of drug, the residual system is emptied from the stomach. This results in an increased GRT and a better control of the fluctuations in plasma drug concentration.[1]
ISSN 2455-3301
WJPMR
AND MEDICAL RESEARCH
www.wjpmr.com*Corresponding Author: Vundeti Srilekha
Department of Pharmaceutics, KLR Pharmacy College, Bhadradri Kothagudem, Telangana, India.
ABSTRACT
In the present research work gastro retentive floating matrix formulation of Silymarin by using various polymers were developed. Initially analytical method development was done for the drug molecule. Absorption maxima was determined based on that calibration curve was developed by using different concentrations. Gas generating agent sodium bicarbonate concentration was optimised. Then the formulation was developed by using different concentrations of polymers Ethyl cellulose, HPMC K4M, Sodium CMC and Carbopol P934 as polymeric substances. The formulation blend was subjected to various preformualation studies, flow properties and all the formulations were found to be good indicating that the powder blend has good flow properties. Among all the formulations the formulations HPMC K4M as polymer were retarded the Maximum drug release until 12 hours (F5=98.15%). whereas in low concentrations the polymer was unable to produce the desired action. The optimized formulation dissolution data was subjected to release kinetics, from the release kinetics data it was evident that the formulation followed peppas release kinetics mechanism of drug release.
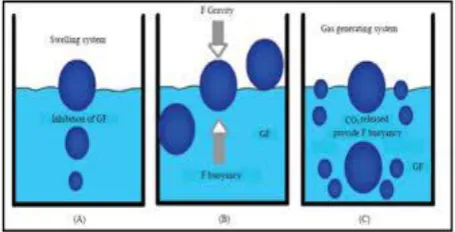
However, besides a minimal gastric content needed to allow the proper achievement of the buoyancy retention principle, a minimal level of floating force (F) is also required to keep the dosage form reliably buoyant on the surface of the meal. To measure the floating force kinetics, a novel apparatus for determination of resultant weight has been reported in the literature. The apparatus operates by measuring continuously the force equivalent to F (as a function of time) that is required to maintain the submerged object. The object floats better if F is on the higher positive side. [2]
F = F buoyancy - F gravity = (Df - Ds) gv Where,
F= total vertical force; Df = fluid density; Ds = object density;
v = volume and g = acceleration due to gravity
Fig. 1: Mechanism of floating systems. Silymarin is a standardised seed extract which is rich in a type of flavonoid compounds known as flavonolignans. The main flavonolignans in silymarin are the isomers, silybin (also known as silibinin), silydianin, and silychristin. Silymarin acts as an antioxidant, scavenger and regulator of the intracellular content of glutathione, cell membrane stabiliser and permeability regulator to prevent hepatotoxic agents from entering hepatocytes. It also acts as a promoter of ribosomal RNA synthesis, stimulator of liver regeneration and inhibitor of the transformation of stellate hepatocytes into myofibroblasts - the process responsible for the deposition of collagen fibres, leading to cirrhosis. Literature review of Silymarin shown that there were several formulations like silymarin gel,[3] controlled porosity osmotic formulation,[4] floating microspheres.[5] A very few formulations for silymarin as gastro retentive floating tablets are developed.[6] The aim of the present work is to formulate & evaluate gastro retentive floating tablets[7-15] of Silymarin using Different polymers.
Fig. 2: Structure of Silymarin.
MATERIALS AND METHODS Chemical reagents used
Silymarin procured from MICRO LABS provided by SURA LABS ,Dilsukhnagar , Hyderabad. Ethyl cellulose, HPMC K4M, Sodium CMC, Carbopol P934, Lactose, NaHCO3 and Magnesium Stearate from MERCK Specialities Pvt Ltd, Mumbai, India.
Equipments
Tablet Compression Machine (Multistation)- Lab Press Limited, India. Weighing Balance- Sartourius, Hardness tester- Monsanto, Mumbai, India. Vernier calipers- Mitutoyo, Japan. Roche Friabilator and DissolutionApparatus- Labindia, Mumbai, India. UV-Visible Spectrophotometer and pH meter-Labindia, Mumbai, India. FT-IR Spectrophotometer- Bruker.
Analytical method development
a) Determination of absorption maxima
A solution containing the concentration 10 µg/ mL drug was prepared in 0.1N HCL UV spectrum was taken using Double beam UV/VIS spectrophotometer. The solution was scanned in the range of 200 – 400 nm.
b) Preparation calibration curve
10mg Silymarin pure drug was dissolved in 10ml of methanol (stock solution1) from stock solution1 1ml of solution was taken and made up with10ml of 0.1N HCL (100μg/ml). From this 1ml was taken and made up with 10 ml of 0.1N HCL (10μg/ml). The above solution was subsequently diluted with 0.1N HCL to obtain series of dilutions Containing 10, 20,30,40 and 50 µg /ml of per ml of solution. The absorbance of the above dilutions was measured at 287 nm by using UV-Spectrophotometer taking 0.1N HCL as blank. Then a graph was plotted by taking Concentration on X-Axis and Absorbance on Y-Axis which gives a straight line Linearity of standard curve was assessed from the square of correlation coefficient (R2) which determined by least-square linear regression analysis.
Formulation development of floating Tablets
For optimization of sodium bicarbonate concentration, granules were prepared by direct compression method.
Procedure for direct compression method
1) Drug and all other ingredients were individually passed through sieve no 60.
2) All the ingredients were mixed thoroughly by triturating up to 15 min.
3) The powder mixture was lubricated with talc. 4) The tablets were prepared by using direct
compression method by using 8 mm punch.
Optimisation of Sodium bicarbonate
bicarbonate was finalized and preceded for further formulations.
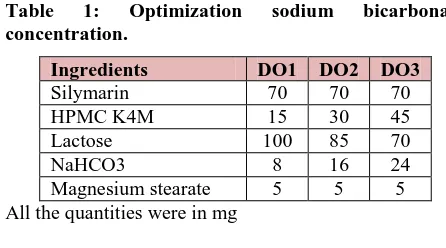
Table 1: Optimization sodium bicarbonate concentration.
Ingredients DO1 DO2 DO3
Silymarin 70 70 70
HPMC K4M 15 30 45
Lactose 100 85 70
NaHCO3 8 16 24
Magnesium stearate 5 5 5
All the quantities were in mg
Based on the floating lag time and floating duration the concentration of sodium bicarbonate was optimised.
Formulation of Tablets
Table 2: Formulation composition for Floating tablets.
Ingredients Formulation Code
F1 F2 F3 F4 F5 F6 F7 F8 F9 F10 F11 F12
Silymarin 70 70 70 70 70 70 70 70 70 70 70 70
Ethyl cellulose 15 30 45 - - - -
HPMC K4M - - - 15 30 45 - - - -
Sodium CMC - - - 15 30 45 - - -
Carbopol p934 - - - 15 30 45
Lactose 94 79 64 94 79 64 94 79 64 94 79 64
NaHCO3 16 16 16 16 16 16 16 16 16 16 16 16
Magnesium stearate 5 5 5 5 5 5 5 5 5 5 5 5
Total Weight 200 200 200 200 200 200 200 200 200 200 200 200 All the quantities were in mg
Preformulation parameters
The quality of tablet, once formulated by rule, is generally dictated by the quality of physicochemical properties of blends. There are many formulations and process variables involved in mixing and all these can affect the characteristics of blends produced. The various characteristics of blends tested as per Pharmacopoeia.
Angle of repose
The frictional force in a loose powder can be measured by the angle of repose. It is defined as, the maximum angle possible between the surface of the pile of the powder and the horizontal plane. If more powder is added to the pile, it slides down the sides of the pile until the mutual friction of the particles producing a surface angle, is in equilibrium with the gravitational force. The fixed funnel method was employed to measure the angle of repose. A funnel was secured with its tip at a given height (h), above a graph paper that is placed on a flat horizontal surface. The blend was carefully pored through the funnel until the apex of the conical pile just touches the tip of the funnel. The radius (r) of the base of the conical pile was measured. The angle of repose was calculated using the following formula:
Tan θ = h / r Tan θ = Angle of repose h = Height of the cone, r = Radius of the cone
Table 3: Angle of Repose values (as per USP).
Angle of Repose Nature of Flow <25 Excellent
25-30 Good
30-40 Passable >40 Very poor
Bulk density
Density is defined as weight per unit volume. Bulk density, is defined as the mass of the powder divided by the bulk volume and is expressed as gm/cm3. The bulk density of a powder primarily depends on particle size distribution, particle shape and the tendency of particles to adhere together. Bulk density is very important in the size of containers needed for handling, shipping, and storage of raw material and blend. It is also important in size blending equipment. 10 gm powder blend was sieved and introduced into a dry 20 ml cylinder, without compacting. The powder was carefully leveled without compacting and the unsettled apparent volume, Vo, was read.
The bulk density was calculated using the formula: Bulk Density = M / Vo
Where, M = weight of sample, Vo = apparent volume of powder
Tapped density
density tester that provides 100 drops per minute and this was repeated until difference between succeeding measurement is less than 2 % and then tapped volume, V measured, to the nearest graduated unit. The tapped density was calculated, in gm per L, using the formula:
Tap = M / V
Where, Tap= Tapped Density, M = Weight of sample, V= Tapped volume of powder
Measures of powder compressibility
The Compressibility Index (Carr‟s Index) is a measure of the propensity of a powder to be compressed. It is determined from the bulk and tapped densities. In theory, the less compressible a material the more flowable it is. As such, it is measures of the relative importance of interparticulate interactions. In a free- flowing powder, such interactions are generally less significant, and the bulk and tapped densities will be closer in value.
For poorer flowing materials, there are frequently greater interparticle interactions, and a greater difference between the bulk and tapped densities will be observed. These differences are reflected in the Compressibility Index which is calculated using the following formulas:
Carr‟s Index = [(tap - b) / tap] × 100 Where, b = Bulk Density, Tap = Tapped Density
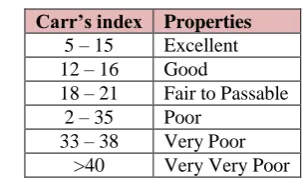
Table 4: Carr’s index value (as per USP).
Carr’s index Properties 5 – 15 Excellent 12 – 16 Good
18 – 21 Fair to Passable 2 – 35 Poor
33 – 38 Very Poor >40 Very Very Poor
Evaluation of post compression parameters for prepared Tablets
The designed compression tablets were studied for their physicochemical properties like weight variation, hardness, thickness, friability and drug content.
Weight variation test
To study the weight variation, twenty tablets were taken and their weight was determined individually and collectively on a digital weighing balance. The average weight of one tablet was determined from the collective weight. The weight variation test would be a satisfactory method of deter mining the drug content uniformity. Not more than two of the individual weights deviate from the average weight by more than the percentage shown in the following table and none deviate by more than twice the percentage. The mean and deviation were determined. The percent deviation was calculated using the following formula.
% Deviation = (Individual weight – Average weight / Average weight) × 100
Table 5: Pharmacopoeial specifications for tablet weight variation.
Average weight of tablet (mg) (I.P)
Average weight of tablet (mg) (U.S.P)
Maximum percentage difference allowed
Less than 80 Less than 130 10
80-250 130-324 7.5
More than More than 324 5
Hardness
Hardness of tablet is defined as the force applied across the diameter of the tablet in order to break the tablet. The resistance of the tablet to chipping, abrasion or breakage under condition of storage transformation and handling before usage depends on its hardness. For each formulation, the hardness of three tablets was determined using Monsanto hardness tester and the average is calculated and presented with deviation.
Thickness
Tablet thickness is an important characteristic in reproducing appearance. Tablet thickness is an important characteristic in reproducing appearance. Average thickness for core and coated tablets is calculated and presented with deviation.
Friability
It is measured of mechanical strength of tablets. Roche friabilator was used to determine the friability by
following procedure. Pre weighed tablets were placed in the friabilator. The tablets were rotated at 25 rpm for 4 minutes (100 rotations). At the end of test, the tablets were re- weighed, and loss in the weight of tablet is the measure of friability and is expressed in percentage as:
% Friability = [(W1-W2) / W1] × 100
Where, W1 = Initial weight of tablets, W2 = Weight of the tablets after testing
Determination of drug content
determined by UV –Visible spectrophotometer. The drug concentration was calculated from the calibration curve.
In vitro Buoyancy studies
The in vitro buoyancy was determined by floating lag time, and total floating time. (As per the method described by Rosa et al) The tablets were placed in a 100ml beaker containing 0.1N HCL. The time required for the tablet to rise to the surface and float was determined as floating lag time (FLT) and duration of time the tablet constantly floats on the dissolution medium was noted as Total Floating Time respectively (TFT).
In vitro drug release studies
As the preparation was for floating drug release given through oral route of administration, different receptors fluids are used for evaluation the dissolution profile.
Procedure
900ml 0f 0.1 HCL was placed in vessel and the USP apparatus –II (Paddle Method) was assembled. The medium was allowed to equilibrate to temp of 37°c + 0.5°c. Tablet was placed in the vessel and the vessel was covered the apparatus was operated for 12 hours and then the medium 0.1 N HCL was taken and process was continued from 0 to 12 hrs at 50 rpm. At definite time intervals of 5 ml of the receptors fluid was withdrawn, filtered and again 5ml receptor fluid was replaced. Suitable dilutions were done with media and analyzed by spectrophotometrically at 287 nm using UV-spectrophotometer.
Application of Release Rate Kinetics to Dissolution Data
Various models were tested for explaining the kinetics of drug release. To analyze the mechanism of the drug release rate kinetics of the dosage form, the obtained data were fitted into zero-order, first order, Higuchi, and Korsmeyer-Peppas release model.
Zero order release rate kinetics
To study the zero–order release kinetics the release rate data ar e fitted to the following equation.
F = Ko t
Where, „F‟ is the drug release at time„t‟, and „Ko‟ is the zero order release rate constant. The plot of % drug release versus time is linear.
First order release rate kinetics: The release rate data are fitted to the following equation
Log (100-F) = kt
A plot of log cumulative percent of drug remaining to be released vs. time is plotted then it gives first order release.
Higuchi release model: To study the Higuchi release
kinetics, the release rate data were fitted to the following equation.
F = k t1/2 Where, „k‟ is the Higuchi constant.
In higuchi model, a plot of % drug release versus square root of time is linear.
Korsmeyer and Peppas release model
The mechanism of drug release was evaluated by plotting the log percentage of drug released versus log time according to Korsmeyer- Peppas equation. The exponent „n‟ indicates the mechanism of drug release calculated through the slope of the straight Line.
Mt/ M∞ = K tn
Where, Mt/ M∞ is fraction of drug released at time „t‟, k represents a constant, and „n‟ is the diffusional exponent, which characterizes the type of release mechanism during the dissolution process. For non-Fickian release, the value of n falls between 0.5 and 1.0; while in case of Fickian diffusion, n = 0.5; for zero-order release (case I I transport), n=1; and for supercase II transport, n > 1. In this model, a plot of log (Mt/ M∞) versus log (time) is linear.
Drug – Excipient compatibility studies
Fourier Transform Infrared (FTIR) spectroscopy The compatibility between the pure drug and excipients was detected by FTIR spectra obtained on Bruker FTIR Germany(Alpha T).The solid powder sample directly place on yellow crystal which was made up of ZnSe. The spectra were recorded over the wave number of 4000 cm -1 to 550 cm-1.
RESULTS AND DISCUSSION Analytical Method
a. Determination of absorption maxima
The standard curve is based on the spectrophotometer. The maximum absorption was observed at 287 nm.
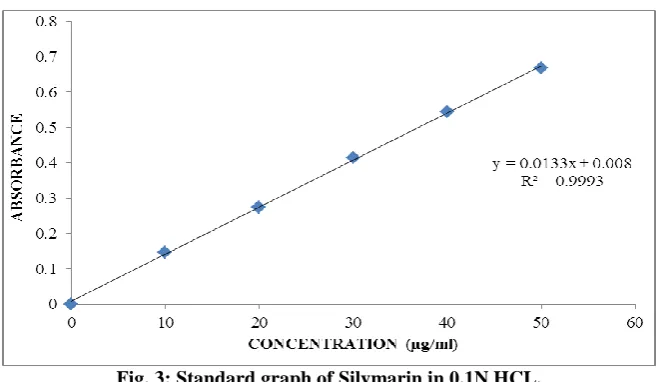
b.Calibration curve
Graphs of Silymarin was taken in 0.1N HCL (pH 1.2).
Table 6: Observations for graph of Silymarin in 0.1N HCL.
Conc [µg/mL] Abs
0 0
10 0.147
20 0.275
30 0.415
40 0.544
Fig. 3: Standard graph of Silymarin in 0.1N HCL. Standard graph of Silymarin was plotted as per the
procedure in experimental method and its linearity is shown in Table and Fig. The standard graph of Silymarin
showed good linearity with R2 of 0.999, which indicates that it obeys “Beer- Lamberts” law.
Preformulation parameters of powder blend Table 7: Pre-formulation parameters of blend.
Formulation Code
Angle of Repose
Bulk density (gm/mL)
Tapped density (gm/mL)
Carr’s index (%)
Hausner’s Ratio F1 34055‟±0.03 0.538±0.05 0.644±0.05 12.3±0.34 1.12±0.31 F2 32064‟±0.03 0.423±0.07 0.496±0.04 11.3±.13 1.14±0.23 F3 32007‟±0.02 0.512±0.05 0.597±0.08 12.1±0.43 1.14±0.13 F4 33o10‟±0.02 0.534±0.03 0.645±0.05 12.2±0.24 1.13±0.23 F5 32024‟±0.02 0.453±0.04 0.576±0.03 11.2±0.45 1.12±0.564 F6 34055‟±0.03 0.509±0.05 0.576 ±0.08 13.16 ±0.76 1.13 ± 0.48 F7 32064‟±0.03 0.568±0.05 0.640 ±0.09 11.25 ±0.72 1.12 ± 0.54 F8 32007‟±0.02 0.554±0.06 0.625 ±0.07 11.36 ±0.54 1.12 ± 0.35 F9 33o10‟±0.02 0.592±0.09 0.676 ±0.05 12.4 ± 0.33 1.14 ± 0.87 F10 32024‟±0.02 0.624±0.06 0.706 ±0.04 11.6 ± 0.64 1.13 ± 0.12 F11 33002‟±0.03 0.614 ±0.05 0.690 ±0.06 11.0 ± 0.54 1.12 ± 0.28 F12 32064‟±0.05 0.507 ±0.01 0.572 ±0.01 11.3 ±0.76 1.12 ± 0.15
Tablet powder blend was subjected to various pre-formulation parameters. The angle of repose values indicates that the powder blend has good flow properties. The bulk density of all the formulations was found to be in the range of 0.423±0.07 to 0.624±0.06 (gm/ml) showing that the powder has good flow properties. The tapped density of all the formulations was found to be in the range of 0.496±0.04 to 0.706 ±0.04 showing the powder has good flow properties. The compressibility index of all the formulations was found to be below 13 which shows that the powder has good flow properties. All the formulations has shown the hausners ratio ranging between 1.12 ± 0.15 to 1.14 ± 0.87 indicating the powder has good flow properties.
Optimization of sodium bicarbonate concentration Three formulations were prepared with varying concentrations of sodium bicarbonate by direct compression method and three more formulations were prepared by wet granulation method to compare the floating buoyancy in between direct and wet granulation
methods. The formulation containing sodium bicarbonate in 45mg concentration showed less floating lag time in wet granulation method and the tablet was in floating condition for more than 12 hours.
Quality Control Parameters For tablets
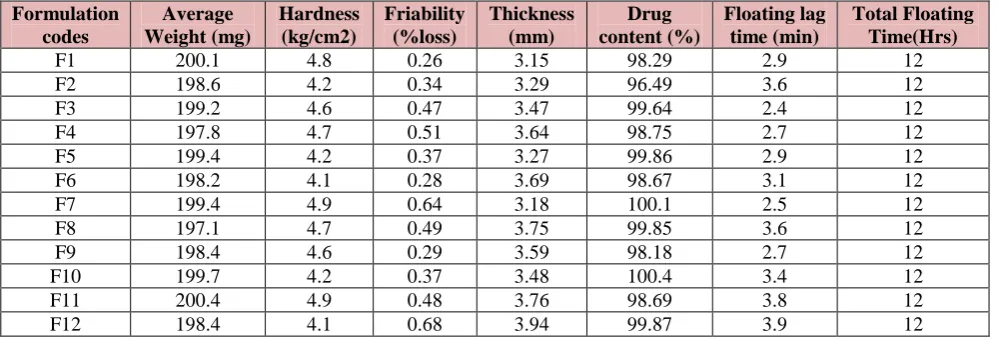
Table 8: In vitro quality control parameters.
Formulation codes
Average Weight (mg)
Hardness (kg/cm2)
Friability (%loss)
Thickness (mm)
Drug content (%)
Floating lag time (min)
Total Floating Time(Hrs)
F1 200.1 4.8 0.26 3.15 98.29 2.9 12
F2 198.6 4.2 0.34 3.29 96.49 3.6 12
F3 199.2 4.6 0.47 3.47 99.64 2.4 12
F4 197.8 4.7 0.51 3.64 98.75 2.7 12
F5 199.4 4.2 0.37 3.27 99.86 2.9 12
F6 198.2 4.1 0.28 3.69 98.67 3.1 12
F7 199.4 4.9 0.64 3.18 100.1 2.5 12
F8 197.1 4.7 0.49 3.75 99.85 3.6 12
F9 198.4 4.6 0.29 3.59 98.18 2.7 12
F10 199.7 4.2 0.37 3.48 100.4 3.4 12
F11 200.4 4.9 0.48 3.76 98.69 3.8 12
F12 198.4 4.1 0.68 3.94 99.87 3.9 12
All the parameters for tablets such as weight variation, friability, hardness, thickness, drug content were found to be within limits.
In Vitro Drug Release Studies
Table 9: Dissolution data of Floating Tablets.
Time (hr) F1 F2 F3 F4 F5 F6 F7 F8 F9 F10 F11 F12
0 0 0 0 0 0 0 0 0 0 0 0 0
0.5 4.33 9.75 15.05 12.99 15.05 5.91 2.9 0.6 8.11 6.12 8.97 7.52 1 10.31 16.35 24.04 18.85 24.04 5.91 8.2 8.50 19.64 12.23 15.97 17.50 2 17.26 25.51 32.83 24.91 32.83 18.33 13.49 16.45 24.96 17.12 21.21 22.50 3 24.41 33.38 40.52 32.57 40.52 26.23 19.52 23.81 30.27 21.37 33.48 35.70 4 31.18 37.59 46.93 36.97 46.93 32.56 28.06 34.22 35.76 25.62 38.20 39.87 5 36.13 43.27 54.26 44.11 54.26 38.96 32.11 39.15 42.17 32.47 41.58 46.22 6 42.91 48.58 60.85 49.35 60.85 45.44 40.63 49.55 48.58 47.26 46.75 52.35 7 46.93 55.17 65.79 53.21 65.79 51.94 48.67 54.89 57.19 52.00 53.69 62.35 8 55.61 60.48 70.92 63.09 70.92 61.44 55.22 59.36 66.51 58.29 59.78 69.56 9 61.09 67.99 76.23 71.58 76.23 67.85 63.76 62.82 71.01 64.39 64.92 76.58 10 69.93 72.94 80.81 79.34 80.81 75.36 68.59 67.34 79.87 72.94 68.47 82.14 11 75.51 80.81 85.75 85.74 86.75 81.93 75.15 73.94 84.59 78.8 73.41 88.67 12 80.15 85.75 90.15 94.77 98.15 89.33 79.80 85.29 89.15 84.72 79.21 92.19
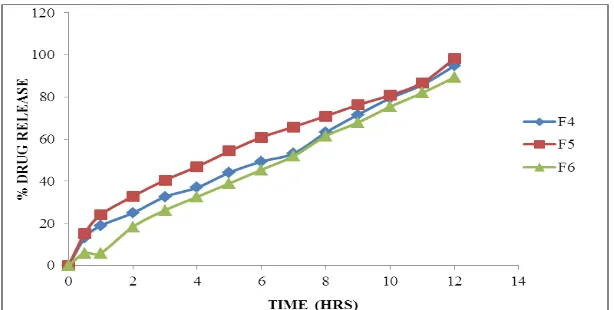
Fig. 5: Dissolution data of Silymarin Floating tablets containing HPMC K4M.
Fig. 6: Dissolution data of Silymarin Floating tablets containing Sodium CMC.
Fig. 7: Dissolution data of Silymarin Floating tablets containing Carbopol P934. From the dissolution data it was evident that the
formulations prepared with Ethyl cellulose as polymer were retarded the drug release more than 12 hours.
Whereas the formulations prepared with higher concentration of HPMC K4M retarded the drug release up to 12 hours in the concentration 30 mg. In lower concentrations the polymer was unable to retard the high drug release.
The formulations prepared with Sodium CMC showed very less drug release capacity hence they were not
considered.
Whereas the formulations prepared with higher concentration of Carbopol p 934 retarded the drug release up to 12 hours in the concentration 45 mg. In lower concentrations the polymer was unable to retard the drug release.
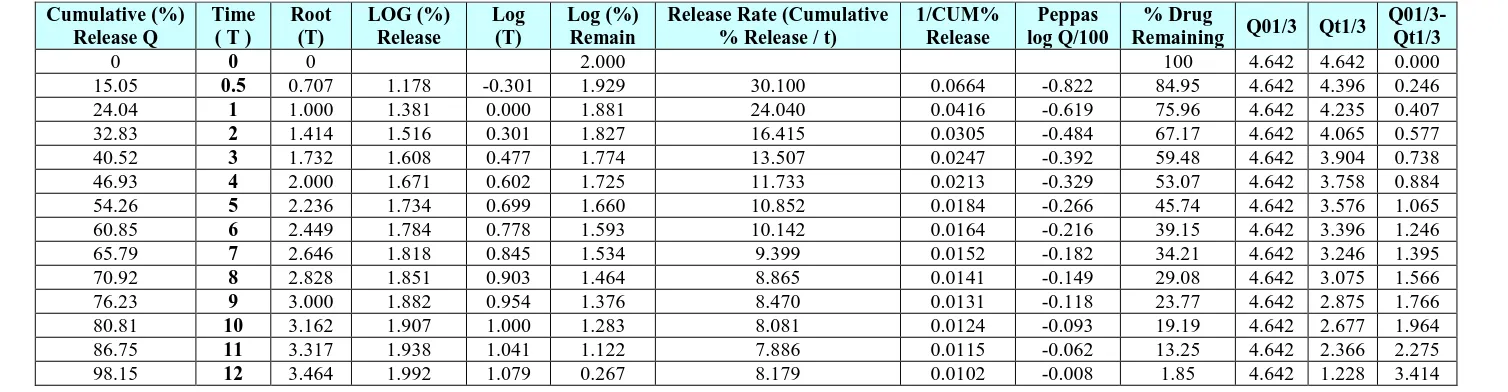
Application of Release Rate Kinetics to Dissolution Data for optimised formulation Table 10: Application kinetics for optimised formulation.
Cumulative (%) Release Q
Time ( T )
Root (T)
LOG (%) Release
Log (T)
Log (%) Remain
Release Rate (Cumulative % Release / t)
1/CUM% Release
Peppas log Q/100
% Drug
Remaining Q01/3 Qt1/3
Q01/3-Qt1/3
0 0 0 2.000 100 4.642 4.642 0.000
15.05 0.5 0.707 1.178 -0.301 1.929 30.100 0.0664 -0.822 84.95 4.642 4.396 0.246
24.04 1 1.000 1.381 0.000 1.881 24.040 0.0416 -0.619 75.96 4.642 4.235 0.407
32.83 2 1.414 1.516 0.301 1.827 16.415 0.0305 -0.484 67.17 4.642 4.065 0.577
40.52 3 1.732 1.608 0.477 1.774 13.507 0.0247 -0.392 59.48 4.642 3.904 0.738
46.93 4 2.000 1.671 0.602 1.725 11.733 0.0213 -0.329 53.07 4.642 3.758 0.884
54.26 5 2.236 1.734 0.699 1.660 10.852 0.0184 -0.266 45.74 4.642 3.576 1.065
60.85 6 2.449 1.784 0.778 1.593 10.142 0.0164 -0.216 39.15 4.642 3.396 1.246
65.79 7 2.646 1.818 0.845 1.534 9.399 0.0152 -0.182 34.21 4.642 3.246 1.395
70.92 8 2.828 1.851 0.903 1.464 8.865 0.0141 -0.149 29.08 4.642 3.075 1.566
76.23 9 3.000 1.882 0.954 1.376 8.470 0.0131 -0.118 23.77 4.642 2.875 1.766
80.81 10 3.162 1.907 1.000 1.283 8.081 0.0124 -0.093 19.19 4.642 2.677 1.964
86.75 11 3.317 1.938 1.041 1.122 7.886 0.0115 -0.062 13.25 4.642 2.366 2.275
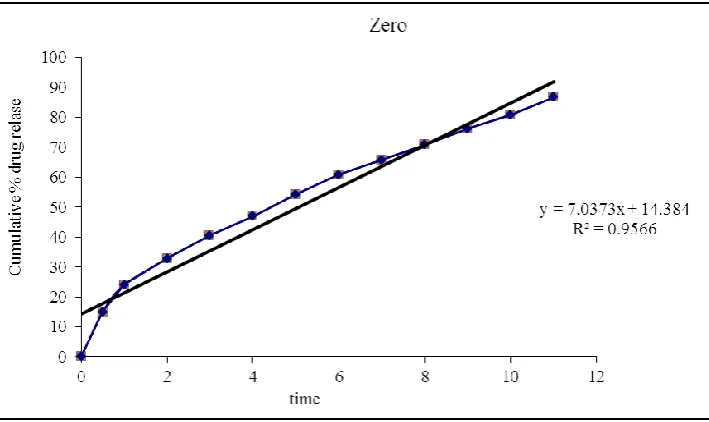
Fig. 8: Zero order release kinetics.
Fig. 9: Higuchi release kinetics.
Fig. 11: First order release kinetics.
Optimised formulation F5 was kept for release kinetic studies. From the above graphs it was evident that the formulation F5 was followed peppas release kinetics.
Drug – Excipient compatability studies Fourier Transform-Infrared Spectroscopy
Figure 12: FTIR Spectrum of pure drug.
There was no disappearance of any characteristics peak in the FTIR spectrum of drug and the polymers used. This shows that there is no chemical interaction between the drug and the polymers used. The presence of peaks at the expected range confirms that the materials taken for the study are genuine and there were no possible interactions.
Silymarin are also present in the physical mixture, which indicates that there is no interaction between drug and the polymers, which confirms the stability of the drug.
CONCLUSION
Development of Gastro retentive floating drug delivery of Silymarin tablets is to provide the drug action up to 12 hours. Gastro retentive floating tablets were prepared by direct compression method using various polymers like Ethyl cellulose, HPMC K4M, Sodium CMC, Carbopol p934. The formulated gastro retentive floating tablets were evaluated for different parameters such as drug excipient compatability studies, weight variation, thickness, hardness, content uniformity, In vitro Buoyancy studies, In vitro drug release studies performed in 0.1N HCL for 12 hrs and the data was subjected to zero order, first order, Higuchi release kinetics and karsmayer peppas graph. The following conclusions could be drawn from the results of various experiments.
FTIR studies concluded that there was no interaction between drug and excipients.
The physico-chemical properties of all the formulations prepared with different polymers Ethyl cellulose, HPMC K4M, Sodium CMC, Carbopol p934 were shown to be within limits.
Quality control parameters for tablets such as weight variation, Hardness, Friability, thickness, drug content and floating lag time were found to be within limits.
In vitro drug release studies were carried out for all prepared formulation and from that concluded F5 formulation has shown good results.
Finally concluded release kinetics to optimised formulation (F5) has followed peppas release kinetics.
Present study concludes that gastro retentive floating system may be a suitable method for Silymarin administration.
ACKNOWLEDGEMENT
Authors express their sincere thanks to our principal Dr. M. Dhanalakshmi, M.Pharm,Ph.D. KLR Pharmacy College, Palvoncha and the Management of KLR Pharmacy College for providing necessary facilities to carry out the research work.
REFERENCES
1. Deshpande A.A, Shah N.H, Rhodes C.T, Malick W., Development of a novel controlled-release system for gastric retention. Pharm Res, 1997; 4: 815-819.
2. Bhavana V, Khopade A.J, Jain W.D, Shelly and Jain N.K., Targeted Oral Drug Delivery, Indian drugs., 1996; 33: 365-373.
3. Pathan Azhar Khan, Rahul Thube, Rukhsana A. Rab. Formulation development and evaluation of silymarin gel for psoriasis treatment. Journal of Innovations in Pharmaceuticals and Biological Sciences, 2014; 1(1): 21-26.
4. Tanmoy Ghosh, Amitava Ghosh J. Thimmasetty Amith Kumar B Sushil Kumar L. Development and Biopharmaceutical Evaluation of Controlled Porosity Osmotic Formulations of Silymarin β-Cyclodextrin Inclusion Complex. International journal of pharmacy and pharmaceutical research, August 2016; 7(1).
5. Rajeev Garg and GD Gupta. Gastroretentive Floating Microspheres of Silymarin: Preparation and In Vitro Evaluation. Tropical Journal of Pharmaceutical Research, February 2010; 9(1): 59-66.
6. R.B.Desi Reddy, Malleswari.K, Lakshmi narayana.N. Formulation and in vitro evaluation of silymarin floating matrix tablet. International Journal of Pharmacy and Pharmaceutical Sciences, 2012; 4(5).
7. Soni RP, Patel AV, Patel RB, Patel MR, Patel KR, Patel NM. Gastroretentive Drug Delivery Systems: A Review. International Journal of Pharma World Research, 2011; 2(1): 1- 24.
8. Dey D, Pattnaik GD, Sahoo B. An Overview on Gastroretentive Drug delivery systems. PharmaTutor, 2011; 1-3.
9. Dolas RT, Hosmani A, Bhandari A, Kumar B, Somvanshi S. Novel Sustained Release Gastroretentive Drug Delivery System: A Review. International Journal of Pharma Research and Development, 2011; 2(11): 26-41.
10. Brahma N. Singh, Kwon H. Kim., Floating drug delivery systems - an approach to oral controlled drug delivery via gastric retention, Journal of Controlled Release, February 2000; 63(3): 235-259. 11. Shukla Shruti et al., A Review On Recent
Advancement of Stomach Specific Floating Drug Delivery System, IJPBA, Nov–Dec 2011; 2(6): 1561-1568.
12. Deshpande A.A, Shah N.H, Rhodes C.T, Malick W., Development of a novel controlled-release system for gastric retention. Pharm Res., 1997; 4: 815-819. 13. Sarvesh D Parsekar, Shruti Prabhu, Amitha Shetty,
Mohd Azharuddin and AR. Shabaraya. A Brief Review on Floating Bilayer Tablet as a Convenient Gastroretentive Drug Delivery System, Apr-Jun 2014; 3(2).
14. Dutta P, Sruti J, Patra NC and Rao BME. Floating microspheres: Recent trends and development of gastroretentive floating drug delivery system. Int J Pharm Sci NanoTech, 2011; 4(1): 1296-306. 15. Garg.R and Gupta. GD., Progress in controlled