O R I G I N A L A R T I C L E
Spatial variability, structure and composition of crustose algal
communities in
Diadema africanum
barrens
Carlos Sangil•Marta Sanso´n• Tania Dı´az-Villa•
Jose´ Carlos Herna´ndez•Sabrina Clemente •
Julio Afonso-Carrillo
Received: 28 September 2013 / Revised: 26 May 2014 / Accepted: 27 May 2014 / Published online: 8 June 2014 ÓSpringer-Verlag Berlin Heidelberg and AWI 2014
Abstract Crustose algal communities were studied in
Diadema africanumurchin barrens around Tenerife
(Can-ary Islands, NE Atlantic). A hierarchical nested sampling design was used to study patterns of community variability at different spatial scales (sectors, three sides of the island; sites within each sector, 5–10 km apart; stations within each site, 50–100 m apart). Although noncrustose species contributed the most to community richness, cover was dominated by crustose forms, like the coralline algae
Hy-drolithon farinosum, H. samoe¨nse, H. onkodes,
Neogoni-olithon orotavicumand N. hirtum, and the phaeophycean
Pseudolithoderma adriaticum. The structure of these
communities showed high spatial variability, and we found differences in the structure of urchin barrens when com-pared across different spatial scales. Multivariate analysis showed that variability in community structure was related to the five environmental variables studied (wave exposure, urchin density, substrate roughness, productivity and depth). Wave exposure was the variable that contributed most to community variability, followed by urchin density and substrate roughness. Productivity and depth had lim-ited influence. The effects of these variables differed
depending on the spatial scale; wave exposure and pro-ductivity were the main variables influencing community changes at the largest scale (between different sectors of the island), while D. africanum density, roughness and depth were the most influential at medium and small scales.
Keywords Crustose coralline algaeSea urchin
Subtidal rocky reefsCanary IslandsSubtropical Eastern Atlantic
Introduction
Crustose algal communities are found within a range of habitats from the intertidal to deepwaters (Kaehler and Williams 1996; Aponte and Ballantine 2001; Benedetti-Cecchi et al.2003; Piazzi et al.2004) and tend to dominate benthic communities where environmental factors (e.g., wave exposure, desiccation, irradiance, sedimentation) are extreme (Adey 1970; Daume et al. 1999; Fabricius and De’ath 2001). On shallow, rocky subtidal substrates, intense grazing causes a reduction of upright algae (Hay
1981; Carpenter 1986; Andrew 1993) and the crustose morphotype has a major competitive advantage since her-bivores are unable to consume crustose algae easily.
In tropical regions, crustose algae are a key functional group in coral reef systems and their abundance can directly regulate the abundance of corals, the principal ecological engineers in these ecosystems (Harrington et al.
2004; Titlyanov et al.2005; Becerro et al.2006; O’Learly et al. 2012). In undisturbed tropical reefs, high levels of grazing by fishes and urchins are common; this grazing prevents upright algae from becoming dominant and pro-motes scleractinian coral reef formation (Hay 1997; McClanahan et al. 2000; Belliveau and Paul2002; Littler Communicated by F. Weinberger.
C. Sangil (&)M. Sanso´nT. Dı´az-VillaJ. Afonso-Carrillo Departamento de Biologı´a Vegetal, Universidad de La Laguna, 38071 La Laguna, Tenerife, Canary Islands, Spain
e-mail: [email protected]
C. Sangil
Smithsonian Tropical Research Institute, Smithsonian Institution, 0843-03092 Ancon, Panama City, Panama
J. C. Herna´ndezS. Clemente
Departamento de Biologı´a Animal, Universidad de La Laguna, 38206 La Laguna, Tenerife, Canary Islands, Spain
et al. 2006). In contrast, in subtropical and temperate regions, high abundances of crustose algae and high levels of grazing are symptoms of imbalance in the organization of the benthic community (e.g., Sala et al.1998; Herna´ndez et al.2008). In subtropical and temperate regions, upright algae are the main ecological engineers so their removal by sea urchins, the key herbivores, shapes organization of the entire community. Crustose algal communities, also named urchin barrens, are considered degraded habitats, and their presence on subtidal rocky bottom shows that excessive urchin grazing has taken place (Sala et al.1998; Konar and Estes 2003; Shears and Babcock 2003; Herna´ndez et al.
2008). Demographic explosions of sea urchins are thought to occur when urchin predators are removed by overfishing (Pinnegar et al.2000; Shears and Babcock2003; Clemente et al.2010).
A number of the ecological processes that determine where crustose algal communities flourish in shallow waters have been identified. However, little is known about the spatial variability of these urchin barrens, and how their structure change. Knowledge is incomplete mainly due to difficulties identifying individual species, not only in situ but also in the laboratory. Ecological studies frequently group them together (e.g., ‘crustose algae’ or ‘crustose coralline algae’; Littler 1972; Steneck and Paine 1986; Steneck and Dethier 1994; Daume et al. 1999). Some preliminary studies have shown that the structure of these communities may be subject to significant variation (Hackney et al.1989). Like in upright algal communities, the structure of crustose algal communities can change according to the herbivore grazing pressure (Wright et al.
2005).
In the Canary Islands, urchin barrens have been created by the grazing activity of one specific species of sea urchin,
Diadema africanum, the dominant herbivore in this
region’s shallow rocky habitats (Herna´ndez et al. 2008). The transition from upright seaweed beds to barrens is related to an increase in sea urchin density (Tuya et al.
2004; Herna´ndez et al.2008). When sea urchin density has decreased in the Canary Islands, either as a result of predator recovery, or of experiments that have excluded sea urchins from specific areas, the habitat has reverted back to upright seaweed beds (Brito et al.2004; Sangil et al.2012). Urchin barren communities, mainly consisting of crustose species, were initially considered to have poor species richness compared to upright seaweed beds (Sangil et al.
2011). Although crustose algae are usually associated with barren habitats, Sangil et al. (2011,2014) found that, as a whole, crustose forms are also vulnerable toD. africanum
grazing; an increase in sea urchin population density induces a decrease in crustose algal cover. Here, the urchin barrens around Tenerife Island were studied in detail, including the identification of crustose algal species, to
identify spatial patterns in the community structure of crustose algae. In particular, by means of a fully nested hierarchical sampling design, we tested the following hypotheses:
1. Algal communities in barrens around Tenerife show variability at different spatial scales (from 5–10 km to 50–100 m).
2. Variability in community structure is related to a number of environmental factors which vary in their influence across different spatial scales.
3. Variability in community composition is more depen-dent on variability in species abundances than on variability in species composition.
Materials and methods
Study area
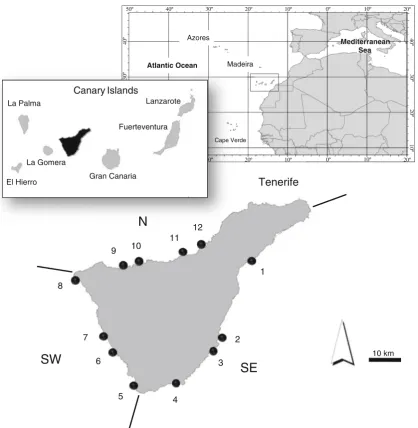
Fieldwork was conducted by SCUBA divers in urchin barrens at 10–20 m depth around Tenerife Island (28°
24.330N, 16° 18.860W), Canary Islands (Fig.1), during spring–summer 2004. The study was performed across three different spatial scales: sectors, sites and stations. Sectors were defined as stretches of coastline exposed to different oceanographic conditions; wave exposure in particular differs between coasts facing to the SE, SW and N of the island. Around Tenerife, NE waves, with an annual mean height of 1.4 m, are frequent throughout the year but strongest between spring and summer. These NE waves are associated with NNE and NE winds and affect both the N and SE coasts of Tenerife. In autumn and winter, strong waves 3 m in height, from the NNW-NW, affect SW Tenerife (Garcı´a-Braun and Molina 1988). According to a zoning established by Pe´rez et al. (2003), SE Tenerife is minimally exposed to waves, the SW is semi-exposed and the N is highly exposed. The concen-tration of nutrients also varies between the three sectors and is higher on the N coast compared to SE and SW coasts (Barton et al. 1998). In each of these sectors, four sites were chosen (5–10 km apart), and within each site two sampling stations were selected (50–100 m apart). Data collection
station and analyzed in the laboratory. Macroalgal species were identified in situ where possible, only if necessary samples were collected for later identification in the labo-ratory, following Afonso-Carrillo and Sanso´n (1999). Fil-amentous algae were treated as a single group, and the crustose coralline algae (CCA) were identified in the lab-oratory. For CCA identification, samples of the rock sur-face (10910 cm) were extracted from each quadrat using hammer and chisel and preserved in 5 % formalin–sea-water solution. CCA identification was performed by examining the cytological features, the shape of concep-tacles and the vegetative structure of the algae, viewed intact and also in radial longitudinal sections made by hand with a razor blade (obtained from selected decalcified
fragments stained in 1 % aniline blue in distilled water) (Afonso-Carrillo 1984; Woelkerling 1988; Irvine and Chamberlain 1994). CCA were separated into three mor-phological groups: (1) Hydrolithon onkodes and
Titano-derma polycephalum which are large and exhibit
morphological features that allow identification in situ (Afonso-Carrillo1982; Afonso-Carrillo and Sanso´n1999); (2) thin crustose coralline algae (thin CCA) including small thin species (e.g., Hydrolithon farinosum, H. samoe¨nse,
Pneophyllum fragile) that have very few cell layers and
each of these layers is\200 lm in thickness (Irvine and Chamberlain1994; Reyes and Afonso-Carrillo1995); and (3) thick crustose coralline algae (thick CCA) including larger species (e.g.,Lithophyllum vickersiae,Mesophyllum
0º 10º 20º
10º 20º
0º
30º
40º
50º 40º 30º 20º 10º 0º 10º 20º
10º
20º
30º
40º
Canary Islands
Tenerife
N
SW
SE
12
6
5 4
3 2
1 9
8
7
10 11
Cape Verde La Palma
El Hierro La Gomera
Gran Canaria Fuerteventura
Lanzarote
Atlantic Ocean Madeira
Azores Mediterranean
Sea
10 km
Fig. 1 Location of study area and sampling sites: Southeast Sector [1. Boca Cangrejo, 2. Punta del Porı´s, 3. Abades, 4. La Tejita], Southwest Sector [5. El Palm-Mar,6. El Balito,7. La Tixera,8. Teno]
expansum, Neogoniolithon hirtum, N. orotavicum,
Phymatolithon lenormandii) with a larger number of cell
layers all of which are 200–1,000lm in thickness (Afonso-Carrillo1982,1984; Athanasiadis and Neto2010).
In conjunction with the algal data, information about five different environmental variables was collected for each station: urchin density, wave exposure, productivity, depth and substrate roughness. Urchin density was calcu-lated using the belt-transect method described by Herna´n-dez et al. (2008), whereby individuals were counted in five replicates of 1092 m transects haphazardly placed par-allel to the shoreline. Wave exposure data were obtained for each study site from a database containing information about average wave power (kW/m) for the Spanish coast (www.enola.ihcantabria.com). Productivity data, estimated using Chlorophyll a concentration (mg m-3), were obtained for each site from the Bio-Oracle database (Ocean Rasters for Analysis of Climate and Environment) (Tyberghein et al.2012). Water depth was read from a dive computer for each quadrat. The roughness of the substrate was estimated for each quadrat using the rope and chain method (Luckhurst and Luckhurst 1978); dividing the length of one side of the quadrat (e.g., 50 cm) by the length of the rock relief under that side of the quadrat (e.g., 50 cm for a completely flat surface, or 100 cm for a more undu-lating or ‘rough’ surface). The length of the rock relief beneath the quadrat was measured using a flexible tape that allowed hollows and protrusions in the rock to be accounted for.
Data analysis
Spatial differences in community structure and species composition were examined by permutational analysis of variance (PERMANOVA; Anderson et al. 2008), using both cover and presence/absence data. Relevance of species abundance versus species identity was used to compare community organization. The resemblance matrices were obtained using Bray–Curtis dissimilarities for the algal datasets. The design consisted of a three-way analysis, with ‘Sector’ (3 levels: SE, SW, N) treated as a fixed factor, ‘Site’ (12 levels) as a random factor nested in ‘Sector’, and ‘Station’ (24 levels) as a random factor nested in ‘Site’ and ‘Sector’. A posteriori pairwise comparisons (Anderson 2004) per ‘Sector’, ‘Site’ and ‘Station’ were performed in some cases. Pseudo-F values were obtained from a maximum of 4,999 random per-mutations. To visualize patterns within the percentage cover and presence/absence data, non-metric multidi-mensional scaling ordinations (nMDS) were used (Clarke and Gorley 2006).
In addition, cover of dominant algal taxa ([1 % mean cover) was examined using permutational ANOVAs
(Anderson et al. 2008). Resemblance matrices were gen-erated using Euclidean distances of data (Anderson 2001,
2004; Anderson and ter Braak2003). The design consisted of a three-way analysis, with ‘Sector’ treated as a fixed factor, ‘Site’ as a random factor nested in ‘Sector’, and ‘Station’ as a random factor nested in ‘Site’ and ‘Sector’. A posteriori pairwise comparisons were performed in some cases. For these species, variance components (Underwood
1997) were calculated to estimate the contribution of each spatial factor (sector, site, station) to the variance in species abundance. The method used to estimate the variance components was the minimum norm quadratic unbiased estimation method (MINQUE). This technique was used because the data did not satisfy the normality requirements, and it was developed originally to the estimation of vari-ance components in random effects models (Rao1971).
In order to identify the contribution of each environ-mental variable to spatial variability of algae in urchin barren communities, a distance-based linear model rou-tine (DistLM) (Legendre and Anderson 1999) was applied. This method performs multivariate multiple regressions on the basis of any distance measure and performs a forward selection of the predictor variables, either individually or in specified sets, with tests by permutation. In our study, the DistLM analysis was based on similarity matrices of algal cover data and data from five environmental variables (urchin density, wave exposure, productivity, depth and substrate roughness). The method used stepwise selection, an adjusted R2
criterion and 9,999 permutations. Prior to the DistLM analysis, the draftsman plot method, with the corre-sponding Pearson’s correlation coefficients, was used to explore the relationships between environmental vari-ables (Clarke and Gorley 2006). The draftsman plot test was performed so that any environmental variables that were strongly correlated could be excluded; as all cor-relations were low (R\0.5), no variables were excluded from the DistLM. Following recommendations by Clarke and Gorley (2006), algal cover data were square root transformed and environmental variables data were nor-malized. A distance-based redundancy analysis (dbRDA) was used to visualize the relationship between algal data and environmental data according to the multivariate regression model and multidimensional space generated by the DistLM analysis in a simplified, two-dimensional plot (McArdle and Anderson 2001). These analyses show the percentage cover of the most abundant taxa (cover[1 %).
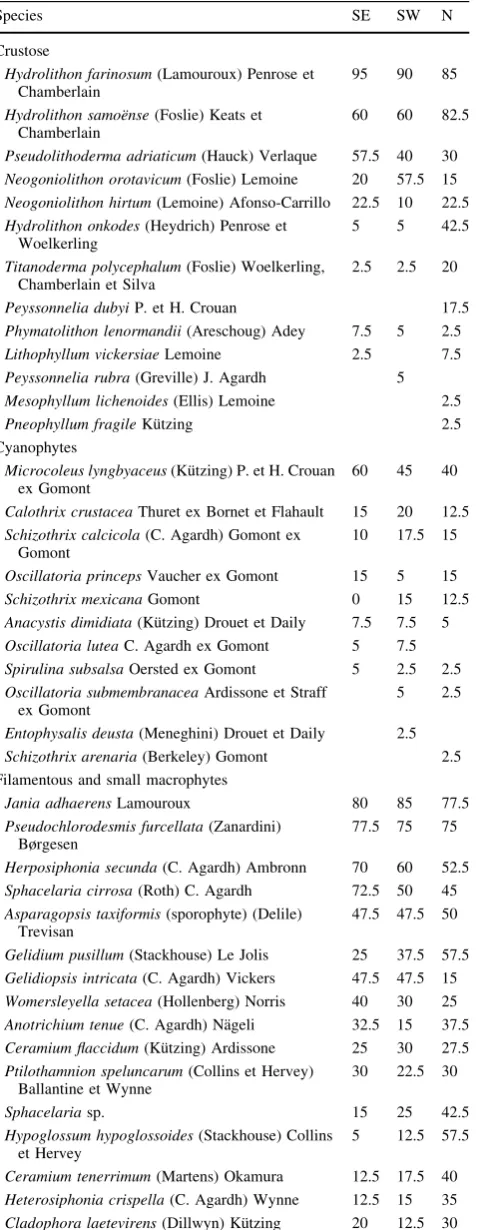
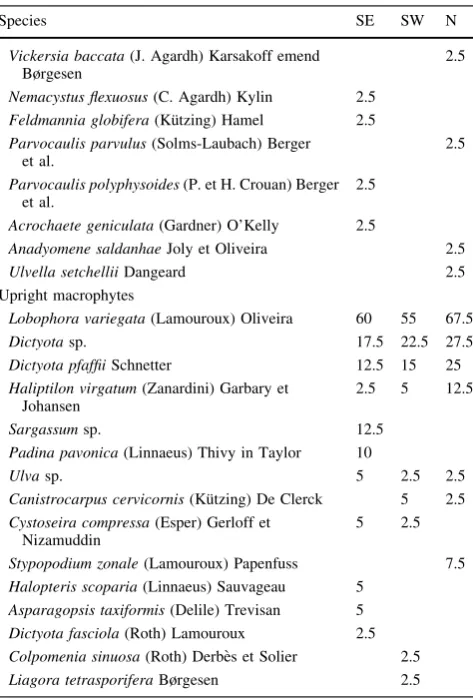
Table 1 Algae species found in urchin barrens studied in 12 sites around Tenerife Island, including the relative frequency (%) per sector
Species SE SW N
Crustose
Hydrolithon farinosum(Lamouroux) Penrose et Chamberlain
95 90 85
Hydrolithon samoe¨nse(Foslie) Keats et Chamberlain
60 60 82.5
Pseudolithoderma adriaticum(Hauck) Verlaque 57.5 40 30
Neogoniolithon orotavicum(Foslie) Lemoine 20 57.5 15
Neogoniolithon hirtum(Lemoine) Afonso-Carrillo 22.5 10 22.5
Hydrolithon onkodes(Heydrich) Penrose et Woelkerling
5 5 42.5
Titanoderma polycephalum(Foslie) Woelkerling, Chamberlain et Silva
2.5 2.5 20
Peyssonnelia dubyiP. et H. Crouan 17.5
Phymatolithon lenormandii(Areschoug) Adey 7.5 5 2.5
Lithophyllum vickersiaeLemoine 2.5 7.5
Peyssonnelia rubra(Greville) J. Agardh 5
Mesophyllum lichenoides(Ellis) Lemoine 2.5
Pneophyllum fragileKu¨tzing 2.5 Cyanophytes
Microcoleus lyngbyaceus(Ku¨tzing) P. et H. Crouan ex Gomont
60 45 40
Calothrix crustaceaThuret ex Bornet et Flahault 15 20 12.5
Schizothrix calcicola(C. Agardh) Gomont ex Gomont
10 17.5 15
Oscillatoria princepsVaucher ex Gomont 15 5 15
Schizothrix mexicanaGomont 0 15 12.5
Anacystis dimidiata(Ku¨tzing) Drouet et Daily 7.5 7.5 5
Oscillatoria luteaC. Agardh ex Gomont 5 7.5
Spirulina subsalsaOersted ex Gomont 5 2.5 2.5
Oscillatoria submembranaceaArdissone et Straff ex Gomont
5 2.5
Entophysalis deusta(Meneghini) Drouet et Daily 2.5
Schizothrix arenaria(Berkeley) Gomont 2.5 Filamentous and small macrophytes
Jania adhaerensLamouroux 80 85 77.5
Pseudochlorodesmis furcellata(Zanardini) Børgesen
77.5 75 75
Herposiphonia secunda(C. Agardh) Ambronn 70 60 52.5
Sphacelaria cirrosa(Roth) C. Agardh 72.5 50 45
Asparagopsis taxiformis(sporophyte) (Delile) Trevisan
47.5 47.5 50
Gelidium pusillum(Stackhouse) Le Jolis 25 37.5 57.5
Gelidiopsis intricata(C. Agardh) Vickers 47.5 47.5 15
Womersleyella setacea(Hollenberg) Norris 40 30 25
Anotrichium tenue(C. Agardh) Na¨geli 32.5 15 37.5
Ceramium flaccidum(Ku¨tzing) Ardissone 25 30 27.5
Ptilothamnion speluncarum(Collins et Hervey) Ballantine et Wynne
30 22.5 30
Sphacelariasp. 15 25 42.5
Hypoglossum hypoglossoides(Stackhouse) Collins et Hervey
5 12.5 57.5
Ceramium tenerrimum(Martens) Okamura 12.5 17.5 40
Heterosiphonia crispella(C. Agardh) Wynne 12.5 15 35
Cladophora laetevirens(Dillwyn) Ku¨tzing 20 12.5 30
Table 1 continued
Species SE SW N
Callithamniella tingitana(Schousboe ex Bornet) Feldmann-Mazoyer
2.5 5 50
Dasya hutchinsiaeHarvey 10 12.5 27.5
Laurenciaspp. 10 15 17.5
Apoglossum ruscifolium(Turner) J. Agardh 7.5 27.5
Griffithsia phyllamphoraJ. Agardh 5 30
Polysiphonia funebrisDe Notaris 2.5 5 25
Pseudotetraspora marinaWille 12.5 15 2.5
Spermothamnion flabellatumBornet 12.5 2.5 10
Ochlochaete hystrixThwaites ex Harvey 10 7.5 7.5
Chaetomorpha aerea(Dillwyn) Ku¨tzing 15 7.5
Acrochaetium gracileBørgesen 2.5 7.5 10
Crouania attenuata(C. Agardh) J. Agardh 2.5 12.5 5
Erythrotrichia carnea(Dillwyn) J. Agardh 7.5 5 7.5
Grallatoria reptansHowe 5 12.5
Ceramium codii(Richards) Mazoyer 2.5 5 7.5
Phaeophila dendroides(P. et H. Crouan) Batters 5 5 5
Centroceras clavulatum(C. Agardh) Montagne 7.5 5
Polysiphoniasp. 2.5 5 5
Taenioma nanum(Ku¨tzing) Papenfuss 12.5
Blastophysa rhizopusReinke 5 5 2.5
Ernodesmis verticillata(Ku¨tzing) Børgesen 10 2.5
Polysiphonia ferulaceaSuhr ex J. Agardh 2.5 7.5
Spongoclonium caribaeum(Børgesen) Wynne 5 5
Derbesia tenuissima(Moris et De Notaris) P. et H. Crouan
10
Acrochaetium daviesii(Dillwyn) Na¨geli 2.5 5
Amphiroa fragilissima(Linnaeus) Lamouroux 2.5 5
Champia parvula(C. Agardh) Harvey 7.5
Diplothamnion jolyiHoek 5 2.5
Platysiphonia caribaeaBallantine et Wynne 7.5
Polysiphonia flocculosa(C. Agardh) Ku¨tzing 5 2.5
Hincksia mitchelliae(Harvey) Silva 7.5
Sphacelaria rigidulaKu¨tzing 2.5 2.5 2.5
Myrionemasp. 2.5 5
Feldmannia irregularis(Ku¨tzing) Hamel 5 2.5
Anotrichium furcellatum(J. Agardh) Baldock 2.5 2.5
Ceramium diaphanum(Lightfoot) Roth 5
Cottoniella filamentosa(Howe) Børgesen 5
Dasya crouanianaJ. Agardh 5
Neosiphonia sphaerocarpa(Børgesen) Kim et Lee 5
Wrangelia argus(Montagne) Montagne 5
Sphacelaria plumulaZanardini 2.5 2.5
Bryopsis plumosa(Hudson) C. Agardh 2.5 2.5
Acrosorium ciliolatum(Harvey) Kylin 2.5
Antithamnionella boergesenii(Cormaci et Furnari) Athanasiadis
2.5
Aphanocladia stichidiosa(Funk) Ardre´ 2.5
Botryocladia boergeseniiFeldmann 2.5
Callithamnion tetragonum(Withering) Gray 2.5
Erythrocladia irregularisRosenvinge 2.5
Nitophyllum punctatum(Stackhouse) Greville 2.5
Results
Algal community composition
A total of 113 taxa were identified in the subtidal algal communities (Table1). Thirteen crustose algae were present, and among themHydrolithon farinosum,H. sam-oe¨nse,Pseudolithoderma adriaticum,Neogoniolithon
oro-tavicumandN. hirtumwere the species that occurred most
frequently. Eleven cyanophytes were identified, including
Microcoleus lyngbyaceus,Calothrix crustacea,Schizothrix calcicola,S. mexicanaandOscillatoria princeps. Seventy-four filamentous or small macrophytes were observed includingJania adhaerens,Pseudochlorodesmis furcellata,
Herposiphonia secunda,Sphacelaria cirrosa and the
spo-rophytic phase ofAsparagopsis taxiformis. Fifteen upright macrophytes were also identified, including Lobophora variegata, Dictyota pfaffii, Dictyotasp., Haliptilon
virga-tumandSargassumsp. Almost 97 % of the total cover was
made up of algae from six taxa: thick CCA (mean cover 29.65 %), thin CCA (16.90 %), Hydrolithon onkodes
(8.23 %), Pseudolithoderma adriaticum (2.74 %),
Lobo-phora variegata (1.97 %) and filamentous Ceramiales
(1.13 %). None of the remaining algal species exceeded 1 % of total percentage cover (Table2).
Spatial variability of algal communities
Analyses carried out on the dataset for total algal cover showed significant differences between sectors, sites and stations (‘Sector’: Pseudo-F=3.320, p =0.008; ‘Site’: Pseudo-F=2.888, p=0.001; ‘Station’: Pseudo
-F=9.324, p=0.001). A posteriori tests for the term ‘Sector’ found differences between SE and N (t=2.560,
p =0.015) and between SW and N (t=1.929,
p =0.022). Analyses of the algal presence/absence dataset showed significant differences between sectors and sites (‘Sector’: Pseudo-F=1.660, p =0.023; ‘Site’: Pseudo
-F=2.070, p=0.002). A posteriori tests for the term ‘Sector’ showed differences between SE and N sectors (t=1.679, p =0.009), and between SW and N sectors (t=1.543, p=0.026). MDS analyses (Fig.2) of both algal cover and algal presence/absence datasets showed that samples from the N sector differed from both SE and SW sector samples. Between sites, the dissimilarity was higher in algal cover data (Fig.2a) than in presence/ absence data (Fig.2b).
The percentage cover of the most abundant algae (mean cover[1 %) differed between the different spa-tial scales (Fig. 3a). Thin CCA differed between sectors
(Pseudo-F=4.059, p=0.049) and stations (Pseudo
-F=10.396, p\0.001); the cover of thin CCA was higher in the SE and SW sectors than in the N sector (Fig.3a). Thick CCA differed significantly between sites
(Pseudo-F=4.507, p=0.004) and stations (Pseudo
-F=11.899, p\0.001); the cover between sites within each sector was highly variable (Fig.3a). Hydrolithon onkodes differed for all spatial scales (‘Sector’: Pseudo
-F=17.860, p=0.002; ‘Site’: Pseudo-F=3.686,
p =0.018; ‘Station’: Pseudo-F=4.276, p\0.001). In the SE and SW sectors, H. onkodes was not recorded, while within sector N the cover was highly variable between sites. Pseudolithoderma adriaticum and
Lobo-phora variegata differed between sites and stations
(P. adriaticum ‘Site’: Pseudo-F=3.264, p =0.032;
‘Station’: Pseudo-F=45.623, p\0.001; L. variegata
‘Site’: Pseudo-F=4.547, p=0.009; ‘Station’: Pseudo
-F=3.323, p\0.001). Filamentous Ceramiales differed only between stations (Pseudo-F=11.109, p\0.001). Components of variance (Fig. 3b) showed the variance associated with each significant term. For thin CCA, the highest relative importance of variance was associated with the factor ‘Station’, followed by ‘Sector’. Percent-age cover of thick CCA, P.adriaticum andL.variegata,
Table 1continued
Species SE SW N
Vickersia baccata(J. Agardh) Karsakoff emend Børgesen
2.5
Nemacystus flexuosus(C. Agardh) Kylin 2.5
Feldmannia globifera(Ku¨tzing) Hamel 2.5
Parvocaulis parvulus(Solms-Laubach) Berger et al.
2.5
Parvocaulis polyphysoides(P. et H. Crouan) Berger et al.
2.5
Acrochaete geniculata(Gardner) O’Kelly 2.5
Anadyomene saldanhaeJoly et Oliveira 2.5
Ulvella setchelliiDangeard 2.5 Upright macrophytes
Lobophora variegata(Lamouroux) Oliveira 60 55 67.5
Dictyotasp. 17.5 22.5 27.5
Dictyota pfaffiiSchnetter 12.5 15 25
Haliptilon virgatum(Zanardini) Garbary et Johansen
2.5 5 12.5
Sargassumsp. 12.5
Padina pavonica(Linnaeus) Thivy in Taylor 10
Ulvasp. 5 2.5 2.5
Canistrocarpus cervicornis(Ku¨tzing) De Clerck 5 2.5
Cystoseira compressa(Esper) Gerloff et Nizamuddin
5 2.5
Stypopodium zonale(Lamouroux) Papenfuss 7.5
Halopteris scoparia(Linnaeus) Sauvageau 5
Asparagopsis taxiformis(Delile) Trevisan 5
Dictyota fasciola(Roth) Lamouroux 2.5
Colpomenia sinuosa(Roth) Derbe`s et Solier 2.5
was associated with the factor ‘Site’, followed by the factor ‘Station’. For H. onkodes, ‘Sector’ was the most important factor.
Relationships between algal community structure and environmental variables
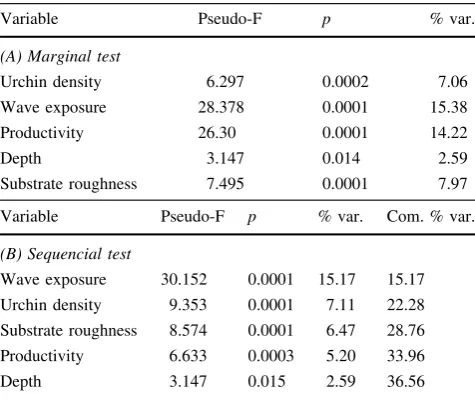
The DistLM analysis detected significant variation between community structure and all of the environmental variables (Table3). The marginal test (Table 3a) examined the sig-nificant variation between algal community versus each separate environmental variable in turn, and found com-munity variation was explained to each variable as follows: wave exposure (15.38 %), productivity (14.22 %), sub-strate roughness (7.97 %), Diadema africanum density (7.06 %) and depth (2.59 %). The sequential test (Table3b), which tested the effect of all the environmental variables together, found the following contribution: wave exposure (15.17 %), D. africanum density (7.11 %),
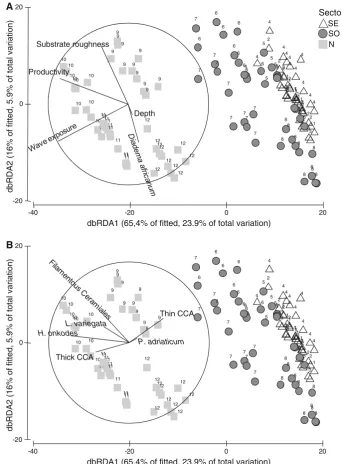
substrate roughness (6.47 %), productivity (5.20 %) and depth (2.59 %). These five environmental variables explained 36.56 % of the total variability. The dbRDA analysis (Fig.4a) showed that the wave exposure and productivity were partially negatively correlated with the first axis. Substrate roughness was partially positively correlated with the second axis, while urchin density and depth were partially negatively correlated with the second axis. The ordination plot also shows that samples from different sectors were separated along the first axis, while the samples from different sites were mainly ordered along the second axis. The overlaid trajectory of variation in algal cover (Fig.4b) showed thatHydrolithon onkodesincreased its cover along negative values of the first axis.Lobophora
variegataand filamentous Ceramiales increased their cover
following negative values of the first axis and positive values of the second axis. Thick CCA showed a partial correlation with negative values of the first axis and with negative values of the second axis. Thin CCA and
Table 2 Mean percent cover (±s.e.) and percentage of contribution to total cover of the most abundant algae found in urchin barrens of Tenerife Island, and mean percent cover by sectors [SE=Southeast, SW=Southwest, N=North]
Taxa Cover % Contr. SE SW N
Crustose
Thick CCA 29.65±2.51 47.29 17.43±3.26 24.43±3.86 47.10±4.46
Thin CCA 16.90±1.19 26.95 22.63±1.55 19.08±2.42 9.00±1.51
Hydrolithon onkodes 8.23±1.60 13.12 24.68±3.64
Pseudolithoderma adriaticum
2.74±0.64 4.37 1.88±0.58 5.93±1.74 0.43±0.07
Titanoderma polycephalum
0.17±0.07 0.27 0.50±0.21
Peyssonneliaspp. 0.01±0.008 0.01 0.03±0.02
Filamentous and small macrophytes
Filamentous Ceramiales 1.13±0.20 1.80 0.70±0.20 0.73±0.15 1.98±0.54
Pseudochlorodesmis furcellata
0.41±0.76 0.65 0.48±0.18 0.35±0.09 0.40±0.09
Jania adhaerens 0.58±0.09 0.92 0.85±0.21 0.58±0.15 0.33±0.08
Ernodesmis verticillata 0.06±0.03 0.09 0.18±0.08
Gelidiopsis intricata 0.05±0.02 0.07 0.03±0.02 0.10±0.06 0.03±0.02
Chaetomorpha aerea 0.02±0.01 0.03 0.05±0.03
Upright macrophytes
Lobophora variegata 1.98±0.34 3.15 1.08±0.17 0.83±0.22 4.03±0.92
Dictyota pfaffii 0.35±0.83 0.55 0.15±0.07 0.45±0.15 0.45±0.18
Dictyotasp. 0.22±0.04 0.35 0.30±0.10 0.08±0.04 0.28±0.08
Sargassumsp. 0.06±0.02 0.09 0.13±0.05 0.05±0.03
Cystoseira compressa 0.04±0.01 0.06 0.10±0.04 0.03±0.02
Padina pavonica 0.04±0.02 0.06 0.13±0.06
Stypopodium zonale 0.03±0.01 0.04 0.08±0.04
Colpomenia sinuosa 0.02±0.01 0.03 0.05±0.05
Liagora tetrasporifera 0.01±0.008 0.01 0.03±0.02
Dictyota fasciola 0.01±0.008 0.01 0.03±0.02
Asparagopsis taxiformis 0.01±0.008 0.01 0.03±0.02
Pseudolithoderma adriaticum increased their values fol-lowing the positive values of both axes.
Discussion
Crustose forms were the most abundant algae found in
Diadema africanum barrens along the coasts of Tenerife.
Within this group, the crustose coralline algaeHydrolithon
farinosum, H. samoe¨nse, H. onkodes, Neogoniolithon
orotavicum and N. hirtum, and the phaeophyceen
Pseudolithoderma adriaticum were the most common
species. However, in terms of species richness, crustose algal species represented only a small fraction of the community. Noncrustose algae, made up of 100 different species of which about 90 % were cyanophytes, filamen-tous and small corticated forms, contributed the most to community richness. Most algae, both crustose and non-crustose, have adapted and developed defences against herbivory. CCA have a heavily calcified structure to deter herbivores (Littler and Littler1980; Duffy and Hay 1990; Steneck and Dethier1994; Hay 1997), while noncrustose algae have rapid growth and high renewal rates (Littler and
Littler 1980; Hackney et al. 1989). In the barrens we studied, there were also species that are more commonly found in upright algal bed habitats. In our barrens, these species showed low levels of thallus development, not exceeding the initial stages of growth, and lacked repro-ductive structures (Sangil2012). They occur in the barrens as a result of the relatively continuous arrival of propagules from upright algal beds elsewhere in the region, but their development is stunted due to grazing pressure byDiadema
africanum. Lobophora variegata is the most abundant
upright macrophyte found growing in barrens; the species’ relative success is because its prostrate growth makes it less accessible to sea urchins (Ruyter van Steveninck et al.
1988).
Barrens are generally described as having poor net biodiversity, compared with habitats dominated by upright algae (Sala et al.1998; Konar and Estes2003; Shears and Babcock 2003; Ling 2008). However, there are some species that benefit from the presence of herbivores. Removal of canopy forming algae by sea urchins increases the availability of space for other species to establish themselves and develop (Hay 1981; Sammarco 1982; Hackney et al. 1989). Many filamentous and small corti-cated species therefore seem to have found their niche in barrens while they are uncommon in upright algal beds (Sangil 2012).
Community structure showed high spatial variability around Tenerife, with PERMANOVA (all species dataset) finding differences across all spatial scales. These differ-ences were most evident in the percentage of algal cover data, where there were differences between sectors (sides of the island), sites (5–10 km apart within each sector) and stations (50–100 m apart within each site). Presence/ absence data only showed differences at the levels of sector and site; community composition was similar between different stations. Analyses of algal cover data (used as a measure of algal abundance) were more sensitive for detecting differences in algal communities than presence/ absence data (used as a measure of species richness). It is likely that this occurred because the bulk of the algal community was made up of a small number of relatively abundant species. Several groups of algae made up about 97 % of the total cover: thin CCA (includingHydrolithon farinosum,H.samoe¨nse,Pneophyllum fragile), thick CCA
Sector SE SW N 1 1 1 1 1 1 1 1 11 2 2 2 2 2 2 2 2 2 2 3 3 3 3 3 3 3 3 3 3 4 4 4 4 4 4 4 4 4 4 5 5 5 5 5 5 5 5 55 66 6 6 6 6 6 6 6 6 7 7 7 7 7 7 7 7 7 7 8 8 8 8 8 8 8 8 8 8 9 9 9 9 9 9 9 9 9 9 10 10 10 10 10 10 10 10 10 10 11 11 11 11 11 11 11 11 11 11 12 12 12 12 12 12 12 12 12 12
2D Stress: 0,16
1 1 1 1 1 1 1 1 1 1 2 2 2 2 2 2 2 2 2 2 3 3 3 3 3 3 3 3 3 3 4 4 4 4 4 4 4 4 4 4 5 5 5 5 5 5 5 5 5 5 6 6 6 6 6 6 6 6 6 6 7 7 7 7 7 7 7 7 7 7 8 8 8 8 8 8 8 8 8 8 9 9 9 9 9 9 9 9 9 9 10 10 10 10 10 10 10 10 10
10 11 11
11 11 11 11 11 11 11 11 12 12 12 12 12 12 12 12 12 12
2D Stress: 0,24
A Species cover
B Presence/absence data
Fig. 2 Non-metric MDS ordination: a species cover, b presence/ absence data
c
0 15 30 45 60 75
0 10 20 30 40 50
SE SW N
0 7 14 21 28 35
0 3 6 9 12 0 15 30 45 60 75 90
5
1 2 3 4 6 7 8 9 10 11 12
5
1 2 3 4 6 7 8 9 10 11 12
1 2 3 4 5 6 7 8 9 10 11 12 1 2 3 4 5 6 7 8 9 10 11 12
0 6 12 18 24 30
SE SW N
0 0,3 0,6 0,9 1,2 1,5
Sec Si(Sec) Sta(Si(Sec)) Res
0 1 2 3 4 5
Thin CCA
Thick CCA
0 1 2 3 4 5
6 Hydrolithon onkodes
0 0,3 0,6 0,9 1,2
1,5 Pseudolithoderma adriaticum
0 0,1 0,2 0,3 0,4 0,5
0 0,1 0,2 0,5 0,6
Lobophora variegata
Filamentous Ceramiales
*
***
***
**
***
**
*
***
*
***
**
***
Thin CCA
Sectors
Thick CCA
Sites
Hydrolithon onkodes
Sites
Sites
Pseudolithoderma adriaticum
Lobophora variegata
A Species cover (%) B Components of variance
0.3 0.4
Sectors
Sites
Sec Si(Sec) Sta(Si(Sec)) Res
Sec Si(Sec) Sta(Si(Sec)) Res
Sec Si(Sec) Sta(Si(Sec)) Res
Sec Si(Sec) Sta(Si(Sec)) Res
(Neogoniolithon hirtum, N. orotavicum, Lithophyllum
vickersiae,Mesophyllum expansum, Phymatolithon
lenor-mandii), Hydrolithon onkodes, Pseudolithoderma
adriati-cum, Lobophora variegata and filamentous Ceramiales.
However, these key algae all showed different patterns of abundance across the island. For instance, the large CCA
H. onkodes was most variable in abundance on a large
scale (between sectors); the thick CCA,Pseudolithoderma
adriaticum and Lobophora variegata showed high
vari-ability on a medium scale (between sites); and thin CCA and filamentous Ceramiales were most variable on a small scale (between stations).
A multiple regression model (DistLM analysis) showed that variability in community structure was sig-nificantly related to five environmental variables. Wave exposure was the variable that most contributed to spa-tial differences between algal communities, but urchin density and substrate roughness were also important. Productivity and depth had limited influence. The dbRDA analysis showed that environmental variables had different levels of influence at different spatial scales. On the largest scale, wave exposure and pro-ductivity were the most dominant factors relating to algal community structure, with a clear ordination of samples observed from N to SE sectors. Urchin density, rough-ness and depth were related to algal community vari-ability on the medium and small spatial scales. Samples from each sector as well as the samples from within each site were ordered along the second axis according to the increase of these variables.
Some marine species known to be favoured by high levels of wave exposure and nutrients while others are impaired by them; in this way, both environmental factors have the ability to influence community structure (Daume et al. 1999; Fabricius and De’ath2001; Dı´ez et al. 2003; Kraufvelin 2007). Although waves can prevent the settle-ment and establishsettle-ment of algal propagules, the turbulence resulting from wave action can also break the seasonal thermocline, causing the ascent of nutrients and thereby enhancing the growth of algae in the area. Differences in Tenerife’s algal community structure between the exposed north coasts, and the less exposed southern coasts, have previously been described in upright algal beds (Tuya and Haroun 2006). Large and perennial species (Fucales) develop to a greater extent in exposed areas (Tuya and Haroun 2006; Sangil et al. 2011). In the barrens investi-gated in this study, clear differences in community struc-ture and algal composition were found between areas subjected to different levels of wave exposure, and the most significant differences were found between commu-nities of crustose species. In the northern barrens, where wave exposure is highest, the dominant species were the thick CCA (Neogoniolithon hirtumandN. orotavicum) and the largest CCA, Hydrolithon onkodes. In the southern barrens, where wave exposure is lower, the dominant crustose algae were thin CCA (Hydrolithon samoe¨nse and
H. farinosum) and the crustose phaeophycean
Pseudo-lithoderma adriaticum. Furthermore, in the northern
bar-rens, thick CCA were made up mainly of slow-growing perennial forms with well-developed thalli, and reproduc-tive structures (conceptacles) that occurred rarely. In con-trast, in the south, species were rapid-growing annual forms, with small thalli and abundant conceptacles. Due to the differences between thick and thin forms, CCA cannot be considered as a single morpho-functional group in terms of life strategy and grazer resistance, as postulated by Littler and Littler (1980). Thin CCA, like those found dominating barrens in the south of Tenerife, include pop-ulations of annual opportunistic species that are found in habitats at an early stage of succession. Thick CCA, like those found predominantly along the northern coasts, are perennial species and tend to arrive at a later stage of succession.
Total cover of crustose algae was also higher in the northern barrens. The differences between sectors can be attributed mainly to oceanographic conditions; though urchin grazing pressure is another possible cause. Differ-ences in grazing are known to drive differDiffer-ences in algal cover (Borowitzka 1981; Sammarco 1983; O’Leary and McClanahan 2010) and community structure (Hackney et al. 1989; Wai and Williams 2006). It can be deduced from dbRDA analysis that sea urchin density did not differ among the three sectors of the island studied. Despite this
Table 3 Results of DistLM (distance-based linear model routine) considering species cover
Variable Pseudo-F p % var.
(A) Marginal test
Urchin density 6.297 0.0002 7.06
Wave exposure 28.378 0.0001 15.38
Productivity 26.30 0.0001 14.22
Depth 3.147 0.014 2.59
Substrate roughness 7.495 0.0001 7.97
Variable Pseudo-F p % var. Com. % var.
(B) Sequencial test
Wave exposure 30.152 0.0001 15.17 15.17
Urchin density 9.353 0.0001 7.11 22.28
Substrate roughness 8.574 0.0001 6.47 28.76
Productivity 6.633 0.0003 5.20 33.96
Depth 3.147 0.015 2.59 36.56
fact, numerous authors have suggested that wave exposure is one of the principal forces that can limit herbivore activity (Hay 1981; Lewis and Wainwright 1985; Kaya-mata et al. 2011). Previous studies on D. africanum also lend support to this hypothesis. Tuya et al. (2007) com-bined experimental work with field data to show that both mobility and grazing activity of D. africanum are influ-enced by wave strength. Herna´ndez et al. (2008) found that urchins require protection from waves in order to graze efficiently. Given the results of previous work onD.
afri-canum grazing activity, one might assume that grazing
pressure is higher on CCA along the southern, relatively sheltered, coastlines of Tenerife than in northern, relatively
wave exposed areas. An experimental approach is needed to test hypothesis.
In the Canary Islands, most of the variability in benthic communities at medium (site) and small (station) spatial scales is a result of local factors (e.g., sedimentation and substrate type) (Sangil et al. 2011). Most of the site vari-ability, as shown by the dbRDA (see Fig.4a), is related to differences in urchin density. High variability was also found at a medium spatial scale by Herna´ndez et al. (2008) when they studiedD. africanumdensities across sites in the Canarian Archipelago. Herna´ndez et al. (2008) suggested that local conditions, such as substrate type and sedimen-tation, are especially important in determining the size of
0 2 0 0 2 -0 4
-dbRDA1 (65,4% of fitted, 23.9% of total variation)
-20 0 20 Sector SE SO N 1 1 1 11 1 11 1 1 2 2 22 2 2 2 2 2 2 3 3 3 3 3 3 3 3 3 3 4 4 4 4 4 4 4 4 4 4 5 5 5 5 55 5 5 5 5 6 6 6 6 6 6 6 6 6 6 7 7 7 7 7 7 7 7 7 7 8 8 88 8 8 8 8 8 8 9 9 9 9 9 9 9 9 9 10 10 10 10 10 10 10 10 10 10
111111 11 11 11 11 11 11 11 12 12 12 12 12 12 12 12 12 12 Depth Substrate roughness Productivity 9 9
dbRDA2 (16% of fitted, 5.9% of total variation)
0 2 0 0 2 -0 4
-dbRDA1 (65,4% of fitted, 23.9% of total variation)
-20 0 20 1 1 1 11 1 11 1 1 2 2 22 2 2 2 2 2 2 3 3 3 3 3 3 3 3 3 3 4 4 4 4 4 4 4 4 4 4 5 5 5 5 55 5 5 5 5 6 6 6 6 6 6 6 6 6 6 7 7 7 7 7 7 7 7 7 7 8 8 88 8 8 8 8 8 8 9 9 9 9 9 9 9 9 9 10 10 10 10 10 10 10 10 10 10
111111 11 11 11 11 11 11 11 12 12 12 12 12 12 12 12 12 12 9 9
dbRDA2 (16% of fitted, 5.9% of total variation)
Thick CCA H. onkodes Thin CCA P. adriaticum L. variegata A B
Fig. 4 Distance-based redundancy analysis (dbRDA).
aRelationships between the ordination of samples based on species cover and
environmental variables.
urchin populations. Complex rocky bottoms with abundant pits (e.g., boulder fields) tend to harbor higher densities of urchins, which in turn limits algal growth, compared to homogeneous bottoms (e.g., flat platforms of rock). Above a certain threshold value, levels of sedimentation can restrict the settlement of D. africanum larvae. Different taxa showed significant differences at level site, such as thick CCA, Pseudolithoderma adriaticum, Hydrolithon onkodesandLobophora variegata, the latter two decreased with increasing urchin density. The roughness of rocky substrates has been recognized as an important factor in determining the development of algal communities (Hutchinson et al. 2006). In the Canarian Archipelago, substrate roughness is highly variable between areas just a few tens of meters apart, due to the volcanic features of the bedrock (Yanes 1990). Small irregularities in the rocks, such as crevices or cavities, act as refuges for algae where grazing by macroherbivores is less intense (Bergey and Weaver 2004; Murdock and Dodds 2007). Substrate roughness and urchin density therefore have opposite effects on the organization of algal communities; algal development favors areas where substrate roughness is high and urchin density is low. As expected, the percentage cover of palatable, filamentous algae such as Ceramiales
andLobophora variegata,was highest in areas where the
substrate was roughest. Water depth is known to be a key factor structuring near shore benthic communities (Dayton
1985; Garrabou et al. 2002). However, when considering depths between 10 and 20 m, there was no significant influence on the structure of algal communities in barren habitats around Tenerife.
References
Adey WH (1970) The effects of light and temperature on growth rates in boreal-subarctic crustose coralline alga. J Phycol 6:269–276 Afonso-Carrillo J (1982) Revisio´n de las especies de la familia
Corallinaceae en las islas Canarias Tesis Doctoral. Universidad de La Laguna, La Laguna
Afonso-Carrillo J (1984) Estudios en las algas Corallinaceae (Rho-dophyta) de las Islas Canarias II. Notas taxono´micas. Vieraea 13:127–144
Afonso-Carrillo J, Sanso´n M (1999) Algas, hongos y fanero´gamas marinas de las Islas Canarias. Clave analı´tica. Materiales dida´cticos universitarios. Serie Biologı´a 2. Secretariado de Publicaciones Universidad de La Laguna, La Laguna
Anderson MJ (2001) A new method for non-parametric multivariate analysis of variance. Austral Ecol 26:32–46
Anderson MJ (2004) PERMANOVA_2 factor: a FORTRAN com-puter program for permutational multivariate analysis of vari-ance (for any two-factor ANOVA design) using permutation test. University of Auckland, Department of Statistics, New Zealand Anderson MJ, ter Braak CJF (2003) Permutation test for multi-factorial analysis of variance. J Stat Comput Simul 73:85–113
Anderson MJ, Gorley RN, Clarke KR (2008) Permanova?for primer: guide to software and statistical methods. Primer-E Ltd, Plymouth Andrew NL (1993) Spatial heterogeneity, sea urchin grazing, and habitat structure on reefs in temperate Australia. Ecology 74:292–302
Aponte NE, Ballantine DL (2001) Distribution of algal species on the deep insular fore reef at Lee Stocking Islands, Bahamas. Deep Sea Res 48:2185–2194
Athanasiadis A, Neto AI (2010) On the occurrence ofMesophyllum expansum (Philippi) Cabioch & Mendoza (Melobesioideae, Corallinales (Rhodophyta) in the Mediterranean Sea, the Canary Isles and the Azores. Bot Mar 53:333–341
Barton ED, Arı´stegui J, Tett P, Canton M et al (1998) The transition zone of the Canary current upwelling region. Prog Oceanogr 41:455–504
Becerro MA, Bonito V, Paul VJ (2006) Effects of monsoon-driven wave action on coral reefs of Guam and implications for coral recruitment. Coral Reefs 25:193–199
Belliveau SA, Paul VJ (2002) Effects of herbivory and nutrients on the early colonization of crustose coralline and fleshy algae. Mar Ecol Prog Ser 232:105–114
Benedetti-Cecchi L, Maggi E, Bertocci I, Vaselli S, Micheli F, Osio GC, Cinelli F (2003) Variation in rocky shore assemblages in the northwestern Mediterranean: contrasts between islands and the mainland. J Exp Mar Biol Ecol 293:193–215
Bergey EA, Weaver J (2004) The influence of crevice size on the protection of epilithic algae from grazers. J Freshw Biol 49:1014–1025
Borowitzka MA (1981) Algae and grazing in coral reef ecosystems. Endeavour 5:99–106
Brito A, Herna´ndez JC, Falco´n JM, Garcı´a N et al (2004) El erizo de Lima (Diadema antillarum) una especie clave en los fondos rocosos litorales de Canarias. Makaronesia 6:68–86
Carpenter RC (1986) Partitioning herbivory and its effects on coral reef algal communities. Ecol Monogr 56:345–363
Clarke KR, Gorley RN (2006) PRIMER v6: user manual/tutorial. PRIMER-E, Primer-E Ltd, Plymouth
Clemente S, Herna´ndez JC, Rodrı´guez A, Brito A (2010) Identifying keystone predators and importance of preserving functional diversity in sublittoral rocky-bottom areas. Mar Ecol Prog Ser 413:55–67
Daume S, Brand-Gardner S, Woelkerling WJ (1999) Community structure of nongeniculate coralline red algae (Corallinales, Rhodophyta) in three boulder habitats in Southern Australia. Phycologia 38:138–148
Dayton PK (1985) Ecology of kelp communities. Annu Rev Ecol Syst 16:215–245
Dı´ez I, Santolaria A, Gorostiaga JM (2003) The relationship of environmental factors to the structure and distribution of subtidal seaweed vegetation of the western Basque coast. Estuar Coast Shelf Sci 56:1041–1054
Duffy JE, Hay ME (1990) Seaweed adaptations to herbivory. Bioscience 40:368–375
Fabricius K, De’ath G (2001) Environmental factors associated with the spatial distribution of crustose coralline algae on the Great Barrier Reef. Coral Reefs 19:303–309
Garcı´a-Braun J, Molina R (1988) El mar, el Atla´ntico en el a´rea de Canarias. In: Afonso L (ed) Geografı´a de Canarias. Vol I. Geografı´a Fı´sica 2 ed. Interinsular Canaria, Santa Cruz de Tenerife, pp 18–28
Garrabou J, Ballesteros E, Zabala M (2002) Structure and dynamics of Northwestern Mediterranean rocky benthic communities. Estuar Coast Shelf Sci 55:493–508
Harrington L, Fabricius K, De’ath G, Negri A (2004) Recognition and selection of settlement substrata determinate post-settlement survival in corals. Ecology 85:3428–3437
Hay ME (1981) Spatial patterns of grazing intensity on a Caribbean barrier reef: herbivory and algal distribution. Aquat Bot 11:97–109
Hay ME (1997) The ecology and evolution of seaweed-herbivore interactions on coral reefs. Coral Reefs 16:67–76
Herna´ndez JC, Clemente S, Sangil C, Brito A (2008) The key role of Diademaaff.antillarum(Echinoidea: Diadematidae) throughout the Canary Islands (eastern subtropical Atlantic) in controlling macroalgae assemblages: an spatio-temporal approach. Mar Environ Res 66:259–270
Hutchinson N, Nagarkar S, Aitchison JC, Williams GA (2006) Microspatial variation in marine biofilm abundance on intertidal rock surfaces. Aquat Microb Ecol 42:187–197
Irvine LM, Chamberlain YM (1994) Seaweeds of the British Isles, 1 (2B). Corallinales, Hildenbrandiales. HMSO, London
Kaehler S, Williams A (1996) Distribution of algae on tropical rocky shores: spatial and temporal patterns of non-coralline encrusting algae in Hong Kong. Mar Biol 125:177–187
Kayamata S, Yoshimitsu S, Takana T, Igari T, Tokunaga S (2011) Importance of sedimentation for survival of canopy-forming fucoid algae in urchin barrens. J Sea Res 66:76–86
Konar B, Estes J (2003) The stability of boundary regions between kelp beds and deforested areas. Ecology 84:174–185
Kraufvelin P (2007) Responses to nutrient enrichment, wave action and disturbance in rocky shore communities. Aquat Bot 87:262–274
Legendre P, Anderson MJ (1999) Distance-based redundancy analysis: testing multispecies responses in multifactorial ecolog-ical experiments. Ecol Monogr 69:1–24
Lewis SM, Wainwright PC (1985) Herbivore abundance and grazing intensity on a Caribbean coral-reef. J Exp Mar Biol Ecol 87:215–228
Ling SD (2008) Range expansion of habitat-modifying species leads to loss of taxonomic diversity: a new and impoverished reef state. Oecologia 156:883–894
Littler MM (1972) The crustose Corallinaceae. Oceanogr Mar Biol Ann Rev 10:311–347
Littler MM, Littler DS (1980) The evolution of thallus form and survival strategies in benthic marine macroalgae: field and laboratory tests of functional form model. Am Nat 116:25–44 Littler MM, Littler DS, Brooks BL (2006) Harmful algae on tropical
coral reefs: bottom-up eutrophication and top-down herbivory. Harmful Algae 5:565–585
Luckhurst BE, Luckhurst K (1978) Analysis of influence of substra-tum variables on coral reef communities. Mar Biol 49:317–323 McArdle BH, Anderson MJ (2001) Fitting multivariate models to community data: a comment on distance-based redundancy analysis. Ecology 82:290–297
McClanahan TR, Bergman K, Huitric M, McField M, Elfwing T, Nystro¨m M, Nordermar I (2000) Response of fishes to algae reduction on Glovers Reef, Belize. Mar Ecol Prog Ser 206:273–282
Murdock JN, Dodds WK (2007) Linking benthic algal biomass to stream substratum topography. J Phycol 43:449–460
O’Learly JK, Potts DC, Braga JC, McClanahan TR (2012) Indirect consequences of fishing: reduction of coralline algae suppresses juvenile coral abundance. Coral Reefs 31:547–559
O’Leary JK, McClanahan TR (2010) Trophic cascades result in large-scale coralline algae loss through differential grazer effects. Ecology 91:3584–3597
Pe´rez OM, Telfer TC, Ross LG (2003) On the calculation of wave climate for offshore cage culture site selection: a case study in Tenerife (Canary Islands). Aquacult Eng 29:1–21
Piazzi L, Balata D, Pertusati M, Cinelli F (2004) Spatial and temporal variability of Mediterranean macroalgal coralligenous assem-blages in relation to habitat and substratum inclination. Bot Mar 47:105–115
Pinnegar JK, Poulin NVC, Francour P et al (2000) Trophic cascades in benthic marine ecosystems: lessons for fisheries and pro-tected-area management. Environ Conserv 27:179–200 Rao CR (1971) Estimation of variance and covariance components:
MINQUE theory. J Multivar Anal 1:445–456
Reyes J, Afonso-Carrillo J (1995) Morphology and distribution of nongeniculate coralline algae (Corallinaceae, Rhodophyta) on the leaves of the seagrassCymodocea nodosa(Cymodoceaceae). Phycologia 34:179–190
Ruyter van Steveninck ED, de Kamermans P, Breeman AM (1988) Transplant experiments with two morphological growth forms of Lobophora variegata. Mar Ecol Prog Ser 49:191–194
Sala E, Boudouresque CF, Hammerlin-Vivien M (1998) Fishing, trophic cascades, and the structure of algal assemblages: evaluation of an old but untested paradigm. Oikos 82:425–439 Sammarco PW (1982) Effects of grazing by Diadema antillarum
Philippi (Echinodermata: Echinoidea) on algal diversity and community structure. J Exp Mar Biol Ecol 65:83–105 Sammarco PW (1983) Effects of fish grazing and damselfish
territoriality on coral reef algae. I. Algal community structure. Mar Ecol Prog Ser 13:1–14
Sangil C (2012) La vegetacio´n sublitoral de sustratos rocosos de las Islas Canarias: estructura, composicio´n y dina´mica de las comunidades de macroalgas. Secretariado de Publicaciones Universidad de La Laguna. Universidad de La Laguna, La Laguna
Sangil C, Sanso´n M, Afonso-Carrillo J (2011) Spatial variation patterns of subtidal seaweed assemblages along a subtropical oceanic archipelago: thermal gradient vs herbivore pressure. Estuar Coast Shelf Sci 94:322–333
Sangil C, Clemente S, Martı´n-Garcı´a L, Herna´ndez JC (2012) No-take areas an effective tool to revert urchin barrens on subtropical rocky reefs. Estuar Coast Shelf Sci 112:207–215 Sangil C, Sanso´n M, Clemente S, Afonso-Carrillo J, Herna´ndez JC
(2014) Contrasting the species abundance, species density and diversity of seaweed assemblages in alternative states: urchin density as a driver of biotic homogenization. J Sea Res 85:92–103
Shears NT, Babcock RC (2003) Continuing trophic cascade effects after of no-take marine reserve protection. Mar Ecol Prog Ser 246:1–16
Steneck RS, Dethier MN (1994) A functional-group approach to the structure of algal-dominated communities. Oikos 69:476–498 Steneck RS, Paine RT (1986) Ecological and taxonomic studies of
shallow-water encrusting Corallinaceae (Rhodophyta) of the boreal northeastern Pacific. Phycologia 25:221–240
Titlyanov EA, Titlyanova TV, Yakovleva IM, Nakano Y, Bhagooli R (2005) Regeneration of artificial injuries on scleractinian corals and coral/algal competition for newly formed substrate. J Exp Mar Biol Ecol 323:27–42
Tuya F, Haroun RJ (2006) Spatial patterns and response to wave exposure of shallow water assemblages across the Canarian Archipelago: a multi-scaled approach. Mar Ecol Prog Ser 311:15–28
Tuya F, Boyra A, Sa´nchez-Jerez P, Barbera C, Haroun RJ (2004) Relationships between rocky-reef fish assemblages, the sea urchin Diadema antillarum and macroalgae throughout the Canarian Archipelago. Mar Ecol Prog Ser 278:157–169 Tuya F, Cisneros-Aguirre J, Ortega-Borges L, Haroun RJ (2007)
Tyberghein L, Verbruggen H, Pauly K, Troupin C, Mineur F, De Clerk O (2012) Bio-ORACLE: a global environmental dataset for marine species distribution modeling. Glob Ecol Biogeogr 21:272–281
Underwood AJ (1997) Experiments in ecology: their logical design and interpretation using analysis of variance. Cambridge University Press, Cambridge
Wai TC, Williams GA (2006) Effect of grazing on coralline algae in seasonal, tropical, low-shore rock pools: spatio-temporal variation in settlement and persistence. Mar Ecol Prog Ser 326:99–113
Woelkerling WJ (1988) The Coralline Red Algae: an analysis of the genera and subfamilies of nongeniculate Corallinaceae. British Museum (Natural History) & Oxford University Press, Oxford Wright JT, Dworjanyn SA, Rogers CN, Steinberg PD, Williamson JE,
Poore AGB (2005) Density-dependent sea urchin grazing: differ-ential removal of species, changes in community composition and alternative community states. Mar Ecol Progr Ser 298:143–156 Yanes A (1990) Morfologı´a litoral de las islas Canarias occidentales.
![Table 2 Mean percent cover(±s.e.) and percentage ofcontribution to total cover of themost abundant algae found inurchin barrens of TenerifeIsland, and mean percent coverby sectors [SE = Southeast,SW = Southwest, N = North]](https://thumb-us.123doks.com/thumbv2/123dok_us/394592.1532218/7.595.175.545.58.457/percentage-ofcontribution-abundant-inurchin-barrens-tenerifeisland-southeast-southwest.webp)