© Universiti Tun Hussein Onn Malaysia Publisher’s Office
IJIE
Journal homepage: http://penerbit.uthm.edu.my/ojs/index.php/ijie
The International
Journal of
Integrated
Engineering
ISSN : 2229-838X e-ISSN : 2600-7916
A Hybrid Method of Least Square Support Vector Machine
and Bacterial Foraging Optimization Algorithm for Medium
Term Electricity Price Forecasting
Intan Azmira Wan Abdul Razak
1, Nik Nur Atira Nik Ibrahim
1, Izham Zainal
Abidin
2, Yap Keem Siah
2, Aidil Azwin Zainul Abidin
2, Titik Khawa Abdul
Rahman
3*1Faculty of Electrical Engineering / Center for Robotics and Industrial Automation (CeRIA)
Universiti Teknikal Malaysia Melaka (UTeM), Malacca, MALAYSIA
2 College of Engineering
National Energy University (UNITEN), Selangor, MALAYSIA
3Faculty of Engineering Girl Campus
King Abdulaziz University, Jeddah, SAUDI ARABIA
*Corresponding Author
DOI: https://doi.org/10.30880/ijie.2019.11.03.024
Received 7 August 2019; Accepted 19 August 2019, Available online 31 August 2019
1. Introduction
Price prediction is important to market members in deregulated electricity environment to provide a better maintenance scheduling, developing investment, medium term planning, as well as decision-making. However,
Abstract: Predicting electricity price has now become an important task for planning and maintenance of power system. In medium term forecast, electricity price can be predicted for several weeks ahead up to a year or few months ahead. It is useful for resources reallocation where the market players have to manage the price risk on the expected market scenario. However, researches on medium term price forecast have also exhibit low forecast accuracy. This is due to the limited historical data for training and testing purposes. Therefore, an optimization technique of Bacterial Foraging Optimization Algorithm (BFOA) for Least Square Support Vector Machine (LSSVM) was developed in this study to provide an accurate electricity price forecast with optimized LSSVM parameters and input features. So far, no literature has been found on feature and parameter selections using the LSSVM-BFOA method for medium term price prediction. The model was examined on the Ontario power market; which is reported as among the most volatile market worldwide. Monthly average of Hourly Ontario Electricity Price (HOEP) for the past 12 months and month index are selected as the input features. The developed LSSVM-BFOA shows higher forecast accuracy with lower complexity than the existing models.
accessible data for medium term price forecast [1]–[4]. Medium term forecast usually takes one year of historical data [2], [5]. Hence, medium term forecast cannot extract price trend from the immediate past.
Only a few researches have been conducted in the field of medium term electricity price forecasting. Some studies on Time Series (TS) and support Vector Machine (SVM) were reported in this area. However, some researchers found that Neural Network (NN) method is not suitable for medium term forecast as NN needs large data set for network training [6].
Some TS models for medium term electricity price forecasting were designed by previous researchers such as regression models [7], generalized least squares model with auto-correlated residuals [8] and Autoregressive Moving Average Exogenous (ARMAX) model [9]. Meanwhile, SVM approaches have been explored by others such as the hybrid SVM and ARMAX [10], which compared SVM-ARMAX performances with single SVM. On the other hand, the findings of [1] indicated that the proposed hybrid method of SVM and ARMAX is more accurate than stand-alone ARMAX when tested on PJM market in June 2009 and June 2010.
In addition, superiority of SVM has been revealed by [6] when the developed SVM model outperformed other forecast models of Radial Basis Function Neural Network (RBF-NN), Wavelet Neural Network (WNN), and Navigant Consulting Company. The results also showed that the model of SVM/SVM surpassed other hybrid models of SVM/RBF-NN, RBF-NN/RBF-NN, and RBF-NN/SVM.
More work should be carried out to produce better forecast accuracy by properly selecting the significant features and network parameters. To the best of the authors’ review, no literature has been found on the application of LSSVM and BFOA in medium term electricity price forecast. In addition, the approach of feature selection and parameter optimization using a single optimization technique has not reported yet. Thus, this study developed a forecasting technique to improve medium term electricity price forecasting using hybrid model of LSSVM and BFOA. This method is proven to give better forecast accuracy as compared to other existing models, which can contribute for decision-making and medium term planning in electricity power market.
2.
Fundamental of SVM, LSSVM and BFOA
2.1
SVM and LSSVM
SVM as presented by [11], is a supervised learning model that supports data analysis and pattern recognition for classification and estimation. Support Vector Regression solves for quadratic programs which involve inequality constraint. However, SVM has high computational problem. SVM can reduce over-fitting, local minima problems [12], and able to deal with high dimensional input spaces splendidly [13]. Nevertheless, the main disadvantage of SVM is its high computational complexity due to constrained optimization programming. Hence, Least Squares Support Vector Machine (LSSVM) was proposed to diminish the computational burden of SVM, which applies with equality instead of inequality constraints [14]. LSSVM solves a system of linear equations instead of a quadratic programming (QP) problem that improve the computational speed [13], [15]. The linear system, namely as Karush- Kuhn-Tucker (KKT), is more straightforward than QP system. LSSVM also maintains the principle of SVM, which possess good generalization capability. LSSVM reduces the sum square errors (SSEs) of training data sets while concurrently diminishing margin error. Meanwhile, in contrast to SVM, LSSVM uses the least squares loss function instead of the ɛ-insensitive loss function.
2.2
Fundamental of BFOA
The E. Coli bacteria, which is exist in human's intestines has unique foraging activities during locating and ingesting nutrient or food. BFOA mimics this mechanism by applying four main steps during foraging; that are chemotaxis, swarming, reproduction, and elimination-dispersal. The description of each step is as follows:
Step 1: Chemotaxis
During chemotaxis step, bacteria searches for nutrient to maximize the energy intake while foraging by taking small steps (chemotaxis). They tumble or swim to find nutrient but avoid dangerous places. Hence, suppose that θi(j, k, l) is the i-th bacterium position at j-th chemotactic, k-th reproduction, and l-th elimination-dispersal step, the position of each bacterium after having swimming or tumbling can be defined as (1):
) ( ) (
) ( ) ( ) , , ( ) , , 1 (
i i
i i
C l k j l k j
T i
i
where C(i) is the size of the step taken during tumbling or swimming, and ∆ is a vector in the random direction
where the elements lie in position of [-1,1]. The objective function or actual cost for each location of bacterium i is calculated and represented as J(i,j,k,l).
Step 2: Swarming
During swarming step, a bacterium that has uncovered good sources of nutrients during its search may attract other bacteria to form a swarm. On the other hand, the repellent signal can be released to ensure that the bacteria do not get too close to each other. The cell-to-cell attraction and repellent (Jcc) of E.Coli swarm can be denoted as (2):
)] ) ( exp( [ )] ) ( exp( [ )) , , ( , ( )) , , ( , ( 2 1 1 2 1 1 1
p m i m m S i rep rep p m i m m S i att att i S i cc cc w h a a w d l k j J l k j P J
(2)Jcc is the objective function value to be added to the current objective function that will reduce the final objective
function, S is the total number of bacteria, and p is the number of variables to be optimized.
Step 3: Reproduction
When the food is sufficient and the temperature is suitable, the healthiest or well performed bacteria increase in length and split at the middle to form duplication of itself that contributes to the next generation while the least healthy bacteria dies. This activity is known as reproduction. BFOA applies this phenomenon by sorting the best objective function in increasing order and keeps half of the population’s size to reproduce while the other half is eliminated.
Step 4: Elimination-dispersal
The final step is elimination-dispersal in which the chemotaxis process may be eliminated and some bacteria may be dispersed to a new location.
3.
Hybrid LSSVM-BFOA methodology
The training and testing data were normalized between [-1, 1] as (3) to prevent the domination of very large value in the data.
2
2
min max min maxx
x
x
x
x
x
j n (3)From the equation, xnis normalized value, xj is raw sample value, xmax and xmin are the maximum and minimum
value of each feature in the samples.
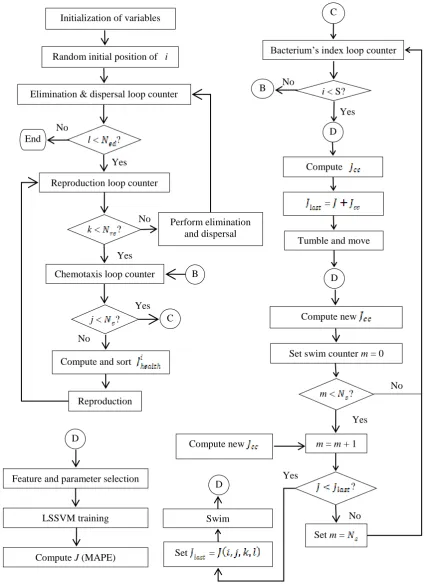
Monthly average HOEP for the past 12 months and month index are selected as the input features [16]. Month index is the index of targeted month, which numbered from 1 to 12 to represent January to December. Hence, each training sample has 13 features, which were trained to produce one month-ahead. Fig.1 shows flowchart of the LSSVM-BFAO model, combining the optimization process and LSSVM training and testing
parameters are trained in LSSVM to produce J. The Jcc is calculated and added to the current J to improve the final
objective funtion. Each bacterium also communicates with other bacteria in swarming process by sending attractant signal to form a swarm; or repelent signal to move individually. The objective function produced by this swarming activity is denoted as Jcc, which need to be added with the current objective function.
The next step in bacteria’s foraging activity is reproduction, and the last step is elimination-dispersal. The optimization process ends when a pre-defined number of BFOA parameters are achieved, which are number of chemotactic steps (Nc), number of steps taken during swimming (Ns), number of reproduction steps (Nre) and number of
elimination-dispersal (Ned) steps.
4.
Result and Discussion
The performance of developed model is measured by Mean Absolute Percentage Error (MAPE) and Mean Absolute Error (MAE), which formulated as in (4) and (5); respectively. The notation of Pactual and Pforecast are the
actual and forecasted Hourly Ontario Electricity Price (HOEP) at hour t, respectively, while N is the number of hours.
Nt actualt
forecast t
actual
P
P
P
N
t
1
100
MAPE
(4)
Nt
forecast t
actual
P
tP
N
11
MAE
(5)4.1
Performance of LSSVM-BFOA model
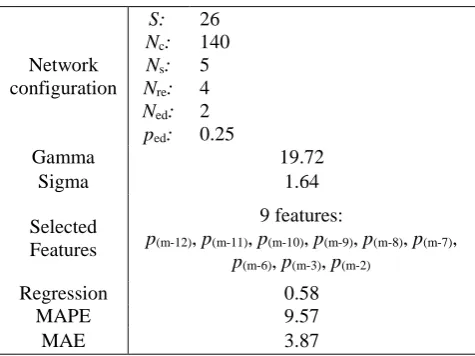
The performance of LSSVM-BFOA for medium term forecast is shown in Table 1. Trial and error method is performed to choose the BFOA parameters [18], [19]. Nine features are selected by the BFOA which are monthly HOEP of past twelfth (p(m-12)), eleventh (p(m-11)), tenth (p(m-10)), ninth (p(m-9)), eighth(p(m-8)), seventh (p(m-7)), sixth(p (m-6)), third(p(m-3)),and second month (p(m-2)) prior to the forecasted month.
Table 1 - LSSVM-BFOA performance for medium term forecast.
Network configuration
S: Nc:
Ns:
Nre:
Ned:
ped:
26 140 5 4 2 0.25
Gamma 19.72
Sigma 1.64
Selected Features
9 features:
p(m-12), p(m-11), p(m-10), p(m-9), p(m-8), p(m-7),
p(m-6), p(m-3), p(m-2)
Regression 0.58
MAPE 9.57
Fig. 1 - Flowchart of the proposed hybrid LSSVM-BFOA model. D
Feature and parameter selection
LSSVM training
Compute J (MAPE) No
Yes Yes
No No
Yes
Perform elimination and dispersal Initialization of variables
Random initial position of i
Elimination & dispersal loop counter
l < ?
Reproduction loop counter
k < ?
Chemotaxis loop counter
j < ?
Compute and sort
Reproduction End
B
C
No
Yes C
Bacterium’s index loop counter
i < S? B
Compute
=
Tumble and move
Compute new
Set swim counter m = 0
m < ?
m = m + 1
No
Yes
Set = Swim Compute new
?
No
Set m = Yes D
D
Nov '09 Dec '09 Jan '10 Feb '10 Mar '10 Apr '10 May '10 June '10 Jul '1025 Aug '10 Sept '10 Oct '10 30
35 40 45 50 55
X: 9 Y: 50.83
Month
H
O
E
P
(
C
A
N
$
/M
W
h
)
Actual Prediction
Fig. 2 - Actual and forecast prices of LSSVM-BFOA.
The plots of actual HOEP against forecasted HOEP is illustrated in Fig. 2. Between the period of May to October 2010 is summer period with the average HOEP of $39.45/MWh [20]. It was reported that this summer period has an increase in average HOEP by 62.5% from last summer period.
In addition, the monthly average HOEP for any month during this summer period is above $30.00/MWh except for October 2010. The monthly average HOEP for each month during last summer is below $30.00/MWh. It can be noticed that generally the predicted HOEP can track the actual price for most of the months except for the fifth and ninth month, which is March and July 2010; respectively. In fact, this spike price of $50.83/MWh is the first time the monthly average HOEP exceeded $50.00/MWh since January 2009 [20].
4.2
Comparative performance with existing methods
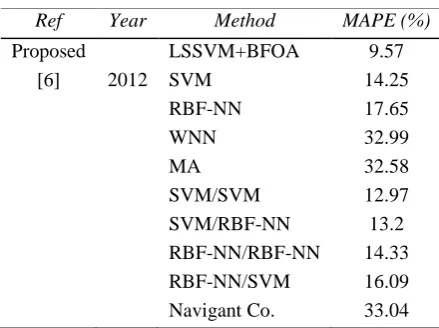
For the sake of fair comparison, the developed model of LSSVM-BFOA was compared with other existing methods in Ontario for the same testing periods. Due to less research in medium term forecast, only one reference has been found for the comparison. The summary of the comparison is shown in Table 2.
Table 2 - MAPE for medium term forecast in the Ontario electricity market.
Ref Year Method MAPE (%)
Proposed LSSVM+BFOA 9.57
[6] 2012 SVM 14.25
RBF-NN 17.65
WNN 32.99
MA 32.58
SVM/SVM 12.97
SVM/RBF-NN 13.2
RBF-NN/RBF-NN 14.33
RBF-NN/SVM 16.09
Navigant Co. 33.04
5.
Conclusion
Electricity price forecasting is an essential task in power system operation and planning. Medium term forecast model would be useful for maintenance scheduling, resources reallocation, developing investment, medium term planning, as well as decision making on buying or selling energy.
This work contributes to the field of electricity price forecasting by developing a novel hybrid method of Least Square Support Vector Machine and Bacterial Foraging Optimization Algorithm to predict medium term electricity prices. LSSVM is selected as forecast engine rather than SVM due to its efficiency, accuracy, and simplicity. Meanwhile, the BFOA performs optimization process by selecting only significant features to be fed into the LSSVM and optimizing parameters for LSSVM.
These optimization processes are accomplished by eliminating species with poor foraging and selecting species with successful foraging. To the best of author‘s knowledge, no research has been found on the application of LSSVM-BFOA in medium term electricity price forecasting. The developed model surpasses all other present methods tested on Ontario power market; in terms of accuracy and complexity.
Acknowledgment
This study is supported in part by the Fundamental Research Grant Scheme (FRGS) provided by Ministry of Higher Education Malaysia (FRGS/1/2017/TK04/FKE-CERIA/F00331). We also would like to dedicate our appreciation to Center for Robotics and Industrial Automation (CeRIA) Universiti Teknikal Malaysia Melaka (UTeM) for providing technical and moral support throughout conducting this study.
References
[1] Yan, X., & Chowdhury, N. A. (2014). Mid-term electricity market clearing price forecasting utilizing hybrid support vector machine and auto-regressive moving average with external input. International Journal of Electrical Power & Energy Systems, 63, 64-70..
[2] Yan, X., & Chowdhury, N. A. (2014). Mid-term electricity market clearing price forecasting: A multiple SVM approach. International Journal of Electrical Power & Energy Systems, 58, 206-214.
[3] Yan, X., & Chowdhury, N. A. (2013, May). A comparison between SVM and LSSVM in mid-term electricity market clearing price forecasting. In 2013 26th IEEE Canadian Conference on Electrical and Computer Engineering (CCECE) (pp. 1-4). IEEE.
[4] Yan, X., & Chowdhury, N. A. (2013, October). Mid-term electricity market clearing price forecasting using multiple support vector machine. In IEEE PES ISGT Europe 2013 (pp. 1-5). IEEE.
[5] Yan, X., & Chowdhury, N. A. (2010, June). Electricity market clearing price forecasting in a deregulated electricity market. In 2010 IEEE 11th International Conference on Probabilistic Methods Applied to Power Systems (pp. 36-41). IEEE.
[6] Torbaghan, S. S., Motamedi, A., & Zareipour, H. (2012, September). Medium-term electricity price forecasting. In 2012 North American Power Symposium (NAPS) (pp. 1-8). IEEE.
[7] Torghaban, S. S., & Zareipour, H. (2010, September). Medium-term electricity market price forecasting: A data-driven approach. In North American Power Symposium 2010 (pp. 1-7). IEEE.
[8] Nunes, C., Pacheco, A., & Silva, T. (2008, May). Statistical models to predict electricity prices. In 2008 5th International Conference on the European Electricity Market (pp. 1-6). IEEE.
[9] Yan, X., & Chowdhury, N. A. (2013). Mid-term electricity market clearing price forecasting: A hybrid LSSVM and ARMAX approach. International Journal of Electrical Power & Energy Systems, 53, 20-26.
[10] Yan, X., & Chowdhury, N. A. (2013, August). Hybrid SVM & ARMAX based mid-term electricity market clearing price forecasting. In 2013 IEEE Electrical Power & Energy Conference (pp. 1-5). IEEE.
[11] Vapnik, V. N. Statistical Learning Theory. new York: Wiley, (1998).
[12] Xie, G., Wang, S., Zhao, Y., & Lai, K. K. (2013). Hybrid approaches based on LSSVR model for container throughput forecasting: a comparative study. Applied Soft Computing, 13(5), 2232-2241.
[13] Wang, H., & Hu, D. (2005, October). Comparison of SVM and LS-SVM for regression. In 2005 International Conference on Neural Networks and Brain (Vol. 1, pp. 279-283). IEEE.
[14] Suykens, J. A., & Vandewalle, J. (1999). Least squares support vector machine classifiers. Neural processing letters, 9(3), 293-300.
[15] Li, S., & Dai, L. K. (2012). Classification of gasoline brand and origin by Raman spectroscopy and a novel R-weighted LSSVM algorithm. Fuel, 96, 146-152.
Springer, Berlin, Heidelberg.
[18] Majhi, R., Panda, G., Sahoo, G., Dash, P. K., & Das, D. P. (2007, September). Stock market prediction of S&P 500 and DJIA using bacterial foraging optimization technique. In 2007 IEEE congress on evolutionary computation (pp. 2569-2575). IEEE.
[19] Dang, J., Brabazon, A., O’Neill, M., & Edelman, D. (2008, March). Option model calibration using a bacterial foraging optimization algorithm. In Workshops on Applications of Evolutionary Computation (pp. 113-122). Springer, Berlin, Heidelberg.