___________________
*Corresponding author : E-mail: [email protected] INTRODUCTION
The European Union currently assigns to Slovakia 22,200 hectares of vineyard. This allocation is not final, and it can change depending on market demand.
The mentioned area is not used at present, although viticulture is an important component of agricultural production in Slovakia.
Vineyards are grown as a monoculture for many years in the same place and this causes changes to the soil environment. In general, the vine does not make demands on the soil. At present time, farmers are directing more attention to physical properties of the soil than its chemical composition. A key factor of soil quality is the structural state (Jackson et al. 2003; Karlen 2004). Agro-technical
operations and environmental changes modify the soil structure (Bronick and Lal
2005) and organic matter content. For example, added farmyard manure (organic composts) (Tisdall and Oades 1982; Šimanský 2011b), fertilizers (Šimanský et al.
2006), and crop residues (Triberti et al. 2008) to soils can positively affect soil
The Effect of Different Soil Management Practices on the
Structure of Vineyard Soil
Vladimír Šimanský1*, Nora Polláková1, Mária Horvátová1 and Lýdia Jedlovská 2
1 Department of Soil Science, Faculty of Agrobiology and Food Resources, Slovak
University of Agriculture, Tr. A. Hlinku 2, 949 76 Nitra, Slovakia.
2 Department of Environmentalism and Zoology, Faculty of Agrobiology and Food
Resources, Slovak University of Agriculture
ABSTRACT
The effect of different soil management practices on soil structure was studied
in a vineyard. In 2006, an experiment of the different management practices in a productive vineyard (Leptosol) was established in Nitra-Dražovce (Slovakia). The following treatments were established: 1. control (grass without fertilization), 2. T (tillage), 3. T+FM (tillage+farmyard manure), 4. G+NPK3 (grass+NPK
120-55-195 kg ha-1), 5. G+NPK1 (grass+NPK 80-35-135 kg ha-1). The results showed
that the highest value of the critical level of soil organic matter was seen in the
G+NPK3 treatment. In the tilled treatment (T), the highest vulnerability of the soil structure was observed. The application of nutrients in G+NPK1 had a negative influence on the content of water-stable micro-aggregates. However, higher doses
of fertilization (NPK 120-55-195 kg ha-1) had a positive effect on the decrease in
water-stable micro-aggregates. Overall, G+NPK3 (NPK 120-55-195 kg ha-1) gave
the best improvement in the structure of the soil.
Malaysian Journal of Soil Science Vol. 17, 2013
40
structure stability and decrease the erosion processes. In productive vineyards, soil
structure can be influenced by mulching (Glab and Kulig 2008) or grass sown in
rows or between rows of vine (Cellete et al. 2008; White 2009). The relationship
between soil organic matter and soil structure has been studied in different
climatic conditions, soil types, and soil managements (Elliot 1986; Oades and Waters 1991; Šimanský et al. 2008), but its relationships in Rendzic Leptosols,
which are used for vineyards, is not well understood as yet. Leptosols are very shallow soils over continuous rock and soils that are extremely gravelly and/or stony. Leptosols are azonal soils which are particularly common in mountainous regions. Leptosols are the most extensive soils on earth, extending over about
1.7 billion ha (WRB 2006). In Slovakia, Leptosols cover 3.5% of the agricultural land. The total area of Slovak Republic is 4.9 mil. ha, of which agricultural land constitutes 2.4 mil. ha.
The aim of this work is to evaluate effects of different soil management practices on the soil structure of a vineyard as well as to assess the effects of soil chemical properties and soil organic matter on soil structure in Rendzic Leptosols.
METHODOLOGY
In 2006, an experiment on the different management practices in a vineyard was carried out in Nitra-Dražovce (48°21’6.16”N; 18°3’37.33”E), Slovakia. It is located in the Nitra wine-growing area. The area has a temperate climate with an
annual average rainfall of 550 mm and an annual mean temperature of ≥ 10 oC. The soil was developed on limestone and magnesian limestone. The soil type was
classified according to WRB classification as a Rendzic Leptosol (WRB 2006). The soil samples (depth 0-0.3 m) contained 17.0±1.6 g kg-1 of organic carbon, 1867±103 mg kg-1 of total N, 99±8 mg kg-1 of total P, 262±15 mg kg-1 of total K, and base saturation percentage was 99.3±0.01 % with an initial pH of 7.18±0.08 (in 2000). Rock fragments were observed in the soil profile to a depth of 0.3 m =
8%.
In 2000, the vines (Vitis vinifera L. cv. Chardonnay) were planted in rows
(3 m x 1 m; 3300 plants ha-1) and were trained using a rheinish-hessian system.
A variety of grasses were used in the inter-rows of the vines, which were sown
in 2003. The vines were protected against the detrimental effects of diseases and
pests. The experiment was conducted on a randomized complete block design with four replicates. It included the following treatments:
1. Co – control - grass sown in the rows and between vine rows (minimal
human impact to the soil in comparison to other treatments);
2. T – tillage - yearly medium tilth to a depth of 0.25 m and intensive
cultivation between vine rows during the growing season with hoes
(an average of 3 times per vegetation season of vine - depending on
climatic conditions);
Malaysian Journal of Soil Science Vol. 17, 2013 41
between vine rows during the growing season. First application of
FYM was released in autumn 2005 and next in autumn 2009;
4. G+NPK3 – doses of NPK fertilizers in 3rd intensity for vineyards, that is, 120 N kg ha-1, 55 P kg ha-1 and 195 K kg ha-1. The dose of nutrients was divided: 2/3 applied into the soil in the spring (bud burst - on March) and 1/3 during flowering (in May). The grass was sown in and
between the vine rows;
5. G+NPK1 – doses of NPK fertilizers in 1st intensity for vineyards, that is, 80 N kg ha-1, 35 P kg ha-1 and 135 K kg ha-1. The dose of nutrients was divided: 1/2 applied into the soil in the spring (bud burst - on March) and 1/2 during flowering (on May). The grass was sown in and
between the vine rows.
Soil samples were collected from all treatments from a depth of 0–0.3 m, during the spring of 2008-2011. In each location, soil samples were collected
and mixed to homogenise the sample. Soil samples were dried at laboratory
temperature and standard soil analyses were used for determination: soil pH (1:2.5
- soil: water), sorptive parameters (Fiala et al. 1999), total organic carbon content (Dziadowiec and Gonet 1999) and optical parameters of humus substances and
humic acids in soil samples, labile carbon content (CL) (Loginov et al. 1987)
and hot water soluble carbon (CHWD) (Kőrschens 2002). Soil samples for the
determination of the structure parameters were taken with the aid of a spade to maintain the soil aggregates. Soil samples were dried at laboratory temperature and divided by sieve (dry and wet sieve) to 7 size fractions. We calculated the
vulnerability coefficient (Kv) according to Valla et al. (2000), as well as the stability index of water-stable aggregates (Sw) and values of sum of mean weight diameters (MWD) in fractions of aggregates. The index of crusting (Ic) (Lal and
Shukla 2004) and critical soil organic matter content (St) according to Pieri (1991)
as one of the most important parameters of soil structure stability were calculated as well.
The obtained results were statistically evaluated. Analysis of variance (ANOVA) was performed by using the Statgraphics Centurion XV.I (Statpoint
Technologies, Inc., USA). Treatment differences were considered significant at P
values < 0.05 by the LSD multiple-range test. Correlations between soil organic
matter and soil structure stability were determined.
RESULTS AND DISCUSSION
Stability, Water Resistance and Vulnerability Parameters of Soil Structure
The results of the effects of different soil management practices in a vineyard on stability, water resistance and vulnerability parameters of soil structure are shown in Table 1. In comparison to all soil management practices in a vineyard,
a higher stability index value of water-stable aggregates (1.64±0.17), but without statistical significance was seen during the treatment with ploughed farmyard
Malaysian Journal of Soil Science Vol. 17, 2013
42
especially the structure of soil (Pagliai et al. 1987; Mbagwu 1992; Obi and Ebo, 1995). In G+NPK3 (6.99±0.33), the most favourable values of the critical level of soil organic matter (statistically significant in comparison to all treatments) were observed during the period (2008-2011). Similarly, the values of crust index were the most favourable in G+NPK3. Index of crusting (Ic) is a very important parameter of soil structure based on textural composition and soil organic matter
content (Lal and Shukla 2004). Soil crust formation is dependent on soil tillage and fertilization as presented by Šimanský et al. (2008). In our case, the effect of
soil texture was eliminated because the experiment was based on one soil type
with a defined particle size distribution (569 g kg-1 of sand, 330 g kg-1 of silt and 101 g kg-1 of clay). This means the values of Ic have been affected by soil organic matter content (SOM). SOM is an important agent responsible for binding soil
mineral particles together (Oades and Waters 1991) and it decreases the amount of soil crust formed (Šimanský et al. 2008). The application of NPK fertilizers
(in 1st and 3rd intensities) as well as application of farmyard manure increased the content of SOM (Šimanský 2011a), which led to a decrease (positive effect) in Ic, but without statistical significance (Table 1). Agbede (2010) states that adding
a combination of organic manures together with NPK fertilizers to the soil can improve the physical properties of soils. For control, between values of mean weight diameters of structure aggregates (MWDs - dry pre-sieved) and mean weight diameters of water-stable aggregates (MWDm), the lowest differences were determined. In this case, this means that the vulnerability of soil structure (Kv) was the lowest. In comparison to all soil management practices in a vineyard, a higher value of Kv was seen in the T treatment. Tillage disrupts soil aggregates
and decreases SOM (Elliot 1986; Plante and McGill 2002). TABLE 1
Statistical evaluation of soil structure parameters
ISSN: 1394-7990 Malaysian Journal of Soil Science Vol. 17: x –x ( 2013) Malaysian Society of Soil Science
Malaysian Journal of Soil Science Vol. 17, 2013
TABLE 1
Statistical evaluation of soil structure parameters
Parameters Co T Soil management T+FM G+NPK3 G+NPK1
Sw 1.51±0.24a 1.63±0.15a 1.64±0.17a 1.58±0.11a 1.37±0.09a St 6.67±0.58b 5.69±0.72a 6.68±0.85b 6.99±0.33b 6.64±0.45b
Ic 0.88±0.14a 0.99±0.11b 0.87±0.19a 0.84±0.04a 0.88±0.06a
MWDs 2.17±0.11a 2.57±0.16b 2.36±0.21ab 2.38±0.19ab 2.30±0.14ab MWDm 1.20±0.05a 0.98±0.05a 1.11±0.08a 1.28±0.02a 1.04±0.04a
Kv 1.87±0.18a 3.14±0.38b 2.27±0.45a 2.05±0.28a 2.30±0.16a
Co – control, T – tillage, T+FM –tillage+farmyard manure, G+NPK3 –grass+NPK 120-55-195 kg ha-1,
G+NPK1 –grass+NPK 80-35-135 kg ha-1.
Different letters in the same column indicate that treatment means are significantly different at P<0.05 according to LSD.
St– critical level of soil organic matter, Ic– index of crusting, Kv– vulnerability coefficient, Sw – index of
stability, MWDs – mean weight diameter –dried sieve, MWDm - mean weight diameter of water-stable aggregates
Co – control, T – tillage, T+FM – tillage+farmyard manure, G+NPK3 – grass+NPK 120-55-195 kg ha-1,
G+NPK1 – grass+NPK 80-35-135 kg ha-1.
Different letters in the same column indicate that treatment means are significantly different at P<0.05
according to LSD.
St – critical level of soil organic matter, Ic – index of crusting, Kv – vulnerability coefficient, Sw – index of
stability, MWDs – mean weight diameter –dried sieve, MWDm - mean weight diameter of water-stable
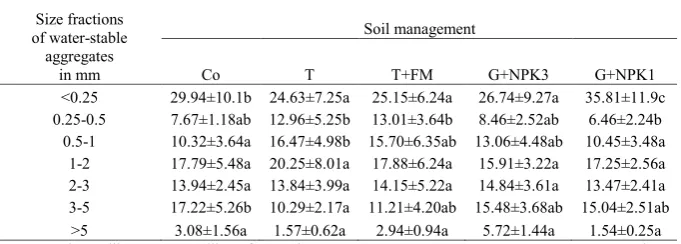
Malaysian Journal of Soil Science Vol. 17, 2013 43 Soil management practices had a statistically significant influence on the
content of water-stable micro-aggregates (WSAmi) during the 2008-2011 period. In T (25.15±6.24), the lowest content of WSAmi was determined; however, in
G+NPK1 (35.81±11.9) the highest content of WSAmi was detected (Table 2). In T,
the content of WSAmi was lowered by 18 % in comparison to the control. The main cause of decreased WSAmi could be the lower content of the SOM in WSAmi, just
as in the study of Scott (1998), as well as the disruption of soil macro-aggregates
(Six et al. 2002). However, in G+NPK3 (almost twice the dose of nutrients),
WSAmi content was lower by 25% in comparison to G+NPK1 (Table 2).
Correlations between Soil Chemical Properties, Soil Organic Matter and Soil Structure Parameters
In the soil solution, the concentration of hydrogen cations had a significant effect
on the soil crust. The higher values of pH as well as the lower values of hydrolytic acidity where the lower vulnerability of soil was used to create the soil crust were
observed in all soil management practices in the vineyard (Table 3). Stability of the soil structure is connected with acid soils (Scott 2000; Huffman et al. 2001). Roberts and Carbon (1971) recorded that water resistance does not develop under
alkaline conditions due to the higher solubility of humic substances. There are very important factors for the formation of a favourable structure of soil for the right quantity and quality of SOM (Fortun et al. 1989; Šimanský et al. 2007) which confirmed our results (Table 3). The higher content of total organic carbon
in soil positively affected Kv, St, Sw and Ic. The quality and stability of SOM also had a positive influence on Sw.
A very important factor for forming of individual size fractions of aggregates
is soil organic matter (Šimanský et al. 2007); on the other hand, it is not important
for all size fractions of aggregates because some aggregates are formed by chemical factors (Six et al. 2004). Correlations between chemical properties,
TABLE 2
Statistical evaluation of percentage of size fractions of water-stable aggregates
ISSN: 1394-7990
Malaysian Journal of Soil Science Vol. 17: x –x ( 2013) Malaysian Society of Soil Science
Malaysian Journal of Soil Science Vol. 17, 2013
TABLE 2
Statistical evaluation of percentage of size fractions of water-stable aggregates
Size fractions of water-stable
aggregates in mm
Soil management
Co T T+FM G+NPK3 G+NPK1
<0.25 29.94±10.1b 24.63±7.25a 25.15±6.24a 26.74±9.27a 35.81±11.9c
0.25-0.5 7.67±1.18ab 12.96±5.25b 13.01±3.64b 8.46±2.52ab 6.46±2.24b
0.5-1 10.32±3.64a 16.47±4.98b 15.70±6.35ab 13.06±4.48ab 10.45±3.48a 1-2 17.79±5.48a 20.25±8.01a 17.88±6.24a 15.91±3.22a 17.25±2.56a
2-3 13.94±2.45a 13.84±3.99a 14.15±5.22a 14.84±3.61a 13.47±2.41a
3-5 17.22±5.26b 10.29±2.17a 11.21±4.20ab 15.48±3.68ab 15.04±2.51ab
>5 3.08±1.56a 1.57±0.62a 2.94±0.94a 5.72±1.44a 1.54±0.25a Co – control, T – tillage, T+FM –tillage+farmyard manure, G+NPK3–G+NPK3 –grass+NPK 120-55-195 kg ha-1, G+NPK1 –grass+NPK 80-35-135 kg ha-1.
Different letters in the same column (a, b, c) indicate that treatment means are significantly different at P<0.05 according to LSD.
Co – control, T – tillage, T+FM – tillage+farmyard manure, G+NPK3 – G+NPK3 – grass+NPK 120-55-195 kg ha-1, G+NPK1 – grass+NPK 80-35-135 kg ha-1.
Different letters in the same column (a, b, c) indicate that treatment means are significantly different at
Malaysian Journal of Soil Science Vol. 17, 2013 44
organic matter and size fractions of water-stable aggregates are shown in Table
4. An important negative correlation was detected between pH and WSA 0.25-1 mm content. A 0.25-1 mm size fraction of WSA was formed in acid pH with a
higher portion of basic cations in sorptive complex. Highly negative correlations between WSAmi (r=-0.509, P<0.05), WSA 2-3 mm (r=-0.465, P<0.05) and exchangeable Na+ were found. These facts have been confirmed by several studies (Levy and Torrento 1995; Amézketa 1999; Bronick and Lal 2005). At the same time, we found a positive correlation between WSA 2-3 mm and CHWD. A positive correlation between WSAmi and QHS was also found.
CONCLUSION
The highest value of the critical level of soil organic matter was seen in the
treatment with higher doses of fertilization (3rd intensity). In the tilled treatment,
TABLE 3
Correlation coefficients between some chemical properties and soil structure parameters
TABLE 4
Correlation coefficients between chemical properties and size fractions content of
water-stable aggregates
ISSN: 1394-7990 Malaysian Journal of Soil Science Vol. 17: x –x ( 2013) Malaysian Society of Soil Science
Malaysian Journal of Soil Science Vol. 17, 2013
TABLE 3
Correlation coefficients between some chemical properties and soil structure parameters
Parameters Kv MWDs St Sw Ic
pH n.s. n.s. n.s. n.s. 0.455*
H n.s. n.s. n.s. n.s. -0.459*
TOC -0.546* n.s. 0.952*** 0.525* -0.459*
CL n.s. n.s. 0.638** n.s. -0.447*
CHWD n.s. n.s. n.s. n.s. -0.634**
CHA:CFA n.s. n.s. n.s. 0.580* -0.568**
QHS n.s. -0.475* n.s. -0.519* n.s.
QHA n.s. -0.469* n.s. n.s. -0.493*
n.s. – non-significant; *P<0.05; ** P<0.01; *** P<0.001;n = 20
St– critical level of soil organic matter, Ic– index of crusting, Kv– vulnerability coefficient, Sw – index of
stability, MWDs – mean weight diameter –dried sieve, H – hydrolytic acidity, TOC – total organic carbon, CL–
labile carbon, CHWD– hot water soluble carbon, CHA:CFA– carbon of humic acids to carbon of fulvic acids ratio,
QHS– colour quotient of humic substances, QHA– colour quotient of humic acids n.s. – non-significant; *P<0.05; ** P<0.01; *** P<0.001; n = 20
St – critical level of soil organic matter, Ic – index of crusting, Kv – vulnerability coefficient, Sw – index of
stability, MWDs – mean weight diameter –dried sieve, H – hydrolytic acidity, TOC – total organic carbon,
CL – labile carbon, CHWD – hot water soluble carbon, CHA:CFA – carbon of humic acids to carbon of fulvic acids ratio, QHS – colour quotient of humic substances, QHA – colour quotient of humic acids
ISSN: 1394-7990
Malaysian Journal of Soil Science Vol. 17: x –x ( 2013) Malaysian Society of Soil Science
Malaysian Journal of Soil Science Vol. 17, 2013
TABLE 4
Correlation coefficients between chemical properties and size fractions content of water-stable aggregates
Parameters >5 3Size fractions of water-stable aggregates in mm-5 2-3 1-2 0.5-1 0.25-0.5 <0.25 pH n.s. n.s. n.s. n.s. -0.552* -0.503* n.s.
S n.s. n.s. n.s. n.s. n.s. 0.449* n.s.
T n.s. n.s. n.s. n.s. n.s. 0.446* n.s.
Na+ n.s. n.s. -0.465* n.s. n.s. n.s. -0.509*
TOC n.s. n.s. n.s. n.s. n.s. n.s. n.s. CL n.s. n.s. n.s. n.s. n.s. n.s. n.s.
CHWD n.s. n.s. 0.512* n.s. n.s. n.s. n.s.
QHS n.s. n.s. n.s. n.s. n.s. n.s. 0.519*
QHA n.s. n.s. n.s. n.s. n.s. n.s. n.s. n.s. – non-significant; *P<0.05; ** P<0.01; *** P<0.001; n = 20
S – sum of basic cations, T – sorption capacity, Na+ - exchangeable Na, TOC – total organic carbon, C
L– labile
carbon, CHWD– hot water soluble carbon, QHS– colour quotient of humic substances, QHA– colour quotient of
Malaysian Journal of Soil Science Vol. 17, 2013 45
the highest vulnerability of the soil structure was observed. The application of nutrients in 1st intensity of fertilisation of the vineyard had a negative influence on the content of water-stable micro-aggregates; however, higher doses of
fertilization (3-rd intensity) had a positive effect on the decrease of water-stable
micro-aggregates. Overall, in the treatment of the application of nutrients in
3rd intensity of fertilization of the vineyard, the best structure state of soil was observed.
The quantity and quality of the soil organic matter as well as its stability are very important factors of stability, water resistance and vulnerability of soil structure in all soil management practices in a vineyard.
Soil structure cannot be evaluated only on the base of a one parameter, but it must always be assessed comprehensively using multiple indicators.
ACKNOWLEDGEMENT
This project was supported by the Scientific Grant Agency of the Ministry of
Education, Science, Research and Sport of the Slovak Republic and the Slovak
Academy of Sciences (No. 1/0300/11 and No. 1/0084/13).
REFERENCES
Agbede, T.M. 2010. Tillage and fertilizer effects on some soil properties, leaf nutrient concentrations, growth and sweet potato yield on an Alfisol in Southwestern
Nigeria. Soil and Tillage Research. 110: 25-32.
Amézketa, E. 1999. Soil aggregate stability: A review. Journal of Sustainable Agriculture. 14: 83-151.
Bronick, C.J. and R. Lal. 2005. The soil structure and land management: A review.
Geoderma. 124: 3-22.
Celette, F., R. Gaudin and C. Gary. 2008. Spatial and temporal changes in the water
regime of a Mediterranean vineyard due to the adoption of cover cropping. European Journal of Agronomy. 28: 153-162.
Dziadowiec, H. and S.S. Gonet. 1999. Estimation of soil organic carbon by Tiurin’s
method. Methodical Guide-Book for Soil Organic Matter Studies. 120: 7-8.
Elliott, E.T. 1986. Aggregate structure and carbon, nitrogen, and phosphorus in native
and cultivated soils. Soil Science Society of America Journal. 50: 627-633.
Fiala, K., J. Kobza, Ľ. Matušková, V. Brečková, J. Makovníková, G. Barančíková, V. Búrik, T. Litavec, B. Houšková, A. Chromaničová, D. Váradiová and B. Pechová. 1999. Valid Methods of Soil Analyses. Partial Monitoring System–
Malaysian Journal of Soil Science Vol. 17, 2013 46
Fortun, A., C. Fortun and C. Ortega. 1989. Efect of farmyard manure and its humic
fractions on the aggregate stability of a sandy-loam soil. Journal of Soil Science.
40: 293-298.
Glab, T. and B. Kulig. 2008. Effect of mulch and tillage system on soil porosity under
wheat (Triticum aestivum). Soil and Tillage Research. 99: 169-178.
Huffman, E., L.H. MacDonald and J.D. Stednick. 2001. Strength and persistence of fire-induced soil hydrophobicity under ponderosa and lodgepole pine, Colorado
Front Range. Hydrological Processes. 15: 2877-2892.
Jackson, L.E., F.J. Calderon, K.L. Steenwerth, K.M. Scow and D.E. Rolston. 2003.
Responses of soil microbial processes and community structure to tillage events and implications for soil quality. Geoderma. 114: 305-317.
Karlen, D.L. 2004. Soil quality as an indicator of sustainable tillage practices. Soil and Tillage Research. 78: 129-130.
Körschens, M. 2002. Importance of soil organic matter for biomass production and
environment a review. Arch. Acker-Pfl. Boden. 48: 89-94.
Lal, R. and M.K. Shukla. 2004. Principles of Soil Physics. New York: Marcel Dekker.
Levy, G.J. and J.R. Torrento. 1995. Clay dispersion and macroaggregate stability as
affected by exchangeable potassium and sodium. Soil Science. 160: 352-358. Loginov, W., W. Wisniewski, S.S. Gonet and B. Ciescinska. 1987. Fractionation of
organic carbon based on susceptibility to oxidation. Polish Journal of Soil Science. 20: 47-52.
Mbagwu, J.S.C. 1992. Improving the productivity of a degraded Ultisol in Nigeria
using organic and inorganic amendments. II. Changes in physical properties. Bioresource Technology. 42: 167-175.
Oades, J.M. and A.G. Waters. 1991. Aggregate hierarchy in soils. Australian Journal of Soil Research. 29: 815-828.
Obi, M.E. and P.O. Ebo. 1995. The effect of organic and inorganic amendments on
soil physical properties and maize production in a severely degraded sandy soil in southern Nigeria. Bioresource Technology. 51: 117-123.
Pagliai, M.M., L.A. Marca and G. Luca Mante. 1987. Changes in soil porosity in
remolded soil treated with poultry manure. Soil Science. 144: 128-140.
Malaysian Journal of Soil Science Vol. 17, 2013 47 Plante, A.F. and W.B. McGill. 2002. Soil aggregate dynamics and the retention of
organic matter in laboratory-incubated soil with differing simulated tillage frequencies. Soil and Tillage Research. 66: 79-92.
Roberts, F.J. and B.A. Carbon. 1971. Water repellence in sandy soils of Southwestern Australia. 1. Some studies related to field occurrence. Field Station Record. 10: 13-20.
Scott, A.N. 1998. Soil aggregation and organic matter mineralisation in forests and
grasslands: plant species effects. Soil Science Society of America Journal. 62: 1081-1089.
Scott, D.F. 2000. Soil wettability in forested catchments in South Africa: as measured
by different methods and as affected by vegetation cover and soil characteristics. Journal of Hydrology. 58: 87-104.
Six, J., R.T. Conan, E.A. Paul and K. Paustian. 2002. Stabilisation mechanisms of soil
organic matter: implications for C-saturation of soils. Plant Soil. 241: 155-176. Six, J., H. Bossuyt, S. Degryze and K. Denef. 2004. A history of research on the link
between (micro)aggregates, soil biota, and soil organic matter dynamics. Soil and Tillage Research. 79:7-31.
Šimanský, V. 2011a. Differences in aggregate stability of soil due to various fertilizers.
Agrochemistry. 50: 16-19.
Šimanský, V. 2011b. Soil structure of Haplic Luvisol as influenced by tillage and crop
residues ploughing. Acta phytotechnica et zootechnica. 14: 27-29.
Šimanský, V., E. Tobiašová and J. Chlpík. 2006. Influence of tillage system and
fertilisation on soil structure stability and chemical properties of Haplic Luvisol. Acta Phytotechnica et zootechnica 9: 75-80.
Šimanský, V., E. Tobiašová and J. Chlpík. 2008. Soil tillage and fertilization of Orthic Luvisol and their influence on chemical properties, soil structure stability and
carbon distribution in water-stable macro-aggregates. Soil and Tillage Research.
100: 125-132.
Šimanský, V., E. Tobiašová and A. Zaujec. 2007. Influence of soil organic matter on
aggregate stability of chernozems. Phytopedon (Bratislava). 6: 25-29.
Tisdall, J.M. and J.M. Oades. 1982. Organic matter and water-stable aggregates in
Malaysian Journal of Soil Science Vol. 17, 2013 48
Triberti, L., A. Nastri, G. Giordani, F. Comellini, G. Baldoni and G. Toderi. 2008. Can
mineral and organic fertilisation help sequestrate carbon dioxide in cropland? European Journal of Agronomy. 29: 13-20.
Valla, M., J. Kozák and V. Ondráček. 2000. Vulnerability of aggregates separated from
selected anthrosols developed on reclaimed dumpsites. Rost. Výr. 46: 563-568. White,R.E. 2009. Understanding Vineyard Soils. New York: Oxford University Press.