A
Machine
Learning
Based
Approach
for
Mobile
App
Rating
Manipulation
Detection
Yang
Song
1,
Chen
Wu
1,
Sencun
Zhu
1,∗,
Haining
Wang
2 1Penn State University, University Park, PA 168022University of Delaware, Newark, DE 19716
Abstract
In order to promote apps in mobile app stores, for malicious developers and users, manipulating average rating is a popular and feasible way. In this work, we propose a two-phase machine learning approach to detecting app rating manipulation attacks. In the first learning phase, we generate feature ranks for different app stores and find that top features match the characteristics of abused apps and malicious users. In the second learning phase, we choose top N features and train our models for each app store. With cross-validation, our training models achieve 85% f-score. We also use our training models to discover new suspicious apps from our data set and evaluate them with two criteria. Finally, we conduct some analysis based on the suspicious apps classified by our training models and some interesting results are discovered.
Received on 09 January 2019; accepted on 20 January 2019; published on 25 January 2019
Keywords: Machine Learning, App Store, Rating Manipulation, Attack Detection
Copyright © 2019 Yang Song et al., licensed to EAI. This is an open access article distributed under the terms of the Creative Commons Attribution license (http://creativecommons.org/licenses/by/3.0/), which permits unlimited use, distribution and reproduction in any medium so long as the original work is properly cited.
doi:10.4108/eai.8-4-2019.157415
1. Introduction
The current mobile application markets such as iTunes App Store, Google Play, Amazon App Store, Windows Phone App Store, etc. provide a very convenient and efficient way to distribute mobile apps. As of Feb. 2019, Google Play and iTunes host 2.45 millions and 1.3 millions of apps, respectively1. A statistical study [1] showed that in 2017, consumers downloaded 178.1 billion mobile apps and in 2022, this figure was projected to grow to 258.2 billion app downloads. Meanwhile, the total app store revenue of Google Play and iTunes has exceeded 18.2 billions in the Q3 of 2018 alone [2]. All these numbers show that if developers release very popular apps, they could make a huge amount of profit from these apps. From computer security’s perspective, those app stores become the targets of attackers for the two following reasons: 1) Users prefer to download apps with higher rating scores when they have multiple choices, because they usually consider higher average rating stands for higher quality; 2) App store providers show various app ranking
∗
Corresponding author. Email:[email protected] 1http://www.apptrace.com/
charts in their front pages and the higher ranking apps receive more attention and hence more downloads. App store providers’ ranking algorithms [3] take reviewers’ ratings as an important factor. Consequently, some companies started the business to provide app promotion services and some of them even claim that they could keep the ranks that developers want for some periods, according to news articles [4].
Purifying app stores becomes one of the app store providers’ primary interests. However, detecting app rating manipulation is difficult due to the following reasons: 1) massive number of accounts, reviews and apps makes it impossible to manually investigate the whole app store. Even it is possible to hire many people to manually investigate apps, discriminating malicious users from normal users is very difficult because rating reflects user’s opinion and opinion is often biased, and recent deep learning techniques [5] have enabled automatic generation of fake online user reviews that are similar to human-generated reviews. 2) many researchers have studied rating manipulation on online shopping websites. But compared with traditional products, mobile apps are either more accessible and their data are more noisy. Apps are more accessible because app stores are available in many countries and
developers may publish their apps world widely just by one click. For attackers, they can switch countries in app stores and attack apps across regions. Apps’ data are more noisy because apps have to be run on the top of hardware(smartphone) and OS. If hardware or OS gets upgraded, apps have to be optimized for the updates too. Failure to do so may result in lower average rating or app crash. More importantly, numbers of downloads and reviews are sensitive to app price. For traditional online shopping websites, 50% percentage discount is very rare, and even so, customers still have to pay. If a paid app drops its price to free, it’s very likely that many more users will download it. Besides, advertisements will introduce more noise to apps’ data.
Those difficulties and extremely noisy data lead us to seek machine learning for help. A big advantage of machine learning is that it provides an automatic way to figure out a model that human being is not able to conceive, and we can use this model to discover attacked (abused) apps. After analyzing the data we crawled from app stores and considering characteristics of malicious users and abused apps, we leveraged a supervised machine learning algorithm to design our classification model.
Our approach aims to detect abused apps directly instead of detecting attackers, which also can be used to discover abused apps indirectly. This is because: 1) detecting attackers is difficult due to the reasons we mentioned above; 2) apps that have been rated by attackers do not necessarily mean they have been abused. More information is needed to confirm this relation. To build a training set, we used an algorithm [6] to find an initial group of abused apps for us and, meanwhile, we select benign apps manually. We use a 2-step learning procedure to finalize our training model for each app store. Using cross-validation, our training models could reach 85% f-score given the fact that data are extremely noisy. We take a further step and use our training models to discover more apps from the data that are not included in the training set. About 5% suspicious apps are discovered from each app store and the results are justified even with few direct evidences.
This paper has the following contributions:
1. We characterized abused app, malicious user and collusion group they form.
2. We leveraged a machine learning based method to detect abused apps directly, bypassing the difficulties such discriminating attackers from normal users, data noise, etc..
3. We selected 55 features and gave feature rankings for each app store. We found that top features match our definitions and characteristics of abused apps, malicious users and collusion groups. These feature rankings can be used to
further improve our training model performance, and other researchers who want to use different learning algorithms to detect abused apps could consider using these rankings directly.
4. We analyzed the abused apps discovered by our training models and some interesting results were found.
Section2provides formal definitions and characteri-zations of of abused apps, malicious users and collusion groups. All 55 features are presented in Section3. The machine learning approach and some detailed feature analyses are explained in Section4. The testing is con-ducted in Section 5. We present some related work in Section 7Section8 concludes the paper and discusses some future work.
2. Preliminaries
To simplify our terms, in this paper, “user” only refers to a user who rates apps; “reviewer” only refers to a user who rates apps and leaves comments.
2.1. Definitions
For any app stores, the motivation of establishing an online rating system is to help users know the true quality of apps. Here we give our definition for true quality.
Definition 1.Let the total number of raters be N and r= (r1, r2, . . . , rN) is a vector that contains ratings of all
raters.True qualityτis the expected value of N users’ ratings, or
τ=
N
P
i=1
ri
N , (1)
whereN → ∞.
Intuitively, abused app means an app’s average rating has been manipulated and its rating cannot correctly reflect itstrue quality. There is no direct way to know app’s true quality. Indirectly, as largely adopted today, app stores expect a large number of users will rate apps and leave comments, and hopefully, the average rating could be as close to the app’s true quality as possible. From an individual user’s perceptive, there are two problems:
1. Evaluating user’s experience with number is hard and inaccurate. No global standard defines the necessary conditions of a 5-star app, nor the necessary conditions of a 1-star app.
one app is perfect in terms of user interface, but poor in security; 2) Experience plays an important role. A user who has used more than 100 apps may not think Skype is the best app he has ever used. But for intro-level user, he might think Skype is the best app; 3) Apps usually support different versions of OS and hardware. An app could run perfectly on OS version 2.0 but crash on OS version 3.0.
Therefore, it is not safe to assume that average rating could accurately evaluate an app’s truequality. But to some extent, it canreflectsthe quality of an app. It is not likely that an app that is often crashed on any supported devices could gain 5-star average rating. Another way to look at this problem is that true quality of an app is the expected value of all its users’ ratings, including users that will rate this app in the future(theoretically, infinite number of users could rate this app) and each user in the data we have crawled is just one random variable that could reflect the expected value more or less. According to Hoeffding inequality[7], the larger the number of ratings, the closer this app’s average rating will be to itstrue quality.
For this problem, Hoeffding inequality states that for any sample size N and vector of independent ratings
Λ= (λ1, λ2, . . . , λN),
P[|E(Λ)−τ|> δ]≤2e−2δ2N, (2) whereδis the difference between average ratingE(Λ) and app’strue qualityτ.
To confidently ensure thatδis very small, the number of ratings N has to be relatively large. Therefore, we have the following theorem:
Theorem 1.For a relatively large number of ratingsNand each rating is independent from others, average rating
σ =τ+, whereτis the true quality of an app, andis the deviation constant.
Rating is time sensitive. On the one hand, rating may change as an app’s truequality changes. Version changes, OS updates and device update usually lead to rating changes. On the other hand, in some cases, even an app’s true qualityremains the same, its rating may change if similar apps come out later but provide more features and better user interface. Here, we give the definition of environment factor:
Definition 2.Environment factoris an factor that could affect users’ ratings for an app without any intention to manipulate that app’s average rating. Those factors include but are not restricted to version update, OS update, device update and release of similar apps.
According to the discussion above, we give our definition of abused app:
Definition 3.Let an app’s true quality be τ and its average rating σ. During a period of time t, when no environment factors are present, if|τ−σ|> , where is deviation constant, then we say this app is anabused app.
2.2. Characteristics of Abused App and Malicious
User
While users might be biased, when a large amount of benign users rate an app, the average rating will be close to its true quality. The definitions of benign user and malicious user are:
Definition 4.A user who rates apps only based on his/her own experience is abenign user.
Definition 5.A user is a malicious user if he/she rates apps not based on his/her own experience and his/her rating deviates from the true quality of app byη, where |η|>0.
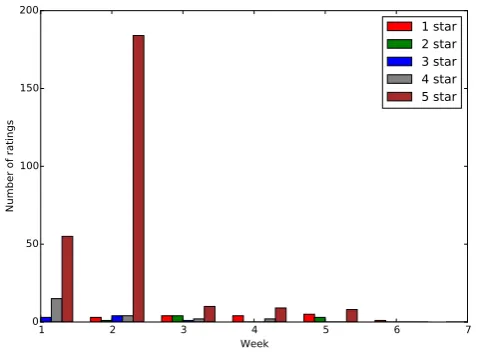
To effectively manipulate the ratings, it has to involvemanymalicious users who appear in a relatively short period of time. If only a small number of malicious users rate an app, its average rating may not change abruptly. Theoretically, presence of extremely biased ratings in a very short period time is not a necessary condition for rating manipulation. However, by observation, we find that it is a normal case for rating manipulation. Figure1plots the number of raters for each star of the app with app ID 445798230 and version 2.1. What makes this app suspicious (we will later confirm that this app is abused) are: 1) there is a huge spike of number of 5-star ratings in week 2; 2) The spike only occurred on 5-star rating.
1 2 3 4 5 6 7
Week 0
50 100 150 200
Number of ratings
1 star 2 star 3 star 4 star 5 star
Mohammad, et al.[8] proposes the idea of collusion group in rating manipulation. For app’s rating manipu-lation, [6] modifies the definition of collusion group and gives the following definition:
Definition 6.Collusion group is an attacking group where all the members are malicious users and there exist a set of apps whose ratings have been manipulated by some of them. To be more generic, collusion group is a set of adjacent subgroups where each subgroup works as an unit to attack an app each time. To be considered as adjacent, two subgroups must share some raters.
Essentially, one collusion group is formed by several bi-clique communities[6, 9]. It’s shown that the existence of collusion group is a necessary condition for rating manipulation. Another feature of collusion group is that the rating histories of group members are similar, which means group members usually rate apps on the same day or in the same week. This feature conceptually matches the conditions of app rating manipulation — large number of malicious users and in a short period of time.
According to Definition3,6and Theorem1, we have the following theorem:
Theorem 2.In a period of timet, an app is anabused app if it satisfies all the following conditions:
1. No environment factors are present.
2. There exists at least one collusion group.
3. Number of ratingsN is relatively large.
4. Let the current average rating be ˆσ, and average rating without the effect of collusion group beτ. |σˆ−τ|> .
In fact, we are capable of estimating N by using Hoeffding inequality. Assume that we want to be sure thatδis 0.1, then we can have the following calculation:
P[|E(Λ)−τ|>0.1]≤2e−2(0.1)2N (3) WhenN = 100,P[|E(Λ)−τ| ≤0.1]≥0.7293. WhenN = 200,P[|E(Λ)−τ| ≤0.1]≥0.9634. It means, for an app, if the number of total raters is larger than 100, we have more than 72.93% confidence to claim that its current average rating is close to its true quality; if the number of total raters is larger than 200, we have more than 96.34% confidence to claim that its current average rating is close to its true quality.
Note that one of Hoeffding inequality’s assumptions is that ratings are independent from each other. If there exist multiple collusion groups, theorem1will not hold. But consider these three situations:
1. If no collusion group exists, we are safe to assume that all the ratings are independent (it’s possible
that only few ratings are not). In this case, given a large number of ratings, we could precisely estimateτ;
2. If collusion groups exist and the number of ratings is small, we cannot even confidently estimateτ. Therefore, we should not label this app as an abused one;
3. If collusion groups exist and the number of ratings is large, practically, compared with number of ratings, the size of collusion groups only takes a very small fraction. In this case, if we remove collusion groups from ratings, we will still be able to estimateτ.
Assume no environment factors are present. In order to archive the manipulated average rating ˆσ =τ+
0(0> ), the size of collusion group has to be:
S = 0N
η−0, (4) whereη=λ−τ andλis the rating that each malicious user gives.
To significantly manipulate app average rating with a small collusion group,ηshould be as large as possible, which means collusion group members usually always give 5-star ratings. For app A with rating user population N = 10000 and average rating τ = 3.5, in order to reach ˆσ = 3.8, the size of collusion groupS ≈ 834, assuming that every collusion group member gives 5-star ratings (λ= 5). If every collusion group member gives 4-star rating(λ= 4), the collusion group size will beS= 5000. This also explains the reason that collusion group usually rates an app at a relatively short time window: if N increases by time, S has to increase as well.
Therefore, we have the following theorem for malicious users:
Theorem 3.A user is amalicious user if the following conditions are satisfied:
1. He is a member of at least one collusion group.
2. In all malicious events he participates, most of ratings are he gives are either 4-stars or 5-stars.
2.3. Threat Models
We have known that to manipulate an app’s average rating, collusion groups have to exist. But how are collusion groups formed? We found two possible ways for malicious users to form a collusion group.
consecutive user IDs. That is because attackers may use some tools to generate those fake user IDs and iTunes generates user IDs incrementally. But this characteristic cannot be found in other app stores as they may use hash code as user IDs.
2. Indirect Formation means someone indirectly hires a group of malicious users. For example, we found that some websites welcome volunteers to purchase apps and leave comments. Volunteers will get total refund and bonus after that. No fake IDs are needed in this attack, so consecutive IDs usually will not be found.
3. A Machine Learning Approach
3.1. Why Use Machine Learning?
Even we know the characteristics of abused apps, it’s still very difficult to find out them due to the following reasons:
1. Defining a threshold number of ratingsN is hard. 2. Finding the exact value ofis difficult.
3. Detecting a collusion group in a malicious app is unreachable by human. To verify a group is a collusion group, we have to make sure it has attacked at least two apps. This process is time-consuming. It is possible that a collusion group only attack one app, but we will lose it since we could not verify its existence. Therefore, we need to find other features that could reflect the existence of collusion group.
4. It’s nearly impossible to rule out all environment factors.
The above reasons motivate us to use machine learning to overcome the difficulties we face. The goal of machine learning is to find a hypothesis h from hypothesis setHthat is closest to the functionf, which is a function mapping a vector x to y[10]. For this problem, vector x denotes the values of features for each app and y is a binary value indicates if this app is abused or not.
With the help of machine learning, we do not have to worry about finding exact values ofN,and exact values of features describing the existence of collusion group, because we can leverage machine learning algorithms to find thebesthfrom a training dataset.
The way we decide the best training model h is to minimize both Etrain and Etest given a dataset, where
Etrain is the error rate that h has in training set and
Etestis the error rate thathhas in the complete data set,
no matter what evaluation method we use to calculate error rates. However, measuring Etest is tricky since
there is no way to know Etest. That is why
cross-validation[11] is important — only use a part of original training data as new training data and use the rest to measure Etest. While we may not be able to find a
training model h that minimizes bothEtrain and Etest,
it is feasible to find a training model hthat minimize
Etestand has relative smallEtrainusing cross-validation
method. In this way, we can avoid both overfitting and under-fitting problem.
In machine learning, factors that we cannot control or expect are noises. In this problem, environment factors can be treated as noises. However, not all environment factors are uncontrollable. iTunes App Store provides version information for each comment, therefore, we may generate some features based on version. By avoiding fitting training data perfectly (overfitting), the effects of noise to training data will be minimized[12]. This is another advantage we want to take from machine learning.
3.2. Features
Feature is a numeric value describing data from one or more aspects. We transform the data we crawled from app stores into different features so that learning algorithms are able to learn from the data. In this section, we will discuss all the features we select.
Primary Features. We define primary features as the features that can be collected from the raw data itself without further processing and transformation. For bet-ter understanding, we will use some space to elaborate them in the patternf eature_name(f eature_ID). average_rating(1) : average of all ratings.
total_rater(2) : number of all ratings.
1star_num(3) : number of all 1 star ratings.
2star_num(4) : number of all 2 star ratings.
3star_num(5) : number of all 3 star ratings.
4star_num(6) : number of all 4 star ratings.
5star_num(7) : number of all 5 star ratings.
price(8) : 1 if this is a paid app; otherwise 0.
Advanced Features. Besides the primary features that are ready to be used without any pre-processing, we want to transform the comment and reviewer data into more advanced features.
num_dev(9) : a developer may develop more than one apps. This feature describes how many apps a developer has developed.
To describe the reviewers’ behavior, we define the following terms:
Definition 7.If a reviewer gives 4 or 5 stars for all the apps that he/she has rated, he/she is apositive reviewer; if a reviewer gives 1 or 2 stars for all the apps that he/she has rated, he/she is anegative reviewer.
Many reviewers only rate app once, so it might be risky to label those reviewers as positive reviewers or negative reviewers. To avoid this potential pitfalls, we define the following terms:
Definition 8.If a positive reviewer rates 3 or more apps, he/she is extremely positive reviewer; if a negative reviewer rates 3 or more apps, he/she is extremely negative reviewer.
num_pos_reviewer(10) : number of positive reviewers of this app.
perc_pos_reviewer(11) : percentage of positive reviewers, or totalnum_number_pos__reviewerof_reviewer. Note that
total_number_of_reviewer is not total_rater, because reviewers leaves comments in addition but raters do not.
num_neg_reviewer(12) : number of negative review-ers of this app.
perc_neg_reviewer(13) : percentage of negative reviewers, or totalnum_number_neg__reviewerof_reviewer.
num_extr_pos_reviewer(14) : number of extremely positive reviewers of this app.
perc_extr_pos_reviewer(15) : percentage of extremely positive reviewers of this app, or
num_extr_pos_reviewer total_number_of_reviewer.
num_extr_neg_reviewer(16) : number of extremely negative reviewers of this app.
perc_extr_neg_reviewer(17) : percentage of extremely positive reviewers of this app, or
num_extr_pos_reviewer total_number_of_reviewer.
Helpfulness might be useful as well.
helpfulness_ratio_avg(18) : helpfulness ratio is
number_of_people_agree
number_of_people_agree+number_of_people_disagree.
This is the average of helpfulness ratio, or
P
helpf ulness_ratio number_of_comment.
num_helpfulness(19) : number of comments whose helpfulness ratios are greater than 0.
perc_helpfulenss(20) : percentage of comments whose helpfulness ratios are greater than 0, or
num_helpf ulness number_of_comment.
Variance is able to describe how much fluctuation a feature has. We aggregate comment data by week. We think it is an appropriate granularity since we only have data divided in days and usually rating manipulation spans weeks. The term “rating” in the following paragraphs is only the rating with comments, since only comments have date information.
var_num_comment_by_week(21) : variance of num-ber of comments by week.
var_avg_rating_by_week(22) : variance of average ratings by week.
var_perc_rating_by_week(23, 24, 25, 26, 27) :
variance of percentage of 1, 2, 3, 4 and 5 star ratings by week.
var_perc_pos_reviewer_by_week (28): variance of percentage of positive reviewers by week.
var_perc_neg_reviewer_by_week (29): variance of percentage of negative reviewers by week.
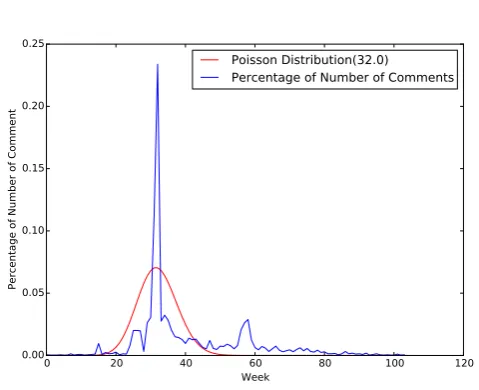
We notice that when an app is just released, or there is a version update, there will be some spike in terms of number of ratings. Poisson distribution is often used to describe those spikes. To let user know about new apps, app stores usually put them into a new category, which is located in an obvious place on the front page. A few days or weeks later, other new apps come and replace those old ones. Another case is, when an app is updated, people who have used it tend to download and rate it or leave comment on it again. Commercials and ads may attract users’ attention too. All these factors could lead to spikes of reviews, and number of reviewers usually follow the Poisson distribution.
0 20 40 60 80 100 120 Week
0.00 0.05 0.10 0.15 0.20 0.25
Percentage of Number of Comment
Poisson Distribution(32.0) Percentage of Number of Comments
Figure 2. Poisson Fitting(app ID: 460351323; Store: iTunes China)
0 10 20 30 40 50 60 70 80 90
Week 0.00
0.02 0.04 0.06 0.08 0.10 0.12 0.14 0.16 0.18
Percentage of Number of Comment
Poisson Distribution(6.0) Poisson Distribution(39.0) Percentage of Number of Comments
Figure 3. Poisson Fitting(app ID: 521134765; Store: iTunes China)
locating all the Poisson distributions, we are able to use those data as features.
poisson_num_peaks(30) : number of Poisson distribu-tions we find.
poisson_first_peaks(31) : relative position of first Poisson distribution (the one with smallestλ), or
min(λ)
number_of_weeks.
poisson_last_peaks(32) : relative position of last Poisson distribution (the one with largest λ) or
max(λ)
number_of_weeks.
We define the following terms to capture special weeks:
Definition 9.If during one week, all the ratings are 4 or 5 stars, this week is apositive week; if all the ratings are 1 or 2 stars, this week is anegative week.
Then we select the following features:
num_week(33) : number of weeks of this app’s lifespan (or till now).
num_pos_week(34) : number of positive weeks.
num_neg_week(35) : number of negative weeks.
perc_pos_week(36) : percentage of positive weeks, or
num_pos_week num_week .
perc_neg_week(37) : percentage of negative weeks, or
num_neg_week
num_week .
max_pos_week(38) : largest number of continuous weeks that all of them are positive weeks.
perc_max_pos_week(39) : percentage of largest num-ber of continuous weeks that all of them are positive weeks, ormaxnum_pos_week_week.
max_neg_week(40) : largest number of continuous weeks that all of them are negative weeks.
perc_max_neg_week(41) : percentage of largest num-ber of continuous weeks that all of them are negative weeks, ormaxnum_neg_week_week.
Even though app version is an environment factor, we want to capture its affect. We firstly treat each version of app as an individual app, then normalize it.
var_perc_pos_reviewer_by_week_by_version(42) : summation of variances of percentage of positive reviewers by week, then normalized by number
of versions, or
n P
i=1
var_perc_pos_revieweri
n , where n is
number of versions.
var_perc_pos_reviewer_by_week_by_version(43) : summation of variances of percentage of negative reviewers by week, then normalized by number
of versions, or
n P
i=1
var_perc_pos_revieweri
n , where n is
number of versions.
var_num_reviewer_by_week_by_version(44) : sum-mation of variances of number of reviewers by week, then normalized by number of versions, or
n P
i=1
var_num_revieweri
n , wherenis number of versions.
var_avg_rating_by_week_by_version(45) :
summation of variance of average ratings by week, then normalized by number of versions, or
n P
i=1
var_avg_ratingi
var_perc_1_star_rating_by_week_by_version(46) : summation of variance of percentage of 1 star ratings by week, then normalized by number of
versions, or
n P
i=1
var_perc_1_star_ratingsi
n , where n is
number of versions.
var_perc_2_star_rating_by_week_by_version(47) : summation of variance of percentage of 2 star ratings by week, then normalized by number of
versions, or
n P
i=1
var_perc_2_star_ratingsi
n , where n is
number of versions.
var_perc_3_star_rating_by_week_by_version(48) : summation of variance of percentage of 3 star ratings by week, then normalized by number of
versions, or
n P
i=1
var_perc_3_star_ratingsi
n , where n is
number of versions.
var_perc_4_star_rating_by_week_by_version(49) : summation of variance of percentage of 4 star ratings by week, then normalized by number of
versions, or
n P
i=1
var_perc_4_star_ratingsi
n , where n is
number of versions.
var_perc_5_star_rating_by_week_by_version(50) : summation of variance of percentage of 5 star ratings by week, then normalized by number of
versions, or
n P
i=1
var_perc_5_star_ratingsi
n , where n is
number of versions.
We found that in normal apps, the increment of number of reviewers will lead to increment of number of each star. Xie and Zhu [13] point out that, in normal apps, correlation coefficient between number of reviewers and average rating in each week should be close to 0, which means these two factors should have no apparent relation and should have no effect to each other. Therefore, we could have the following features:
coef_pos_neg_rating_by_week(51) : correlation coef-ficient between numbers of 1, 2 star ratings and 4, 5 star ratings by week.
coef_1_5_num_rating_by_week(52) : correlation coefficient between numbers of 1 star ratings and 5 star ratings by week.
coef_2_5_num_rating_by_week(53) : correlation coefficient between numbers of 2 star ratings and 5 star ratings by week.
coef_3_5_num_rating_by_week(54) : correlation coefficient between numbers of 3 star ratings and 5 star ratings by week.
coef_avg_num_rating_by_week(55) : correlation coefficient between average rating and number of raters by week.
Summary. In this section, we basically elaborate all the features that we collect and build from our data. Two kinds of features are included: 1) app’s primary features and 2) app’s advanced features describing its ratings, comments and reviewers information. In Section 4.5, we will discuss features’ rankings by importance and how we use machine learning algorithms to generate training model from training data and those features.
4. Training
4.1. Dataset Collection
We built a multi-threaded crawler to collect app information from three iTunes App Stores located in US, China and UK, respectively. We crawl three kinds of webpages in app stores: app overview pages, comment pages and user profile pages. App overview page usually contains number of ratings, average ratings, general description, app permissions, etc.. Comment page contains the names and IDs of reviewers and comments’ dates and contents. iTunes(Apple App Store) also provides the corresponding app version for each comment. User profile page contains all comments that each user leaves.
Our data crawling was performed in 2013. Table 1 lists the data size we have for these three app stores.
4.2. App Discrimination For Training Set
Training set is required for any machine learning problems, because our final hypothesis functionf has to learn from it. To guarantee the performance of our training model, our training set has two following requirements:
1. The size of our training set should be large enough.
2. Training set should be not be biased.
4.3. Abused App Detection For Training Set With
Confirmation Of Existence Of Collusion Groups
We use an algorithm proposed by Xie and Zhu [6] to detect abused apps for our training set. This algorithm has the following features:
1. Threshold constants such as number of ratings
N, correlation coefficients between different attributes, threshold of collusion group size, etc. are pre-defined.
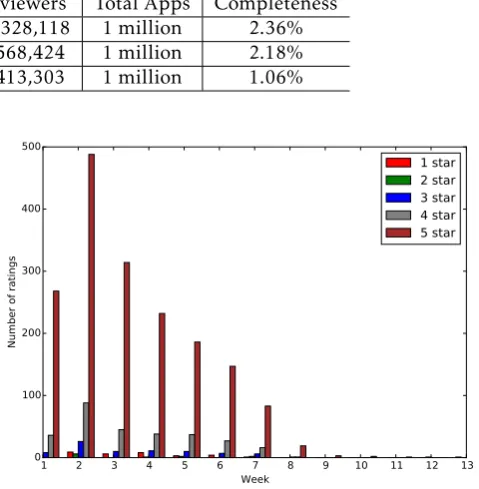
Table 1. Data Size Table. Here Completeness is approximated percentage of apps we have crawled in an app store. Since no data could be found to show the actual sizes of iTunes App Stores in China and UK, we assume 1 million (the same as the U.S market, as of 2013) in calculating completeness.
App store Apps Comments Reviewers Total Apps Completeness
iTunes(U.S) 23,616 18,925,438 10,328,118 1 million 2.36%
iTunes(China) 21,831 9,320,807 5,568,424 1 million 2.18%
iTunes(U.K) 10,579 11,761,493 6,413,303 1 million 1.06%
3. Other constraints that could indicate rating manipulation are considered.
The most important advantage of this algorithm is that it will confirm the existence of collusion groups. Therefore the true positive rate of this algorithm is very high. However, confirmation can be made only if the collusion group has attacked at least two apps, presuming that those apps have been crawled by us. Therefore, if collusion groups that have only attacked one app, or only one of apps that has been attacked by collusion groups in our dataset, we will not be able to detect neither collusion groups and abused apps. Even this is a problem, with the help of this algorithm, our training model is still able to know what abused apps look like and figure out the distinctions between abused apps and benign(normal) apps.
Picking Apps For Training Set Manually. Section4.3only detects abused apps for training set. In order to both increase the size of training set and keep training set as unbiased as possible, we also manually detect abused apps and pick normal apps from our data set.
The method of manually detecting abused apps is: 1) looking for rating spikes that are similar to one shown figure1in one version of app; 2) confirming that there is at least one collusion group that has attacked at least two apps; 3) taking a look at the content of reviews left by the members of collusion groups. The usual case is that malicious users tend to leave short comments containing less valuable information.
This method has both pros and cons:
Pros the algorithm we use to automatically find abused apps uses very strong constraints. Our method could find some abused apps that this algorithm missed.
Cons we could possibly missed some abused apps since the review data is too large for human being to process.
We only label abused apps and put them into training set and ignore the rests. Therefore, training set only contains abused apps that can be theoretically confirmed.
To pick benign apps for training set, we use the following four methods:
1 2 3 4 5 6 7 8 9 10 11 12 13
Week 0
100 200 300 400 500
Number of ratings
1 star 2 star 3 star 4 star 5 star
Figure 4. Number of Each Star (App ID: 585027354, Version: 2.0)
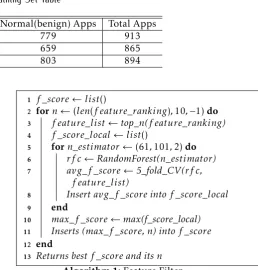
1. Almost all ratings are 4 stars or 5 stars. Figure4 falls into this case. This app turns out to beGoogle Map. Although there is a huge spike in this graph, it is normal as this app’s numbers of total ratings by week could be fitted to Poisson distribution nicely, which indicates that this spike is created by a normal user behavior. Moreover, the numbers of 1 stars and 2 stars increase or decrease as the numbers of 4 and 5 stars go up or down.
2. Apps that are publicly known due to their good qualities and their high average ratings (between 4-star and 5-star). It seems very risky to label those apps as benign ones, but is actually understandable. If an app’s rating is very high, such as 4.5 and is always that high, even if collusion groups exist, it’s unlikely thatcould be larger than deviation threshold. If the deviation threshold is= 0.5, then it’s impossible for this app to reach this threshold. “Publicly known” means the number of ratings N is relatively large, so it’s extremely difficult to manipulate the average rating, as shown in equation4.
Amazon, etc.. Those companies have been playing with software and its market for a long time and users usually will download their apps just because they rely on the services these companies provide, such as Google Map, Facebook, Pages and so forth.
4. Apps whose numbers of reviews are less than 100. As we shown in Section2.2, we only have 72.93% confidence to claim that app’s current average rating is close to its true quality within 0.1. We select some of those apps and put them into our training set.
These four methods basically cover popular apps, unpopular apps, high average rating and low average rating apps, aiming to reduce the bias of training set. Readers may question us about the correctness of our methods, especially method 3. In Section 4.3, we will justify them.
Training Set Overview. By applying the methods we proposed above to pick our training set, we have the following data as our training sets.
We would like to mention that in machine learning theory, picking training data is very tricky, specially when we are able to pick data by ourselves. If the training data are biased, our training model will be biased as well. To mitigate these potential issues, when we are picking benign apps, not only did we try to make sure the apps are benign, but also, from the whole training set’s perspective, make sure that we are building a mini version of iTunes app store. That’s why we put popular apps, unpopular apps, high average rating apps and low average rating apps, high ranking apps, low ranking apps, apps that have been published for a very long time and newly released apps into our training set.
Ground Truth. Readers may question us about the absence of ground truth for training set and we do have the following explanations:
1. Ground truth is not a necessary condition for machine learning problems. Ground truth refers to the correctness (accuracy) of a test set’s classification for supervised learning. However, many supervised learning do not have ground truth in the first place. Some banks use machine learning to decide whether their applicants are qualified for credit cards or not. The training set they use is gathered from historical decisions made by credit officers. However, whether an applicant is truly qualified for credit cards are unknown since banks could not have the complete information about applicants and applicants could lie about their annual income and other financial information. In this case, the decision
sometimes is based on how much trust credit officers have for applicants.
2. Asking ground truth for an opinion based behavior is difficult. Rating manipulation is similar to credit card application, whether an app is abused or not is basically based on how much trust we have for ratings (or users themselves). From app market providers’ perspective, if they trust all the ratings, no app is abused; if they don’t trust any ratings, all apps are abused. If some organizations or authorities could possibly give us the ground truth, it is still based on their opinions. For any online rating system research, no researchers have claimed that they have ground truth[14][15]. Theorem2and lemma 1are our baselines for discriminating abused apps from benign ones.
3. The goal of using machine learning in this problem is not ruling out human’s intervention. Since whether an app is abused or not is subjective, using machine learning aims to narrow down the scope of the highly suspicious apps instead of replacing human’s work, especially when highly sensitive decisions have to be made.
4. To avoid the arguable discrimination, we only label abused apps that we are confident with. High accuracy is good for any machine learning problems. But for abused app detection, it is more safe to assume a suspicious app as benign one than an abused one. Therefore, we also expect a higher precision (the percentage of labeling an app as an abused one correctly) in cross-validation. Readers may question us about method 2 and 3 we use to pick benign apps in Section 4.3. But both methods show that we tend to draw a line between companies that the public trust and companies who need rating manipulation to promote their apps. Including trustworthy companies’ apps into training data has another advantage: both abused apps and benign apps’ rating can be affected by environment factors(defined in definition 2). By doing so, we could indirectly tell the learning algorithm that some data influenced by environment factors are noise and should not be taken into consideration while it is learning the training data and making classification.
4.4. Training With Random Forest
Table 2. Training Set Table
App store Abused Apps Normal(benign) Apps Total Apps
iTunes US 134 779 913
iTunes China 206 659 865
iTunes UK 91 803 894
sub-samples of the dataset and uses averaging to improve the predictive accuracy and control over-fitting. “Forest” refers to decision tree[18], where each node corresponds to one of the input variables; each leaf represents the target variable’s value. “Random” refers to the method of choosing m variables from total M
variables randomly for each node of the tree and sample training set for each tree randomly [19]. The algorithm of how each tree is grown as follows:
1. SampleN training cases randomly from original training set as new localized training set for growing the tree, whereN is the size of original training set.
2. For each node in the tree,minput variables are selected from totalMvariables andmM. 3. Each tree is grown to the largest extent possible.
The number of estimators(trees) is not specified. Increasing number of estimators does not always guarantee better accuracy [20], so we will try different numbers of trees when we are training our models.
Among many popular machine learning algorithms such as SVM [21], neural network [22], deep learn-ing [23], etc., we choose random forest as our learning algorithm due to the following several reasons:
1. It runs efficiently on large data set.
2. It gives estimates of what variables are important in the classification. We will use this advantage to analyze our features in Section4.5.
3. The algorithm itself does not overfit when increasing the number of trees in the forest. Random forest use “bagging”[24] to select a subset of training data to grow a tree and use the rest of them to do internal validation.
To improve our training model [25], we do not use the training model generated byrandom forest(a). Instead, we use feature filter to work with random forest(b) to select topnfeatures –nis chosen by comparing the evaluations performed with 5-fold cross-validation. We use algorithm1to select the best topnfeatures.
The inner loop will iterate over different number of trees(n_estimator) in random forest algorithm to find the best number of trees for it, as we mentioned in the beginning of Section 4. n_estimator is always an odd
1 f_score←list()
2 forn←(len(f eature_ranking),10,−1)do 3 f eature_list←top_n(f eature_ranking) 4 f_score_local←list()
5 forn_estimator←(61,101,2)do 6 rf c←RandomForest(n_estimator) 7 avg_f_score←5_fold_CV(rf c,
f eature_list)
8 Insertavg_f_scoreintof_score_local 9 end
10 max_f_score←max(f_score_local) 11 Inserts (max_f_score,n) intof_score 12 end
13 Returns bestf_scoreand itsn
Algorithm 1:Feature Filter
number in order to make sure classification results are deterministic since each tree takes a vote for the target value. The outer loop will select topn(nfrom 10 to 55 in this case) and pick the best f-score from the inner loop.
There is a theory behind the feature filtering step. VC-dimension[26] is introduced to measure the complexity of the size of hypothesis set H, denoted by |H|. The more features that we use to training our model, the larger |H| is, so is the VC-dimension. However, practically speaking, the smaller VC-dimension will result in under-fitting and the larger VC-dimension will result in over-fitting. From random forest’s perspective, the more features we introduce, the more complicated each decision tree is. In this case, we might end up with using too many features to learn training set and these features will form a very specific concept, which has poor generalization. If we do not include enough number of features, the decision tree is very simple. In this case, those features will form a very board concept that will cover many negative instances. Feature filter can solve this problem by iterating all the topNfeatures and find a training model that is neither under-fitting nor over-fitting.
When we get the best testing results (highest f-score in this case), we select this training model as our final hypothesish, as we discussed in Section3.1, and we use
4.5. Feature Importance
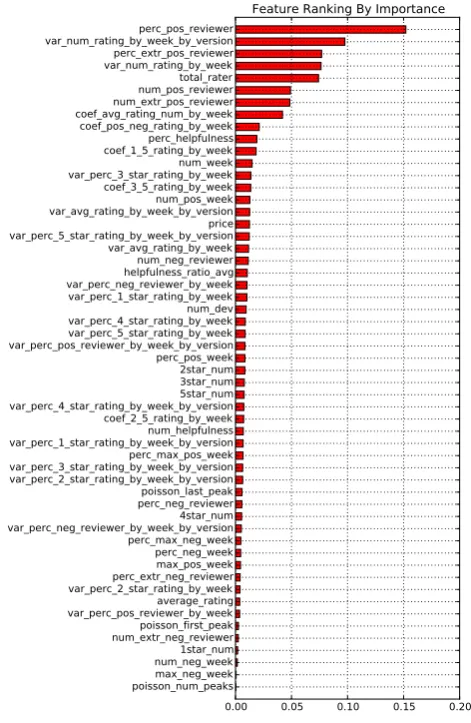
As we mentioned in Section 4.4, random forest could estimates the importance of each feature. Feature importances are generated during the training process. Therefore, it is not a separated procedure from training. But analyzing features can be very helpful when we want to know more about the data and figure out which features contribute more in the training model.
A popular feature importance measuring method was proposed by Leo Breiman[16]. The essence of this method is to rank the error rate of each forest grown with different composition of features by calculating gini index [28].
0.00 0.05 0.10 0.15 0.20 max_neg_week
poisson_num_peaksperc_neg_week 5star_num num_neg_week3star_num var_perc_3_star_rating_by_week_by_versionmax_pos_week var_perc_4_star_rating_by_week_by_versionperc_max_neg_week poisson_last_peak var_perc_neg_reviewer_by_week2star_num 4star_num var_perc_1_star_rating_by_week_by_versionvar_avg_rating_by_week var_avg_rating_by_week_by_versionvar_perc_4_star_rating_by_week var_perc_2_star_rating_by_week_by_versioncoef_1_5_rating_by_week var_perc_5_star_rating_by_week var_perc_2_star_rating_by_week var_perc_pos_reviewer_by_week var_perc_1_star_rating_by_weekcoef_avg_rating_num_by_week perc_max_pos_week var_perc_neg_reviewer_by_week_by_versionprice var_perc_pos_reviewer_by_week_by_versionvar_perc_5_star_rating_by_week_by_version var_perc_3_star_rating_by_weekcoef_pos_neg_rating_by_week 1star_num perc_pos_week num_neg_reviewer coef_2_5_rating_by_weekaverage_rating num_extr_neg_reviewerpoisson_first_peak num_pos_week num_helpfulnessnum_week num_pos_reviewer perc_extr_neg_reviewer coef_3_5_rating_by_weekperc_neg_reviewer total_rater perc_extr_pos_reviewer num_extr_pos_reviewer var_num_rating_by_week var_num_rating_by_week_by_versionhelpfulness_ratio_avg perc_pos_reviewerperc_helpfulness
num_dev Feature Ranking By Importance
Figure 5. US iTunes app store feature ranking by importance
US iTunes App Store Feature Ranking. Figure5shows the feature ranking by importance in US iTunes app store. All the importance values of features are normalized. The higher ranking the feature has, the more error the training model will generate without this feature. By depicting the feature ranking, we are able to see which features play important role during abused
app detection and we can also give some reasonable explanations over the ranks of first 10 features.
1. num_dev: in US iTunes app store, abused apps are usually developed by small companies who developed a few apps. We manually inspect the developer websites of some abused apps in the training set and find that usually those websites are ill-designed and have poor user interface. Those companies are not well-known and are recognized as small companies.
2. perc_helpfulness: users in U.S app store usually like to give feedback on other users’ comments. Helpfulness is a very effective way to reflect the usefulness of comments. To speed up their attacking process, attackers usually leave some simple and uninformative comments, which draw little attention of normal users. Moreover, iTunes ranks the comments not only by comment dates, but also by helpfulness ratio. Therefore, the more informative comments will gain more feedbacks.
3. perc_pos_reviewer: as we suggested in Section 2.2, to manipulate the average rating as effective as possible, malicious users tend to give high ratings(4 or 5) each time. This feature is a strong indication of existence of malicious users and collusion groups.
4. helpfulness_ratio_avg: besidesperc_helpfulness, this feature describes the percentage of agrees. An uninformative comments even though gain some feedback, but they are usually negative feedback. In other words, informative and genuine com-ments will have higher average helpfulness ratio but fake comments left by attackers will have lower value.
5. var_num_rating_by_week_by_version: apps with low value of this feature will be in safe area. High value of this feature could be suspicious as the existence of collusion groups could result in this, even we still need other features to confirm our suspicion because environment factors are strong noises. Advertising or dropping price could also lead to this high variance.
6. var_num_rating_by_week_by_version: similar tovar_num_rating_by_
week_by_version but ignore the app version factor.
8. perc_extr_pos_reviewer: similar to perc_pos_reviewer, but this feature is a stronger indication of existence of malicious users and collusion groups since extreme positve reivewer is a reviewer who has given 4 or 5 stars at least 3 times.
9. total_rater: usually large number of total raters leads to large number of reviewers, which is a necessary condition of abused app.
10. perc_neg_reviewer: lower value of this feature makes apps more suspicious. We found that, in most cases, malicious users and collusion groups promote apps instead of demoting other developers’ apps. Lower value of this feature suggests the larger number of normal users (neither negative users nor positive users) and positive users.
0.00 0.05 0.10 0.15 0.20 poisson_num_peaksmax_neg_week
num_neg_week1star_num num_extr_neg_reviewerpoisson_first_peak var_perc_pos_reviewer_by_weekaverage_rating var_perc_2_star_rating_by_weekperc_extr_neg_reviewer max_pos_week perc_neg_week perc_max_neg_week var_perc_neg_reviewer_by_week_by_version4star_num perc_neg_reviewerpoisson_last_peak var_perc_2_star_rating_by_week_by_version var_perc_3_star_rating_by_week_by_versionperc_max_pos_week var_perc_1_star_rating_by_week_by_versionnum_helpfulness coef_2_5_rating_by_week var_perc_4_star_rating_by_week_by_version5star_num 3star_num 2star_num perc_pos_week var_perc_pos_reviewer_by_week_by_versionvar_perc_5_star_rating_by_week var_perc_4_star_rating_by_weeknum_dev var_perc_1_star_rating_by_week var_perc_neg_reviewer_by_weekhelpfulness_ratio_avg num_neg_reviewer var_avg_rating_by_week var_perc_5_star_rating_by_week_by_versionprice var_avg_rating_by_week_by_versionnum_pos_week coef_3_5_rating_by_week var_perc_3_star_rating_by_weeknum_week coef_1_5_rating_by_weekperc_helpfulness coef_pos_neg_rating_by_week coef_avg_rating_num_by_weeknum_extr_pos_reviewer num_pos_reviewertotal_rater var_num_rating_by_weekperc_extr_pos_reviewer var_num_rating_by_week_by_versionperc_pos_reviewer
Feature Ranking By Importance
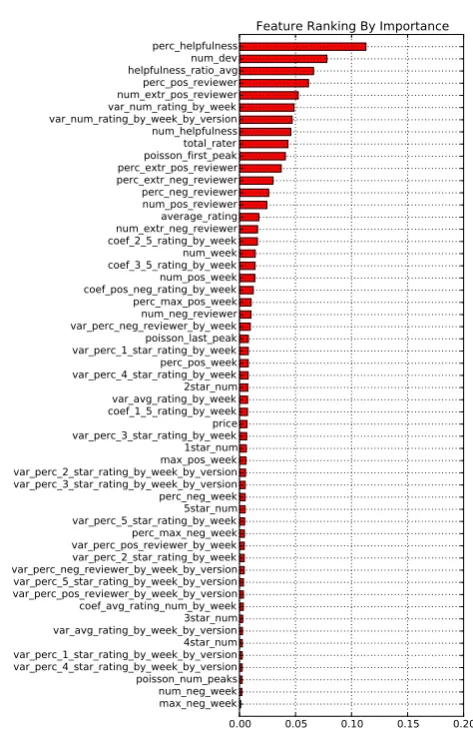
Figure 6. China iTunes app store feature ranking by importance
China iTunes App Store Feature Ranking. Figure6shows normalized feature ranking by importance in China
iTunes app store. We next give explanations for top 10 features.
1. perc_pos_reviewer: as discussed in Section 4.5, high value of this feature strongly indicates the existence of malicious users and collusion groups.
2. var_num_rating_by_week_by_version: apps whose numbers of ratings by week are stable are usually benign ones.
3. perc_extr_pos_reviewer: similar to perc_pos_reviewer.
4. var_num_rating_by_week: Usually both popular apps and abused apps share this feature if this value is relatively large. But apps with low value of this feature are normal ones.
5. total_rater: identical to that in Section4.5.
6. num_pos_reviewer: similar to
perc_pos_reviewer.
7. num_extr_pos_reviewer: similar to num_pos_reviewer.
8. coef_avg_rating_num_by_week: as suggested in [13], the value of this feature should be close to 0. High correlation between average rating and number of reviewers indicates that there are malicious users and collusion groups manipulating average rating.
9. coef_pos_neg_rating_by_week: similar to coef_1_5_rating_by_week.
10. perc_helpfulness: identical to this feature in Section4.5.
UK iTunes App Store Feature Ranking. Figure 7 shows normalized feature ranking by importance in UK iTunes app store. We will give explanations for top 10 features.
1. perc_helpfulness: same as this feature in Section
4.5.
2. num_dev: same as this feature in Section4.5.
3. helpfulness_ratio_avg: similar to perc_helpfulness.
4. perc_pos_reviewer: same as this feature in Section4.5and Section4.5.
5. num_extr_pos_reviewer: identical to this feature in Section4.5.
0.00 0.05 0.10 0.15 0.20 max_neg_week
num_neg_week poisson_num_peaks var_perc_4_star_rating_by_week_by_version var_perc_1_star_rating_by_week_by_version4star_num var_avg_rating_by_week_by_version3star_num coef_avg_rating_num_by_week var_perc_pos_reviewer_by_week_by_versionvar_perc_5_star_rating_by_week_by_version var_perc_neg_reviewer_by_week_by_versionvar_perc_2_star_rating_by_week var_perc_pos_reviewer_by_weekperc_max_neg_week var_perc_5_star_rating_by_week5star_num perc_neg_week var_perc_3_star_rating_by_week_by_version var_perc_2_star_rating_by_week_by_versionmax_pos_week 1star_num var_perc_3_star_rating_by_weekprice coef_1_5_rating_by_weekvar_avg_rating_by_week 2star_num var_perc_4_star_rating_by_weekperc_pos_week var_perc_1_star_rating_by_weekpoisson_last_peak var_perc_neg_reviewer_by_weeknum_neg_reviewer perc_max_pos_week coef_pos_neg_rating_by_weeknum_pos_week coef_3_5_rating_by_weeknum_week coef_2_5_rating_by_weeknum_extr_neg_reviewer average_rating num_pos_reviewer perc_neg_reviewer perc_extr_neg_reviewerperc_extr_pos_reviewer poisson_first_peaktotal_rater num_helpfulness var_num_rating_by_week_by_versionvar_num_rating_by_week num_extr_pos_reviewerperc_pos_reviewer helpfulness_ratio_avgnum_dev
perc_helpfulness Feature Ranking By Importance
Figure 7. UK iTunes app store feature ranking by importance
7. var_num_rating_by_week_by_version: same as this feature in Section4.5.
8. num_helpfulness: the more helpfulness, the more useful comments an app has, because a large number of useful comments indicates a large portion of benign users.
9. total_rater: identical to this feature in Section4.5 and4.5
10. poisson_first_peak: most apps have one peak of number of downloads during the first few weeks. However, if this peak occurs later, this app becomes suspicious.
Feature Analysis. When we put feature ranking from those three countries together, we are able to find both similarities and differences. In this section, we will dive into those feature and analyze those similarities and differences.
Similarities: Even though we create training sets from each dataset separately, we still find that some
features always rank higher than others, which means those features play significant roles in abused app detection. The followings are the common features.
1. High values of num_pos_reviewer,
perc_pos_reviewer, num_extr_pos_ reviewer and perc_extr_pos_reviewer strongly indicate the existence of malicious users and collusion group. And this can been seen from all three datasets. This also confirms our analysis in Section2.2 that to effective manipulate an app’s average rating, malicious users tend to give 5 star, or at least 4 star and their group size should be large enough so that their rating could go against the rest of benign users.
2. As we suggest in theorem 2, only with large number oftotal_rater(ranks 9 in iTunes US app store, 5 in iTunes China app store, 9 in iTunes UK app store), we could possibly label those apps as abused ones. If number oftotal_raterof one app is too small, we lose our confidence in estimating app’s true quality, therefore we shall label this app as normal app.
3. Correlation coefficient related features, such as coef_1_5_rating_by_week, etc.
and variance related features, such as
var_num_rating_by_week, etc. rank in top 15 in each country. Outlier values of these features directly indicate the existence of collusion groups, as by definition, members of collusion group manipulate average rating during a short period of time in order to effectively change average rating and reduce financial cost.
4. Helpfulness related features are important in abused app detection. Normal users will read the comments and possibly leave some feedbacks, while malicious users tend to publish new reviews in order to manipulate the average ratings.
Differences: Differences seem very obvious. Each dataset has its own data and we create different training sets from each of them. Therefore, feature rankings are different. But featurenum_devdraws our attention. As we described in Section3.2,num_devis the number of applications that a developer develops. Big companies such as Google, Gameloft, EA, have published many apps. Therefore they have higher values ofnum_dev.
in the training set as we found several abused apps are developed by biggest technology companies in China.
5. Testing
5.1. Performance Metrics
For every machine learning problem, the ultimate goals are:
1. High precision and recall for training set.
2. Accurate prediction in out-of-sample data.
Usually item 1 is reasonable to reach if the training model is good enough. But item 2 is relatively difficult due to the lack of out-of-sample data. Sometimes, even if we do have out-of-sample data, evaluation is still impossible as, for supervised learning, those data are not labeled. In this specific training problem, our goals are:
1. while pushing precision and recall, precision is supposed to be better than recall. Precision is defined as
precision= P
true_positive
P
test_outcome_positive. (5)
In this problem, precision indicates the confi-dence on classified abused apps. Recall is defined as
recall= P
true_positive
P
total_positive. (6)
In this problem, recall indicates coverage of our results. Usually, higher precision will lead to lower recall, and vice versa [29]. For abused app detection, we emphasize on higher precision since we want to make sure we minimize the probability of labeling benign apps as abused apps and we may tolerate missing several abused apps.
2. narrowing down the scope of abused app detection instead of declaring abused apps. For app market providers, labeling an abused app is very serious and sensitive and it always involves business level decisions. We hope that our machine learning results could help app market providers narrow down the scope of investigation – only have to inspect abused apps we classify.
5.2. Results
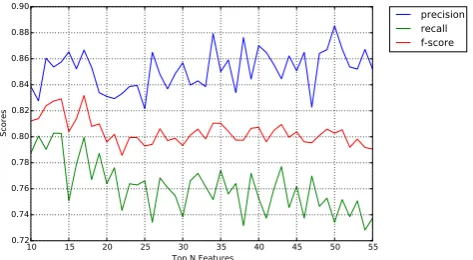
Figure 8 depicts that the precision, recall and f-score vary from top 10 features to top 55 features (all features) in iTunes US app store. We have the following observations:
10 15 20 25 30 35 40 45 50 55
Top N Features 0.60
0.65 0.70 0.75 0.80 0.85 0.90 0.95 1.00
Scores
precision recall f-score
Figure 8. iTunes US App Store: Evaluation for TopnFeatures
10 15 20 25 30 35 40 45 50 55
Top N Features 0.78
0.80 0.82 0.84 0.86 0.88 0.90
Scores
precision recall f-score
Figure 9. iTunes China App Store: Evaluation for TopnFeatures
10 15 20 25 30 35 40 45 50 55
Top N Features 0.72
0.74 0.76 0.78 0.80 0.82 0.84 0.86 0.88 0.90
Scores
precision recall f-score
Figure 10. iTunes UK App Store: Evaluation for TopnFeatures
1. Generally, as we increase the number of top features, precision increases slowly while recall and f-score decrease relatively fast.
2. Precision is always better than recall, which meets our requirement.
3. Whenn= 18, both f-score and recall reach their peaks.
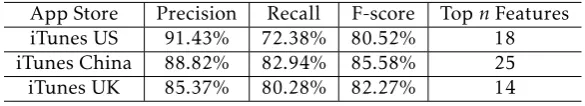
Even though the plot is very spiky for iTunes China app store, we still have the same observations for both UK and China app stores as for US app store. For Figure 10, even though f-score(n= 10) is slightly better than f-score(n= 15), we are still willing to choose the latter one as we refer high precision to high recall. Therefore, from both figures, we choose top 25 features for iTunes China app store and top 14 features for iTunes UK app store.
Table3summarizes our results.
After we get our final training models h for each app store, we can use these training model to classify apps inresidual data. We call the newly found ‘abused app’ assuspicious appas we have no evidence to prove those apps are abused ones. Table 4 summarizes our results. From the table we can see that our coverage in iTunes UK is relatively larger than other app stores with 9.51% apps labelled as abused app (suspicious) while the other two stores have around 5% suspicious apps. These observations are however specific to the datasets we use.
Classification Result Validation. The question may be asked after we label some abused(suspicious) apps in residual data is that how to validate those apps or how suspicious those apps could be. Though direct validation is difficult as we have no evidence to show if those apps are abused or not, here, we present two additional features to evaluate our results.
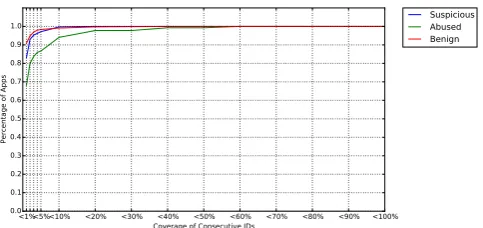
Consecutive Reviewer IDs: In Section2.3, we point out that some abused apps may contain consecutive IDs. Here we defineconsecutive user IDsas if two IDs rate one app in the same day and the difference between IDs is less than 1000.
<1%<5%<10% <20% <30% <40% <50% <60% <70% <80% <90% <100% Coverage of Consecutive IDs
0.0 0.1 0.2 0.3 0.4 0.5 0.6 0.7 0.8 0.9 1.0
Percentage of Apps
Suspicious Abused Benign
Figure 11. Consecutive User IDs in iTunes US App Store
Figure11,12and13depict the situations of existence of consecutive IDs in iTunes US, iTunes China and iTunes UK app stores, respectively. In each figure, x-axis represents the coverage of consecutive IDs, which is defined as percentage of consecutive user IDs over number of users who leave comments for this app. For instance, ‘<10%’ means that coverage of consecutive IDs is less than 10%. Y-axis represents the percentage
<1%<5%<10% <20% <30% <40% <50% <60% <70% <80% <90% <100% Coverage of Consecutive IDs
0.0 0.1 0.2 0.3 0.4 0.5 0.6 0.7 0.8 0.9 1.0
Percentage of Apps
Suspicious Abused Benign
Figure 12. Consecutive User IDs in iTunes China App Store
<1%<5%<10% <20% <30% <40% <50% <60% <70% <80% <90% <100% Coverage of Consecutive IDs
0.0 0.1 0.2 0.3 0.4 0.5 0.6 0.7 0.8 0.9 1.0
Percentage of Apps
Suspicious Abused Benign
Figure 13. Consecutive User IDs in iTunes UK App Store
of those apps over the number of apps inresidual data. In the legend, ‘suspicious’ refers to the abused apps we classified by our training model; ‘abused’ refers to the abused app in our training set; ’benign’ means the normal apps in our training data.
We can easily see that some apps contain more consecutive user IDs than normal apps do. This is because when we are picking abused apps for our training set, the algorithm we use will explicitly find collusion groups that have attacked more than one apps. It is conceivable that attackers will use same fake user IDs to launch another attack, which is much easier and more feasible than finding the same group of real users to attack another app. A group of fake users often have consecutive IDs, so those abused apps attacked by fake users can be more easily detected by our algorithm and put them into our training set and those abused apps attacked by real users remain undetected and discovered by our training models later.
Put these three figures together, we discover that, in iTunes US and UK, most abused apps are attacked by indirect formationgroups, while in iTunes China, we are safe to draw conclusion that more than 50% of abused apps are attacked by direct formationgroups (defined in Section2.3).
Table 3. Training Model Evaluation Table
App Store Precision Recall F-score TopnFeatures
iTunes US 91.43% 72.38% 80.52% 18
iTunes China 88.82% 82.94% 85.58% 25
iTunes UK 85.37% 80.28% 82.27% 14
Table 4. Classified Suspicious Apps In Each App Store
App Store # Suspicious Apps # Residual Apps Coverage(%)
iTunes US 1103 22703 4.86%
iTunes China 1123 21056 5.33%
iTunes UK 930 9777 9.51%
reviews vs. week, where blue area is defined as review area and total area is represented by the square.
1 11 21 31 41 51 61 71 81 91 101 111 121 131 Week
10 20 30 40 50
Number of Reviews
Figure 14. Review Density Example
Usually, abused apps should have low review density. However, we notice that most apps, no matter they are benign or abused, will gain lots of reviews in the first several weeks. That is because usually app stores will put new apps in a specific section in the front page so that users may be able to notice them. To mitigate this issue, we remove the first 5 weeks data for each app.
US Suspicious US Abused US Benign China SuspiciousChina Abused China Benign UK Suspicious UK Abused UK Benign 0.0
0.2 0.4 0.6 0.8 1.0
Density
Figure 15. Review Density for iTunes US, China, UK App Store
Figure 15 depicts box plots of review density for iTunes US, China and UK app stores. We can see that,
compared with benign apps, abused apps usually have lower review density. The suspicious apps that we classified have similar review density distribution to that of abused apps. Review densities of benign apps in China and UK are higher than those in US, which means US benign apps’ review distributions are less spiky, in general.
There are some outliers in both suspicious and abused apps, whose review densities are relatively large. Nevertheless, it is superficial to say these outliers are false positive. As we cut out the first 5-week data for each app, there might be attacking behavior hidden in the first 5 weeks, which will greatly reduce the review density if we put those data back. Another possible case is, if abused apps are successfully promoted, users will easily find these apps in app store, which leads to many reviews.
We also randomly picked some suspicious apps we found and manually investigated their rating distributions. Even theoretically, it is very difficult for human being to process those large amount of data and find useful information from it, we did notice some skeptical data and figure16depicts one of them.
1 2 3 4 5 6 7 8 9 10 11 12 13 14 15 16 Week
0 20 40 60 80 100 120 140
Number of ratings
1 star 2 star 3 star 4 star 5 star