Corresponding Author E-mail: [email protected]
1478 | Page
Available online athttp://www.ijabbr.com
International journal of Advanced Biological and Biomedical Research
Volume 1, Issue 11, 2013: 1478-1489
Modeling and optimization of energy inputs and greenhouse gas emissions for
eggplant production using artificial neural network and multi-objective genetic
algorithm
Ashkan Nabavi-Pelesaraei1*, Sajjad Shaker-Koohi2, Mohammad Bagher Dehpour3
1
Department of Agricultural Machinery Engineering, Faculty of Agriculture, University of Tabriz, Iran.
2
Department of Agronomy and Plant Breeding, Faculty of Agriculture, University of Tabriz, Iran.
3
Department of Agricultural Mechanization Engineering, Faculty of Agriculture, University of Guilan, Iran.
ABSTRACT
This paper studies the modeling and optimization of energy use and greenhouse gas emissions of eggplant production using artificial neural network and multi-objective genetic algorithm in Guilan province of Iran. Results showed that the highest share of energy consumption belongs to diesel fuel (49.24%); followed by nitrogen (33.30%). The results indicated that a total energy input of 13910.67 MJ ha-1 was consumed for eggplant production. In ANN, the Levenberg-Marquardt Algorithm was examined to finding best topology for modeling and optimization of energy inputs an GHG emissions for eggplant production. The results of ANN indicated the best topology with 12-9-9-2 structure had the highest R2, lowest RMSE and MAPE. Also, the multi-objective optimization was done by MOGA. In this research, 42 optimal was introduced by MOGA based minimum total GHG emissions and maximum yield of eggplant production, in the studied area. Also, the results revealed that the best generation with lowest energy use was consumed about 4597 MJ per hectare. The GHG emissions of best generation was calculated as about 127 kg CO2eq. ha-1. The potential of GHG reduction by MOGA was computed as 388.48 kg CO2eq. ha-1. Also, the highest reduction of GHG emissions belongs to diesel fuel with 65.05%.
Key words: Eggplant; Energy consumption; Greenhouse gas emissions; Modeling; Optimization.
1- INTRODUCTION
1479 | Page global net CO2 emissions coming from agriculture (IPCC, 2007). Practices on GHG emissions or to assess climate change mitigation measures (Dyer et al., 2010). Models are the only practical way to quantify the net effect of farm. Artificial neural networks (ANN) have been widely used in different fields of agriculture like economic, energy and environmental modeling as well as to extend the field of statistical methods, in the last few decades (Khoshnevisan et al., 2013a). The main reason that ANN applications have received considerable attention is that the methodology is comparable to statistical modeling and ANNs could be faced as complementary effort (without the restrictive assumption of a particular statistical model) or an alternative approach to fitting non-linear data. Recently, the number of scientists and engineers who are interested in modeling of energy consumption and related environmental impacts has been increased (Khoshnevisan et al., 2013b). Application of ANNs to estimate yield and GHG emissions of wheat production in Isfahan, Iran was reported by Khoshnevisan et al. (2013b). They used an ANN model with twelve input variables, one hidden layer with eight neurons and two outputs. Effective energy use in agriculture is one of the conditions for sustainable agricultural production, since it provides financial savings, fossil resources preservation and air pollution reduction (Nabavi-Pelesaraei et al., 2013a). multi-objective genetic algorithm (MOGA) is one main method for optimization in recent years. The genetic algorithm is an example of a search procedure that uses random selection for optimization of a function by means of the parameters space coding. The genetic algorithms were developed by Holland (1975) and the most popular references are perhaps Goldberg (1997) and a more recent one by Bäck (1996). Few research was done by genetic algorithm for optimization energy in agriculture, Hematian et al. (2013) investigated on optimization of energy consumption for sugar beet production. Their results indicated that the optimized total energy used for producing the sugar beet crops was 32716.06 MJ ha-1. The main aim of this study was modeling of energy use and GHG emissions of eggplant production in Guialn province of Iran using ANN. Furthermore, the energy consumption and GHG emissions was optimized together by MOGA.
2- MATERIALS AND METHODS
2-1- Sampling design
This study was carried out in the eggplant farms located in Guilan province, Iran. Guilan province had the five place in producing eggplant in Iran (Ministry of Jihad-e-Agriculture of Iran, 2012). Guilan is located within 36◦ 34׳ and 38◦ 27׳ north latitude and 48◦ 53׳ and 50◦ 34׳ east longitude. Data were collected by using a face-to-face questionnaire performed in the production year 2012/2013. Average farm size was 0.5 ha in the area studied while the size of farms varied between 0.1 ha and 4 ha. From the villages in the area studied, farms were selected by using stratified sample randomly. The sample size was calculated using Cochran method (Mobtaker et al., 2010). It’s should be noted, the sample size was computed as 60. For determination of input and output energy, the energy standard coefficients were utilized. These coefficient are illustrated in Table 1. Also, energy equivalent for machinery is calculated by Eq.(1) (Hatirli et al., 2005):
a TC ELG
1480 | Page where ‘ME’ is the machine energy (MJ ha-1), ‘E’ the production energy of machine (MJ kg-1 yr-1) that is shown in Table 1, ‘L’ the useful life of machine (year), ‘G’ the weight of machine (kg), ‘T’ the economic life of machinery (h) and ‘Cɑ’ the effective field capacity (ha h-1). The CO2 emission coefficients that are shown in Table 2 were used to calculate the amounts of the GHG emissions from inputs in eggplant production per hectare. The application rate of machinery, diesel fuel, chemical fertilizers and biocides per hectare were multiplied by their corresponding emission coefficients which were taken from Table 2. The GHG coefficient of machinery input consists of manufacturing and applying the machinery on the farm (Pishgar-Komleh et al., 2013).
2-2-ANN design
ANN are data-processing systems inspired by biological neural system and are used to solve a wide variety of problems in science and engineering, particularly for some areas where the conventional modelling methods fail. A well-trained ANN can be used as a predictive model for a specific application. The predictive ability of an ANN results from the training on experimental data and then validation by independent data. An ANN has the ability to relearn to improve its performance if new data are available (Najafi et al., 2009). In this study, the modeling of energy consumption and GHG emissions was obtained from ANN. A typical ANN model consists of an input layer, one or more hidden layers and an output layer (Khoshnevisan et al., 2013c). Accordingly, the model was created based eight inputs including human labor, machinery, diesel fuel, nitrogen, phosphate, potassium, biocides and seed and two outputs covering output energy and total GHG emissions. The Levenberg-Marquardt learning Algorithm was applied to training ANN. All links between input layers and hidden layers composed the input weight matrix and all links between hidden layers and output layers composed the output weight matrix. Weight (w) which controls the propagation value (x) and the output value (O) from each node is modified using the value from the preceding layer according to Eq. (2) (Zhao et al., 2009):
f T wixi
O (2)
where ‘T’ is a specific threshold (bias) value for each node. ‘f ’ is a non-linear sigmoid function, which increased monotonically. The performance of the trained networks was measured by root mean square error (RMSE), mean absolute percentage error (MAPE) and coefficient of determination (R2) on another set of data (testing set), not seen by the network during training and cross-validation (CV), between the predicted values of the network and the target (or experimental) values.
The RMSE, MAPE and R2 can be written as (Zangeneh et al., 2011):
n 1
RMSE
2n
i
i i z
t (3)
n
t i
i i
t z t n MAPE
1 1
1481 | Page
n
i i n
i
i i
t z t R
1 2 1
2 2
) (
1 (5)
where ‘n’ is the number of the points in the data set, and ‘t’ and ‘z’ are actual output and predicted output sets, respectively.
2-3- Multi-objective genetic algorithm (MOGA)
Being a population-based approach, genetic algorithm are well suited to solve multi-objective optimization problems. A generic single-objective genetic algorithm can be modified to find a set of multiple non-dominated solutions in a single run. The ability of genetic algorithm to simultaneously search different regions of a solution space makes it possible to find a diverse set of solutions for difficult problems with non-convex, discontinuous, and multi-modal solutions spaces (Konak et al., 2006). The first step of optimization by MOGA was calculation of production functions. Based energy inputs and outputs (eggplant yield and total GHG emissions), the production functions was determined according to Eq. (6) and (7):
i
i a X X X X X X X X e
Y 0
1 1
2 2
3 3
4 4
5 5
6 6
7 7
8 8 (6)i
i X X X X X X X X e
G 0 1 1 2 2 3 34 4 5 56 6 7 7 8 8 (7)
Where Xi stands for corresponding energies as ‘X1’, human labor; ‘X2’,machinery; ‘X3’, diesel fuel; ‘X4’, nitrogen; ‘X5’, phosphate; ‘X6’, potassium; ‘X7’, biocides; ‘X8’, seed, ‘Yi’ eggplant yield, and ‘Gi’ total GHG emissions.
Then, the limits of functions was calculated based minimum and maximum of energy consumption for each input.
Basic information on energy inputs and GHG emissions of eggplant production was entered into Excel 2010 spreadsheets, SPSS 20 and Matlab 7.2 (R2012a) software package.
3- RESULTS AND DISCUSSION
3-1- Analysis of input–output energy use in eggplant production
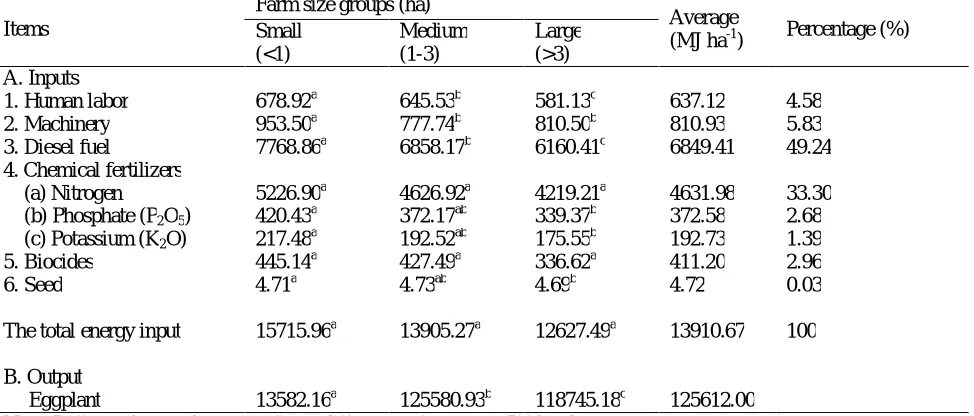
1482 | Page less share of total energy input, respectively. In some related studies total energy input has been reported as 18.93 GJ ha-1 for sunflower (Uzunoz et al., 2008), 25.03 GJ ha-1 for barley (Mobtaker et al., 2010), 18.02 GJ ha-1 for soybean in Golestan province of Iran (Ramedani et al., 2011), 19.25 GJ ha-1 for peanut production in Guilan province, Iran (Nabavi-Pelesaraei et al., 2013b).
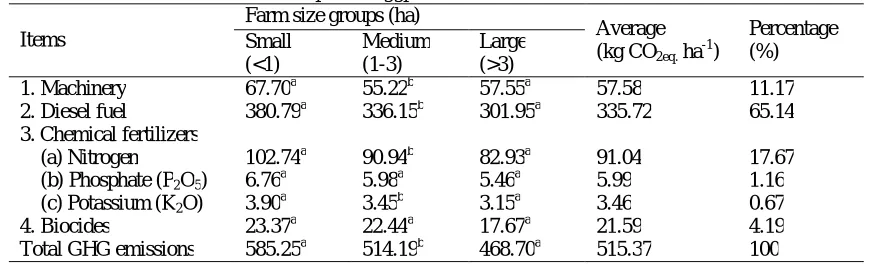
3-2- GHG emissions of eggplant production
The GHG emissions of different inputs was calculated by using the GHG conversion factors presented in Table 2. The results revealed that total emissions of eggplant production was 515.37 kg CO2eq. ha-1 (Table 4) from which machinery, diesel fuel, chemical fertilizers and biocides inputs, respectively. The highest share of emissions was belonged to diesel fuel with 65.14%; followed by nitrogen (with 17.67%) and machinery (with 11.17%). The ANOVA results showed The non-significant difference was found to be between three groups of farms. Also, the small and large farms had the highest and lowest rate of GHG emissions among all farms, respectively. Because, the emissions pattern of small farms (specially in diesel fuel and nitrogen consumption) should be closed to large farms. In a similar study, the diesel fuel and nitrogen had the highest share for GHG emissions in wheat production of Isfahan, Iran (Ghahderijani et al., 2013).
3-3-Evaluation and analysis of model
The Levenberg-Marquardt algorithm was applied for modeling of eggplant yield and GHG emissions based energy inputs. The ANN model with twelve neuron in input layers, two hidden layer with 9 neuron for each layer and two outputs (best structure: 12-9-9-2) was determined as best structure, in this study. The results of best topology are given in Table 5. The results disclosed the determination of coefficient for yield and GHG emissions of eggplant production was calculated as 0.963 and 0.988, respectively. Also, the rate of RMSE was found to be 0.056 and 0.023 for eggplant yield and GHG emissions, respectively.
Rahman and Bala (2010) reported that a model consisted of an input layer with six neurons, two hidden layers with 9 and 5 neurons and one neuron in the output layer was the best topology for predicting jute production in Bangladesh. Safa and Samarasinghe (2011) developed an ANN model based on a modular neural network with two hidden layers that could predict energy consumption based on farm conditions (size of crop area), social factors (farmers’ education level), and energy inputs (N and P use, and irrigation frequency). Their result showed that ANN model is more viable to predict energy consumption in wheat production rather than regression models. In another study, Khoshnevisan et al. (2013b) reported that a model consisted of an input layer with twelve neurons, one hidden layer with 8 neurons and the output layer with two variables was the best topology for predicting basil production in Esfahan province of Iran.
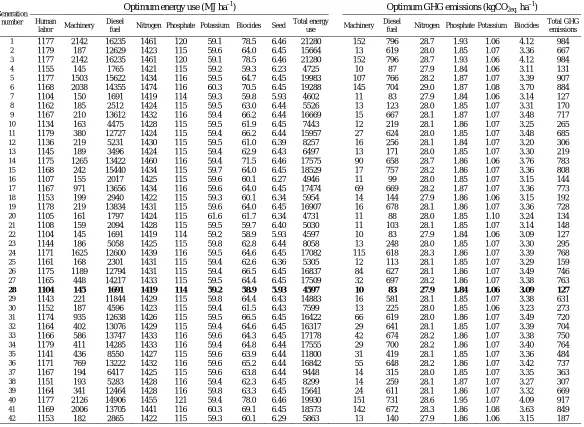
3-4-Optimization of energy inputs and GHG emissions
The model of yield and GHG emissions was optimized by MOGA based energy inputs. The limitation of energy inputs are demonstrated in Table 6. The minimum consumption was considered as lower limit; While the maximum quantity of energy for each input was determined as higher limit.
1483 | Page
i
i X X X X X X X X e
Y 4.730.44 10.26 20.32 3 0.40 40.40 50.42 6 0.02 7 1.26 8 (8)
i
i X X X X X X X X e
G 1.110.02 10.60 20.59 30.96 4 0.96 5 0.31 6 0.05 7 0.01 8 (9)
In this study, the MOGA was computed 42 optimal generation based maximum eggplant yield and minimum total GHG emissions (Table 7). Moreover, the best generation was determined based minimum energy consumption in this study. Accordingly, No. 28 was selected as efficient generation for the studied area. In another words, this generation had the maximum yield, minimum GHG emissions and minimum energy consumption for eggplant production in Guilan province of Iran. The total energy consumption and GHG emissions of best generation was found to be about 4597 MJ ha-1 and 127 kgCO2eq. ha-1, respectively.
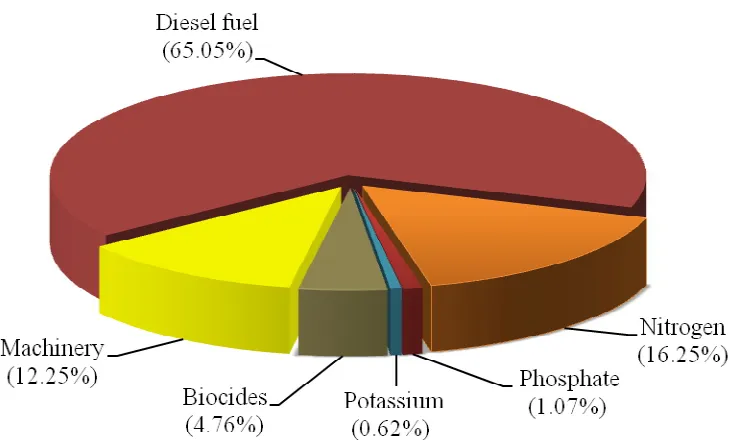
In the last part of this study, the potential of GHG reduction by MOGA was calculated. Fig 1 displays the share of each input for total GHG reduction. Based the results, diesel fuel (with 65.05%) had the highest percentages in GHG reduction; followed by nitrogen (with 16.25%) and machinery (with 12.25%). With respect to results, it’s suggested, in the first step, the diesel fuel consumption and machinery should be reduced by timely maintenance and selection of appropriate machinery. Also, the applying minimum tillage, no tillage system and bio-fertilizers instead conventional tillage and chemical fertilizers can be reduced energy consumption and GHG emissions in the studied area, significantly.
4- CONCLUSION
1484 | Page
Table 1.
Energy equivalent of inputs and output in agricultural production.
Reference Energy equivalent
(MJ unit-1) Unit
Items (unit)
A. Inputs
(Mohammadshirazi et al., 2012) 1.96
h 1. Human labor
kg yra 2. Machinery
(Hatirli et al., 2005) 9-10
(a) Tractor and self-propelled
(Hatirli et al., 2005) 6-8
(b) Implement and machinery
(Mobtaker et al., 2010) 56.31
L 3. Diesel fuel
kg 4. Chemical fertilizers
(Mousavi-Avval, 2011) 66.14
(a) Nitrogen
(Rafiee et al., 2010) 12.44
(b) Phosphate(P2O5)
(Unakitan et al., 2010) 11.15
(c) Potassium (K2O)
(Nabavi-Pelesaraei et al., 2013b) 120 kg 5. Biocides (Kitani, 1999) 5.9 kg 6. Seed B. Output (Kitani, 1999) 5.9 kg Eggplant a
The economic life of machine (year).
Table 2.
GHG emissions coefficients of agricultural inputs.
Input Unit GHG Coefficient
(kg CO2eq unit-1) Reference
1. Machinery MJ 0.071 (Dyer and Desjardins, 2006)
2. Diesel fuel L 2.76 (Dyer and Desjardins, 2003)
3. Chemical fertilizers kg
(a) Nitrogen 1.3 (Nabavi-Pelesaraei et al., 2013a)
(b) Phosphate (P2O5) 0.2 (Nabavi-Pelesaraei et al., 2013a)
(c) Potassium (K2O) 0.2 (Pishgar-Komleh et al., 2013)
4. Biocides kg 6.3 (Lal, 2004)
Table 3.
Amounts of energy inputs and output in eggplant production based on different farm size levels.
Percentage (%) Average
(MJ ha -1) Farm size groups (ha)
Items Large
(>3) Medium (1-3) Small (<1) A. Inputs 4.58 637.12 581.13c 645.53b 678.92a 1. Human labor
5.83 810.93 810.50b 777.74b 953.50a 2. Machinery 49.24 6849.41 6160.41c 6858.17b 7768.86a 3. Diesel fuel
4. Chemical fertilizers
33.30 4631.98 4219.21a 4626.92a 5226.90a (a) Nitrogen 2.68 372.58 339.37b 372.17ab 420.43a (b) Phosphate (P2O5)
1.39 192.73
175.55b 192.52ab
217.48a (c) Potassium (K2O)
2.96 411.20 336.62a 427.49a 445.14a 5. Biocides 0.03 4.72 4.69b 4.73ab 4.71a 6. Seed 100 13910.67 12627.49a 13905.27a 15715.96a The total energy input
B. Output 125612.00 118745.18c 125580.93b 13582.16a Eggplant
1485 | Page
Table 6.
Limits of functions for multi-objective genetic algorithm (MJ ha-1)
338.17 ≤ X1 ≤ 1186.48 113.99 ≤ X5 ≤ 861.06
144.84 ≤ X2 ≤ 2172.54 58.97 ≤ X6 ≤ 445.42
1674.02 ≤ X3 ≤ 16740.23 58.03 ≤ X7 ≤ 1059.68
1417.18 ≤ X4 ≤ 10174.99 2.58 ≤ X8 ≤ 6.46
Table 4.
GHG emissions of inputs in eggplant based on different farm size levels.
Percentage (%) Average
(kg CO2eq. ha-1) Farm size groups (ha)
Items Large
(>3) Medium
(1-3) Small
(<1)
11.17 57.58
57.55a 55.22b
67.70a 1. Machinery
65.14 335.72
301.95a 336.15b
380.79a 2. Diesel fuel
3. Chemical fertilizers
17.67 91.04
82.93a 90.94b
102.74a (a) Nitrogen
1.16 5.99
5.46a 5.98a
6.76a (b) Phosphate (P2O5)
0.67 3.46
3.15a 3.45b
3.90a (c) Potassium (K2O)
4.19 21.59
17.67a 22.44a
23.37a 4. Biocides
100 515.37
468.70a 514.19b
585.25a Total GHG emissions
Note: Different letters show significant difference of means at 5% level.
Table 5.
The best result of different arrangement of models.
Item Eggplant yield GHG emissions
R2 0.963 0.988
RMSE 0.056 0.023
1486 | Page
Table 7.
Multi-objective genetic algorithm results for optimization of energy inputs and GHG emissions in eggplant production.
Generation number
Optimum energy use (MJ ha–1) Optimum GHG emissions (kgCO2eq. ha–1)
Human
labor Machinery Diesel
fuel Nitrogen Phosphate Potassium Biocides Seed
Total energy
use Machinery Diesel
fuel Nitrogen Phosphate Potassium Biocides
Total GHG emissions 1 1177 2142 16235 1461 120 59.1 78.5 6.46 21280 152 796 28.7 1.93 1.06 4.12 984 2 1179 187 12629 1423 115 59.6 64.0 6.45 15664 13 619 28.0 1.85 1.07 3.36 667 3 1177 2142 16235 1461 120 59.1 78.5 6.46 21280 152 796 28.7 1.93 1.06 4.12 984 4 1155 145 1765 1421 115 59.2 59.3 6.23 4725 10 87 27.9 1.84 1.06 3.11 131 5 1177 1503 15622 1434 116 59.5 64.7 6.45 19983 107 766 28.2 1.87 1.07 3.39 907 6 1168 2038 14355 1474 116 60.3 70.5 6.45 19288 145 704 29.0 1.87 1.08 3.70 884 7 1104 150 1691 1419 114 59.3 59.8 5.93 4602 11 83 27.9 1.84 1.06 3.14 127 8 1162 185 2512 1424 115 59.5 63.0 6.44 5526 13 123 28.0 1.85 1.07 3.31 170 9 1167 210 13612 1432 116 59.4 66.2 6.44 16669 15 667 28.1 1.87 1.07 3.48 717 10 1134 163 4475 1428 115 59.5 61.9 6.45 7443 12 219 28.1 1.86 1.07 3.25 265 11 1179 380 12727 1424 115 59.4 66.2 6.44 15957 27 624 28.0 1.85 1.07 3.48 685 12 1136 219 5231 1430 115 59.5 61.0 6.39 8257 16 256 28.1 1.84 1.07 3.20 306 13 1145 189 3496 1424 115 59.4 62.9 6.43 6497 13 171 28.0 1.85 1.07 3.30 219 14 1175 1265 13422 1460 116 59.4 71.5 6.46 17575 90 658 28.7 1.86 1.06 3.76 783 15 1168 242 15440 1434 115 59.7 64.0 6.45 18529 17 757 28.2 1.86 1.07 3.36 808 16 1107 155 2017 1425 115 59.6 60.1 6.27 4946 11 99 28.0 1.85 1.07 3.15 144 17 1167 971 13656 1434 116 59.6 64.0 6.45 17474 69 669 28.2 1.87 1.07 3.36 773 18 1153 199 2940 1422 115 59.3 60.1 6.34 5954 14 144 27.9 1.86 1.06 3.15 192 19 1178 219 13834 1431 115 59.6 64.0 6.45 16907 16 678 28.1 1.86 1.07 3.36 728 20 1105 161 1797 1424 115 61.6 61.7 6.34 4731 11 88 28.0 1.85 1.10 3.24 134 21 1108 159 2094 1428 115 59.5 59.7 6.40 5030 11 103 28.1 1.85 1.07 3.14 148 22 1104 145 1691 1419 114 59.2 58.9 5.93 4597 10 83 27.9 1.84 1.06 3.09 127 23 1144 186 5058 1425 115 59.8 62.8 6.44 8058 13 248 28.0 1.85 1.07 3.30 295 24 1171 1625 12600 1439 116 59.5 64.6 6.45 17082 115 618 28.3 1.86 1.07 3.39 768 25 1161 168 2301 1431 115 59.4 62.6 6.36 5305 12 113 28.1 1.85 1.07 3.29 159 26 1175 1189 12794 1431 115 59.4 66.5 6.45 16837 84 627 28.1 1.86 1.07 3.49 746 27 1165 448 14217 1433 115 59.5 64.4 6.45 17509 32 697 28.2 1.86 1.07 3.38 763
1487 | Page
Fig. 1. Distribution of GHG emissions reduction for each input in eggplant production.
ACKNOWLEDGMENT
The financial support provided by the University of Tabriz, Iran, is duly acknowledged. Also, I want to express my deep appreciation of all Ms. Fatemeh Mostashari-Rad’s making effort to help me revise the study.
REFERENCES
Kantharajah, AS., & Golegaonkar, PG. (2004). Somatic embryogenesis in eggplant Review. Scientia Horticulturae. 99: 107-117.
Hemmati, A., Tabatabaeefar, A., & Rajabipour, A. (2013). Comparison of energy flow and economic performance between flat land and sloping land olive orchards. Energy. 61:472-478.
IPCC. (2007). IPCC Assessment Report 4. <www.ipcc.ch>.
1488 | Page Khoshnevisan, B., Rafiee, S., Omid, M., & Mousazadeh, H. (2013a). Developing an artificial neural networks model for predicting output energy and GHG emission of strawberry production. International Journal of Applied Operational Research. 3(4): 43-54.
Khoshnevisan, B., Rafiee, S., Omid, M., Mousazadeh, H., & Rajaeifar, M.A. (2013b). Application of artificial neural networks for prediction of output energy and GHG emissions in potato production in Iran. Agricultural Systems. 123: 120-127.
Nabavi-Pelesaraei, A., Abdi, R., Rafiee, S., & Mobtaker, HG. (2013a). Optimization of energy required and greenhouse gas emissions analysis for orange producers using data envelopment analysis approach. Journal of Cleaner Production. http://dx.doi.org/10.1016/j.jclepro.2013.08.019.
Holland, J.H. (1975). Adaptive in Natural and Artificial Systems. Ann Arbor, MI: University of Michigan Press.
Goldberg, D.E. (1997). Genetic Algorithms, in Search, Optimization & Machine Learning. Addison Wesley.
Bäck, T. (1996). Evolutionary Algorithms in Theory and Practice: Evolution Strategies, Evolutionary Programming, Genetic Algorithms. Oxford University Press.
Hematian, A., Bakhtiari, A.A., Yaghubi, O., & Zarei-Shahamat, E. (2013). Optimization of Energy Consumption in Sugar-Beet Production Using Genetic Algorithm “A Case study in Kermanshah Province, Iran”. International journal of Agronomy and Plant Production. 4(6): 1351-1356.
Ministry of Jihad-e-Agriculture of Iran. 2012. Annual Agricultural Statistics. www.maj.ir (in Persian). Mobtaker, HG., Keyhani, A., Mohammadi, A., Rafiee, S., & Akram, A. (2010). Sensitivity analysis of energy inputs for barley production. Agriculture, Ecosystems and Environment. 137: 367-372.
Hatirli, SA., Ozkan, B., & Fert, C. (2005). An econometric analysis of energy input-output in Turkish agriculture. Renewable and Sustainable Energy Reviews. 9: 608-623.
Mohammadshirazi, A., Akram, A., Rafiee, S., Mousavi-Avval, SH., & Bagheri Kalhor, E. An analysis of energy use and relation between energy inputs and yield in tangerine production. Renewable and Sustainable Energy Reviews. 16: 4515-4521.
Mousavi-Avval, SH., Rafiee, S., Jafari, A., & Mohammadi, A. (2011). Optimization of energy consumption for soybean production using Data Envelopment Analysis (DEA) approach. Applied Energy. 88: 3765-3772.
Rafiee, S., Mousavi-Avval, SH., & Mohammadi, A. (2010). Modeling and sensitivity analysis of energy inputs for apple production in Iran. Energy. 35: 3301-3306.
Unakitan, G., Hurma, H., & Yilmaz, F. (2010). An analysis of energy use efficiency of canola production in Turkey. Energy. 35: 3623-3627.
1489 | Page Kitani, O. (1999). Energy and biomass engineering. In: CIGR handbook of agricultural engineering. St. Joseph, MI: ASAE.
Dyer, JA., & Desjardins, RL. (2006). Carbon dioxide emissions associated with the manufacturing of tractors and farm machinery in Canada. Biosystems Engineering. 93(1): 107-118.
Dyer, JA., & Desjardins, RL. (2003). Simulated farm fieldwork, energy consumption and related greenhouse gas emissions in Canada. Biosystems Engineering. 85(4): 503-513.
Pishgar-Komleh, SH., Omid, M., & Heidari, MD. (2013). On the study of energy use and GHG (greenhouse gas) emissions in greenhouse cucumber production in Yazd province. Energy. 59: 63-71. Lal, R. (2004). Carbon emission from farm operations. Environment International. 30(7): 981-990.
Najafi, G., Ghobadian, B., Tavakoli, T., Buttsworth, D.R., Yusaf, TF., & Faizollahnejad, M. (2009). Performance and exhaust emissions of a gasoline engine with ethanol blended gasoline fuels using artificial neural network. Applied Energy. 86: 630-639.
Khoshnevisan, B., Rafiee, S., Omid, M., & Mousazadeh, H. (2013c). Prediction of potato yield based on energy inputs using multi-layer adaptive neuro-fuzzy inference system. Measurement. 47: 521-530. Zhao, Z., Chow, TL., Rees, HW., Yang, Q., Xing, Z., & Meng, FR. (2009). Predict soil texture distributions using an artificial neural network model. Computers and Electronics in Agriculture 65(1): 36-48.
Zangeneh, M., Omid, M., & Akram, A. (2011). A comparative study between parametric and artificial neural networks approaches for economical assessment of potato production in Iran. Spanish Journal of Agricultural Research. 9(3): 661-671.
Konak, A., Coit, D.W., & Smith, A.E. (2006). Multi-objective optimization using genetic algorithms: A tutorial. Reliability Engineering and System Safety. 91: 992-1007.
Uzunoz, M., Akcay, Y., & Esengun, K. (2008). Energy input-output analysis of sunflower seed (Helianthus annuus L.) oil in Turkey. Energy Sources Part B-Economics. Planning and Policy. 3: 215-223.
Ramedani, Z., Rafiee, S., & Heidari, M.D. (2011). An investigation on energy consumption and sensitivity analysis of soybean production farms. Energy. 36: 6340-6344.
Ghahderijani, M., Pishgar-Komleh, S.H., Keyhani, A., & Sefeedpari, P. (2013). Energy analysis and life cycle assessment of wheat production in Iran. African Journal of Agricultural Research. 8(18): 1929-39. Rahman, MM., & Bala, BK. (2010). Modelling of jute production using artificial neural networks. Biosystems Engineering. 105(3): 350-356.