http://www.sciencepublishinggroup.com/j/ajce doi: 10.11648/j.ajce.20180601.18
ISSN: 2330-8729 (Print); ISSN: 2330-8737 (Online)
Improved Prediction Model for Dynamic Resilient Modulus
of Subgrade Silty Clay in Eastern Hunan and Its Relevant
Finite Element Method Implementation
Dong Cheng
1, 2, *, Zheng Guo-yong
2, Liu Wen-jie
1, 2, Zhou Lun
1, Zhang Rui-lei
11
Hunan Communication Research Institute Limited Company, Changsha, China 2School of Civil Engineering, Central South University, Changsha, China
Email address:
[email protected] (Dong Cheng), [email protected] (Zheng Guo-yong), [email protected] (Liu Wen-jie), [email protected] (Zhou Lun), [email protected] (Zhang Rui-lei)
*Corresponding author
To cite this article:
Dong Cheng, Zheng Guo-yong, Liu Wen-jie, Zhou Lun, Zhang Rui-lei. Improved Prediction Model for Dynamic Resilient Modulus of Subgrade Silty Clay in Eastern Hunan and Its Relevant Finite Element Method Implementation. American Journal of Civil Engineering. Vol. 6, No. 1, 2018, pp. 44-54. doi: 10.11648/j.ajce.20180601.18
Received: December 28, 2017; Accepted: January 19, 2018; Published: February 3, 2018
Abstract:
With the enhancement of transportation speed and axle load, dynamic response of subgrade increases significantly. In order to improve the calculation accuracy of subgrade response under complex stress state, it is necessary to use dynamic indicators instead of static indicators in calculative process. For the sake of investigating the influence factor of dynamic resilient modulus of subgrade silty clay in Eastern Hunan, resilient modulus tests were carried out by conducting repeated load tri-axial tests. Based on available model, an improved resilient modulus prediction model considering four parameters was proposed by introducing k4. Corresponding accurate consistent tangent stiffness matrix was derived. Afterward, the improved model was implemented into finite element method software and verification work was put forward both on single element and pavement-subgrade structure. Finally, calculated results were compared with in-site measured results. Study achievements demonstrate that the improved model exhibits a higher precision and efficiency on single element because k4 can better adjust the affecting proportion of octahedral shear stress. When applied to analysis on pavement-subgrade structure, the improved model can reflect subgrade resilient modulus distribution and evolution more factually. In addition, numerical calculated result nearly coincides with measured results, which shows the application value of the improved model.Keywords:
Silty Clay, Dynamic Resilient Modulus, Prediction Model, Consistent Tangent Stiffness Matrix, Finite Element Method1. Introduction
Currently, the design theory of subgrade and pavement structure is based on statics,analysis parameters are also used
static parameters. It presumes that each structure layer is homogeneous material and presented by resilient modulus and Poisson’s ratio. The stiffness parameter represented by modulus is independent of stress state applied to subgrade [1]. This structure analysis is reasonable under low-speed, low axle load traffic. However, the development of high speed and heavy traffic is the inevitable trend of China's transportation. With the increase of speed and axle load, the dynamic response of subgrade will increase significantly. Therefore, in
order to acquire more accurate result of dynamic response, it is necessary to adopt dynamic resilient modulus in calculation and design on pavement-subgrade structure [2, 3, 4].
highway roadbed design on the project NCHRP 1-37A in America and avoided the problem of the uncertain value of modulus and the dimension inconformity. Afterward, much improvement work based on N37A model was proposed [12, 13, 14].
In view of the approaches differ in specimen size, compaction method, loading time, stress sequence and soil type, available models may not be completely suitable for exhibiting dynamic resilient behaviors of a particular soil. Some targeted modification and validity work need to be carried out. This article initially studied the resilient behavior through repeated load tri-axial tests (RLTT) on Eastern Hunan Silty Clay (EHSC). Based on N37A model, an improved prediction model (N37AP1) considering four parameters was proposed by introducing parameter k4, whose advantage is
proved by comparison with some available models. Next, the consistent tangent stiffness matrix of N37AP1 is derived and
implemented into ABAQUS by compiling the user material subroutine (UMAT). Finally, finite element method (FEM) calculations embedded with N37AP1 model were carried out both on single element and pavement-subgrade structure. Corresponding verification work was put forward. The comparison between calculated results and in-site measured results was also analyzed to show the accuracy and application value of the improved model.
2. Experiment
2.1. Material
EHSC is a widely-used materials for filling subgrade in Eastern Hunan. Some property indexes of EHSC are shown in Table 1.
Table 1. Property indexes of EHSC.
ρdmaxa/((((g·cm -3
) ) )
) wopt
b/% w
Lc/% wPd/% D (d<2mm)e/% D (d<0.074mm)/%
1.91 15.21 30.32 17.63 100 58.40
aρ
dmax=maximum dry density; bwopt=optimum water rate; cwL=liquid limit; dwP=plasticity; eD=mass percentage. 2.2. Repeated Load Tri-Axial Tests (RLTT)
RLTT is commonly used to establish the mechanical characteristics of soil and describe the resilient behaviour as well. The resilient modulus is defined as the ratio of the applied deviator stress and the resulting axial resilient (recoverable) strain [15].
The RLTT was carried out with GDSLAB cyclic tri-axial apparatus. The specimens for RLTT have a diameter of 100 mm and a height of 200 mm. These specimens were compacted in a rigid mold with three levels of moisture content w (wopt+3%, wopt, wopt-3%) and two levels of
compaction degree K (93%, 96%). Therein, refer to the Code
for Design of Highway Subgrade of China, specimens with
K=96% represent roadbed layer and those with K=93% represent embankment layer. The moisture content wˊ after repeated load was also measured. The relative error between w
and wˊ should not exceed 1%. Effects of water content on specimens’ structure and mechanical behavior in compaction process were assumed to be ignorable.
An initial confining pressure σ3 (15kPa, 30kPa, 45kPa,
60kPa) was imposed on the specimens. Next cyclic deviator stress σd was imposed on the axial direction with
stress-controlled sinusoidal loadings at 5Hz. Usually, the cyclic stress caused by vehicle loading in subgrade is less than 80kPa. Nevertheless, the range of cyclic deviator stress is enlarged (30kPa, 55kPa, 80kPa, 105kPa) in these tests for acquiring variation trend of dynamic resilient modulus more conveniently. Each specimen was first subjected to 1000 applying loading cycles to stabilize the permanent deformations (at the end of this condition, the increase in the axial plastic deformation was lower than 10-7 per cycle). Afterward, a series of cyclic loads (100 cycles) was applied with designed stress levels. The axial resilient (recoverable) strain at last five cycles were used to calculate resilient modulus.
2.3. Testing RESULTS
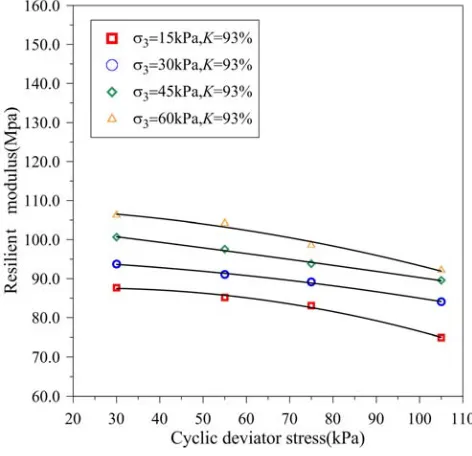
Figure 1 summarizes the dynamic resilient module (Mr) in
terms of different stress state and compaction degree when w=
wopt. According to Figure 1 (a) and Figure 1 (b), the Mr of
EHSC decreases with the rise of cyclic deviator stress, and the decrease rate enhances gradually. Meanwhile, as shown in Figure 1 (c) and Figure 1 (d), the Mr increases with the rise of
bulk stress, mainly changing in a linear tendency. In addition, the influence of compaction degree on Mr is obvious. For
example, when confining pressure σ3 is 60 kPa and deviator
stress σd is 30 kPa, Mr of the specimen with K=96% increases
nearly 13.3% compared to the one with K= 93%.
(b)
(c)
(d)
Figure 1. Relationship curve of Mr and σd, θ with different compaction
degree (w= wopt).
3. Modelling Procedure and Evaluation
3.1. Modified Model Based on N37A and Related Regression Analysis
The precondition of establishing a proper prediction model of dynamic resilient module is accurately setting up a relationship of stress and strain according to constitutive law, and the influence of other factors, such as compaction degree and moisture content, can be reflected by parameter in model expression. Note that for different subgrade soil, the impact of octahedral shear stress on Mr is significantly various [16, 17],
another parameter k4 is added into N37A model to fine adjust
the affecting proportion of octahedral shear stress on Mr. The
improved model (abbreviated as N37AP1) with four model parameters is expressed as follows:
(
) (
2)
3r 1 / 4 oct/ 1
k k
a a a
M =k P θ P kτ P + (1)
Table 2. Regression results of prediction model (k4=0.1).
Models Compaction degree Moisture content k1 k2 k3 DC2
N37AP1 96%
wopt -3% 1365.8 0.146 -5.635 0.904
wopt 1302.2 0.136 -9.010 0.881
wopt +3% 984.9 0.183 -4.895 0.943
93% wopt 1028.9 0.256 -8.477 0.872
N37A 96%
wopt -3% 1387.4 0.145 -0.704 0.839
wopt 1335.0 0.134 -1.124 0.813
wopt +3% 1000.2 0.183 -0.620 0.901
93% wopt 1057.9 0.255 -1.070 0.817
UZANP1 96%
wopt -3% 971.3 0.137 -0.137 0.719
wopt 756.9 0.12 -0.218 0.679
wopt +3% 722.0 0.18 -0.128 0.910
93% wopt 606.0 0.247 -0.217 0.744
This model evolves to K-θ model [18-19] when k4 takes a
small value and it becomes N37A model when k4 is 1. For
where k4 is fixed at 0.1. Determination Coefficient (DC),
which is based on resolving the square sum of total departure, is used to evaluate the fitting degree of regression. It is indicated that N37AP1 Model’s fitting degree is the best because of largest DC value.
3.2. Comparison of Prediction Results
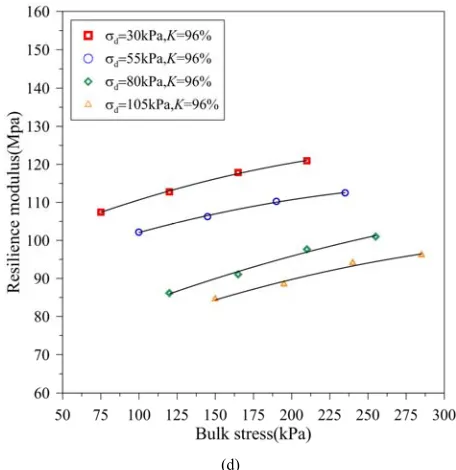
Figure 2. The relative errors of measured value.
In order to evaluate the prediction accuracy of N37AP1 model, based on measured value, relative prediction errors from different prediction models are given in Figure 2. It can be found that the errors of N37AP1 model (k4=0.1) are totally
the smallest, generally retaining 70%~90% of N37A Model and 50%~70% of UZANP1 Model. Besides, the error of N37AP1 keeps less than 5% when shear stress is small and increases slightly with rise of the shear stress. However, the maximum of relative error is 8.3%, which indicates an ideal prediction accuracy.
4. Derivation of Consistent Tangent
Matrix of n37ap1model
An important purpose of establishing a prediction model in this article is to implement N37AP1 model to FEM calculation based on ABAQUS, which can be realized by utilizing UMAT (user materials subroutine) interface. Because each analysis step of nonlinear solution in ABAQUS is proceeded by generating consistent tangent stiffness matrix, derivation of N37AP1 model’s consistenttangent stiffness matrix in form of stresses becomes a significant precondition. The solution procedure is as follows:
The linear elastic constitutive relation can be expressed as:
( ) / (1 )
E
αε
v= + +
S I E (2)
where E is strain tensor; S is stress tensor; E is modulus of linear elasticity; ε=tr (E) is bulk strain; v is Poisson's ratio; α is defined as: α=v/(1-2v). Similar to linear elastic constitution, by replacing E with stiffness matrix Mr [20], the nonlinear
elastic constitutive relation is derived as:
( ) / (1 )
r
αε
ν
= + +
S M I E (3)
where I is unit matrix. Defining C (θ,τoct) as:
(
)
(
)
(
) (
2)
3oct r oct 4 oct
, , / (1 ) a / a k / a 1 k
C θ τ =M θ τ +ν =kP θ P kτ P + (4)
where k1, k2, k3, k4 are parameters of N37AP1 model; θ is bulk stress (compression condition); Pa is standard atmospheric
pressure; τoct is octahedral shear stress; k is defined as: k=k1/(1+v).
Substituting Equation (4) into Equation (3) gives:
(
, oct)
( )C
θ τ
αε
= +
S I E (5)
The expression of bulk stress is derived as Equation (6):
(
oct)
(
oct)
(
oct)
(
)
( ) 3 , , , 3 1 2
tr S = C
θ τ αε
+Cθ τ ε
=Cθ τ ε α
+ (6)Bulk stress σ and deviator stress tensor S can then be
converted as:
( )
(
oct)
=tr = C ,
σ
Sα θ τ
ε
(7)(
, oct)
Cθ τ
=
S E (8)
where, E is deviator strain tensor;
α α
=3 +1= 1(
+ν
) (
1-2ν
)
. Defining ζ and γ2 as:ζ ε
= (9)2=1/3( : )
γ E E (10)
Equation (7) and Equation (8) can be converted as:
(
)
(
)
oct
oct oct
= ,
= ,
C
C
θ α θ τ
ζ
τ
θ τ
γ
(11)
(
) (
)
(
) (
)
2 3
2 3
4 oct
oct 4 oct
= / / 1
= / / 1
k k
a a a
k k
a a a
kP P k P
kP P k P
θ α θ τ ζ τ θ τ γ + +
(12)
Equation (12) can be simplified as:
( )
( )
oct oct , ,θ θ ζ γ
τ
τ ζ γ
= = (13)
Therefore, C (θ, τoct) can be transformed as C=C (ζ, γ) and
Equation (5) becomes:
( )
, ( )C
ζ γ αε
= +
S I E (14)
The consistenttangent stiffness matrix of prediction model can then be expressed as:
(
) (
)
=C +
α
+αε
+ C∂ ⊗ ⊗ ∇
∂ E
S
Γ I I I E
E (15)
where I= ∂ ∂ε E or
[ ]
I ij=δij ; Γ= ∂ ∂E E or[ ]
Γ ijkl=(
δ δik jl+δ δjk il)
/ 2.Therein,
( )
oct octoct oct
C =( C / )( / )( / )+( C / )( / )( / )
( C / )( / )( / ) ( C / )( / )( / )
θ θ ζ ζ τ τ ζ ζ
θ θ γ γ τ τ γ γ
∇ ∂ ∂ ∂ ∂ ∂ ∂ ∂ ∂ ∂ ∂ ∂ ∂
+ ∂ ∂ ∂ ∂ ∂ ∂ + ∂ ∂ ∂ ∂ ∂ ∂
E E E E
E E (16)
According to Equation (9) and Equation (10), Equation (17) and Equation (18) are derived as:
( )
/ =( / )( / )= sgn
ζ
ζ ε ε
ε
∂ ∂E ∂ ∂ ∂ ∂E I (17)
(
) (
)
2 2
2 2 2
/ 3 : / 3 / 3 : 2 ( : ) / 3 ( : ) / 9 / 3
: 2 / 3 / 3 / 3 : / 3 / 3
γ ε ε ε ε ε ε ε = − − = − + = − + = −
E I E I E E I E I I
E E E E (18)
Equation (19)-Equation (21) can then be acquired by differential of both sides of Equation (18):
[
]
2 d
γ γ
= 2E: dE−(2 / 3) dε ε
/ 3 (19)d : d / 3
γ γ =E E (20)
/
= / (3 )
γ
γ
∂ ∂
E E
(21)According to Equation (12), the following equations are acquired:
(
)
(
)(
)
3
3 oct oct 4
oct oct 4 2
oct 2 oct oct 4
/
/ /
/ / 1
/ ( / ) /
a
a
a mk C
m C k P k
mC P k k
mk C P k
θ γ θ θ ζ α τ τ τ γ τ τ ζ τ α τ θ ∂ ∂ = ∂ ∂ = − + + ∂ ∂ = + − ∂ ∂ = + (22)
where m=1/ (−k3 oct
τ
+τ
oct+P ka/ 4−k2 octτ
−k P k2 a/ 4).Integrating Equation (18), Equation (21), Equation (22)
into Equation (16) and assuming that ε has the same sign with
σ gives:
(
) ( )
( )
(
)
(
)
(
)
22 3 oct oct 4
2 2 3 oct
2 2
2 3 3 2
2 2
2 oct 4 3
C / sgn /
C sgn /
C / 3 1 / 3
C / / / 3
a
a
k k P k
m k k C
k k k C k
m k P k k C
α τ τ ε θ α τ ε θ γ γ α τ θ γ − + + ∇ = + + + − = + + E I I E E I E (23)
Substituting Equation (23) into Equation (15), the consistent tangent stiffness matrix can be expressed as a function of deviator stress:
(
)
(
)
/ = + + 1 / 3 +
( ) C C C m α αε α ∂ ∂ ⊗ ⊗∇ = + ⊗ + E
S E Γ I I I E
Γ I I L (24)
where
2( oct+ a/ 4) / 3 2( oct+ a/ 4) / 3 / 9 oct 3 / 3 oct
k P k k P k k k
α τ α τ θ θ τ τ
= ⊗ + ⊗ + ⊗ + ⊗
L I I S I I S S S
For programming convenience, the consistent tangent stiffness matrix can be simplified as:
1 2 3 4
/ = (C d d d d )
∂ ∂S E Γ+ I⊗ +I S⊗ +I I⊗ +S S⊗S (25)
where d1= +α m kα τ2( oct+P ka/ 4) / 3;d2=m kα τ2( oct+P ka/ 4) /θ ;
3 3/ 9 oct
d =m kθ τ ; d4=k3/ 3
τ
oct.It can be found from Equation (25) that consistent tangent stiffness matrix is finally exhibited in terms of θ and τoct,
which are independent variable and can be calculated by stress
5. Verification Work
5.1. Verification on Single Element
Figure 3. Schematic diagram of load and boundary condition on single element.
In order to verify the validity of the derived consistent tangent stiffness matrix and programming, a verification work was firstly carried out on single element C3D8 (8-node linear brick, see Figure 3) in ABAQUS, and k4 was assigned with
different values. The adopted N37AP1 model parameters are presented in Table 3.
Table 3. Parameter of N37AP1 model. Poisson's ratio µ k1 k2 k3 k4
0.25 400 0.3 -0.2 1
0.25 400 0.3 -0.2 0.1
0.25 400 0.3 -0.2 10
For single element, three adjacent surfaces’ normal displacement is restrained and other three surfaces are imposed with normal loading. Initial loading values are: axial stress σ1=0kPa, lateral stress σ2=σ3=0kPa; Final loading values
are: σ1=100kPa, lateral stress σ2=σ3=10kPa. Both of axial
stress and lateral stress increase linearly.
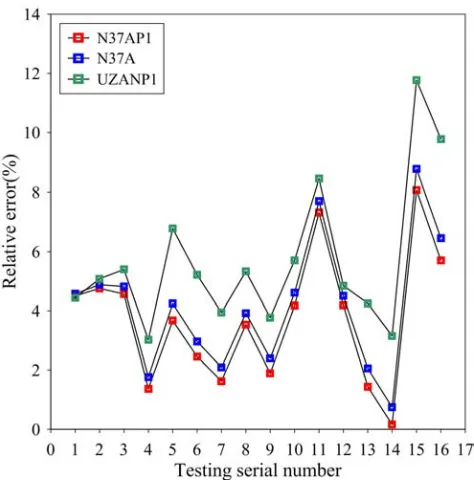
The comparison of FEM calculation results and analytic solution (AS) are shown in Figure 4~Figure 5. For example, analytic solution of strain ε1 can be expressed as:
1 [ 1 ( 2 3)] /Mr
ε
=σ ν σ σ
− + (26)where Mr can be calculated by Equation (1) when the values of
σ1, σ2, σ3 are known.
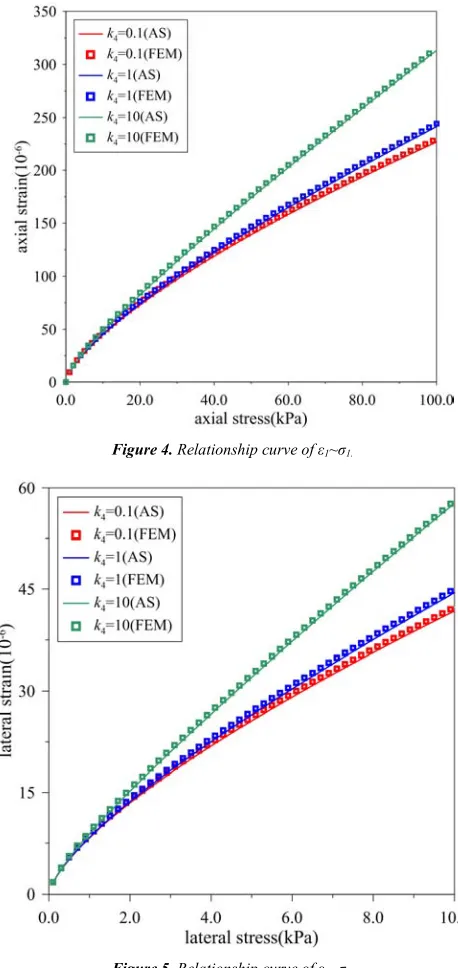
It can be inferred from Figure 4 and Figure 5 that FEM results are close to AS when k4 is assigned with different
values. Meanwhile, when k4 is comparatively large, N37AP1
model approaches UZANP1 model. FEM results of strain become higher and the shear softening effect of specimens become more obvious. Otherwise, N37AP1 model approaches
K-θ model. FEM results of strain become lower. Generally, k4
reflects shear stress’s influence degree.
Figure 4. Relationship curve of ε1~σ1.
Figure 5. Relationship curve of ε3~σ3.
5.2. Verification on Pavement-Subgrade Structure
Table 4. Parameters of FEM model.
Name of the material Thickness/cm Resilient modulus/MPa Poisson's ratio
SMA 4 1800 0.15
AC-20 6 1600 0.15
AC-25 8 1500 0.15
Cement stabilizing layer 60 1000 0.20
Roadbed(K=0.96) 80 In Tab.2 0.35
Embankment(K=0.93) 650 In Tab.2 0.35
Foundation 800 40 0.38
Figure 6. Geometry and mesh of the FEM model used for validity work.
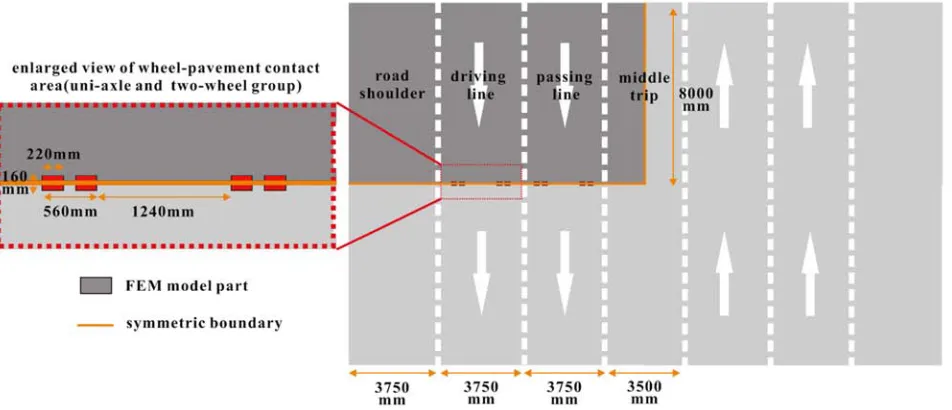
Figure 7. Top view of pavement schematic diagram of the FEM model and wheel-pavement contacting area.
The bottom boundary condition of the model is fixed constraint, and the four lateral planes are set as viscoelastic boundary to absorb stress wave. The mesh finite elements near the loading area are refined. The loading form of vehicle is uniaxial two-wheel group with 100kN axle load, which is a standard axle load used in expressway design in China as
the contour picture of resilient modulus of subgrade soil under self-weight. It can be seen that resilient modulus values of different parts are various, which is resulted from spatial distribution difference of stress state. Figure 9 presents transverse and the vertical distribution of calculated Mr of
unique nodal in subgrade. Mr rises with depth increase under
self-weight effect and tends to constant beyond depth of 5m (Figure 9 (a)). The Mr of roadbed is in the range of
70Mpa~100Mpa, while it is in range of 60Mpa~85Mpa at embankment part. Because EHSC with K=0.96 and K=0.93 have different N37AP1 model parameters, Mr changes
abruptly in the bound between roadbed and embankment, which reflects compaction degree’s influence on Mr in
numerical study. As it shown in Figure 9 (b), Mr attenuates
from the middle to the side of the subgrade, and the tendency becomes significant for larger subgrade depth.
Figure 8. Mr of subgrade with self-weight.
(a)
(b)
Figure 9. Mr distribution curve of subgrade soil with self-weight: (a) vertical
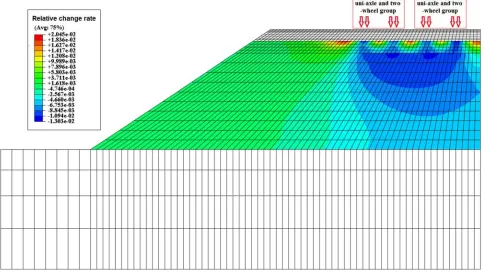
Figure 10 is the relative change rate contour picture of Mr
caused by the change of stress states when vehicle loading is imposed on pavement surface. For the roadbed part underneath the wheel-pavement contacting area, Mr
attenuates with a maximum amplitude -1.3% because increase in deviator stress is dominated. In contrast, Mr of
roadbed part underneath wheel clearance area increases with a maximum amplitude 2.0% because lateral compression
effect is dominated. It seems that Mr at embankment part is
less influenced by vehicle loading, totally showing negative value. Compared to self-weight condition, subgrade Mr will
decrease when vehicle loading is considered. By using N37AP1 model into dynamic analysis, variation of resilient modulus in each element of subgrade caused by vehicle loading is realized.
Figure 10. Contour picture of relative change rate of subgrade Mr when vehicle loading is imposed.
5.3. Comparison with Measured Values
Figure 11 shows the comparison between calculated results and in-site measured results. Both calculated and measured results have similar variation trend with depth increases. It is indicated that when the axle load is 100kN or 120kN, calculated stress and deformation are close to measured data. The error rises with increase in axle load. When axle load reaches 140kN, calculated error of stress is large while calculated error of deformation keeps in 10%. However, according to transportation volume investigation, ratio of 140kN axle load is only 4.3%, and the percentage 100kN~120kN axle load surpasses 85%. Therefore, the calculated results used N37AP1 model is dependable in usual axle load range. In general, traditional linear elastic design method of subgrade is unreliable to some extent because of neglecting extra deformation resulting from subgrade Mr
attenuation. In contrast, N37AP1 model is capable of stimulating Mr attenuation caused by vehicle loading so that
corresponding calculation accuracy is enhanced. It provides important method and tool for subgrade design.
(b) Vertical dynamic deformation peak
Figure 11. Comparison between FEM calculated results and in-site measured results under different axle load.
6. Conclusion
For resilient behavior of Eastern Hunan silty clay, experimental studies were carried out in the current article. The major findings are summarized as follows:
According to the RCTT results, Mr of EHSC totally
decreases with the rise of cyclic deviator stress and increases with the rise of bulk stress. Evidently, Mr is largely influenced
by change of stress state. Mr also presents a positive
correlation with compaction degree.
A improved prediction model (N37AP1 model) of Mr is
proposed by adding k4 parameter into N37A model to fine
adjust the influence degree of octahedral shear stress on Mr.
N37AP1 model’s prediction accuracy is obviously higher by comparison with N37A model and UZANAP1 model.
The verification work of N37AP1 on single element is put forward in condition of gradient loading. The result shows that the stress-strain curves when k4=0.1,1 and 10 are very close to
analytic solution, which indicates that derivation of Jacobian matrix and programming work are mainly correct.
When implementing N37AP1 model into FEM analysis on expressway structure, the calculated results can reflect the spatial difference of resilient modulus under self-weight effect as well as the influence of compaction degree. The evolution of resilient modulus under vehicle loading can also be exhibited.
The calculated results of stress and deformation used N37AP1 model is close to measured results in usual axle load range of 100kN~120kN. Relative to traditional prediction model and linear elastic design method, proposed N37AP1 model and related implementation work provide a more effective and accurate numerical method for studying subgrade’s dynamic responses and subgrade design.
Acknowledgements
This work was supported by the Youth Talents Support Program of Hunan (grant number 2016RS3037); Fund of Post-doctoral Studies. The authors would like to thank all the members of Key Laboratory at Hunan Communication Research Institute, Changsha, China.
References
[1] Hossein N, Cyrille C, Maria IA, Pierre H, Farimah M. Unsaturated resilient behavior of a natural compacted sand. J Computers and Geotechnics, 2011; 38 (1): 491-503.
[2] Li ZY, Dong C, Zou JR. Research on experiment and prediction model of dynamic resilient modulus of laterite soil in Southern Hunan. J Rock and Soil Mechanics, 2015; 36 (7): 1840-1846. (in Chinese).
[3] Ni B, Hopkins TC, Sun L. Modeling the resilient modulus of soils. Proceedings of the 6th International Conference on the Bearing Capacity of Roads, Railways and Airfields. Lisbon; 2002, p. 1131-1142.
[4] Andrei D, Witczak MW, Schwartz CW. Harmonized resilient modulus test method for unbound pavement materials. 83rd Annual Meeting of Transportation Research Board; 2004. [5] Fortunato E, Pinelo A, Fernandes MM. Characterization of the
fouled ballast layer in the substructure of a 19th century rail way track under renewal. J Soils Found, 2010; 50 (1): 55-62. [6] Youngji J, Bin Y, Feng Z. Numerical simulation of sand
subjected to cyclic load under undrained conventional Tri-axial test. J Soils Found, 2010; 50 (2): 177-194.
[7] Trinh VN, Tang AM, Cui YJ, Dupla JC, Canou J, Calon N, Lambert L, Robinet A, Schoen O. Mechanical characterization of the fouled ballast in an client railway track substructure by large-scale Tri-axial tests. J Soils Found, 2012; 52 (3): 511-523.
[8] Inam A, Ishikawa T, Miura S. Effect of principal stress axis rotation on cyclic plastic deformation characteristics of unsaturated base course material. J Soils Found, 2012; 52 (3): 465-480.
[9] Puppala AJ. Estimating stiffness of subgrade and unbound materials for pavement design, NCHRP Synthesis 382, Transportation Research Board, National Research Council, Washington, D. C; 2007.
[10] Uzan J. Characterization of granular material. Proceedings Transportation Research Record 1022 Washington; 1985, p. 52-59.
[11] Witczak MW, Uzan J. The universal airport pavement design system. Report I of V: Granular Material Characterization, Department of Civil Engineering, University of Maryland, College Park, Md; 1988.
[12] Chen SK, Ling JM, Luo ZG. Stress-dependent characteristics and prediction model of the resilient modulus of subgrade soils. J China Civil Engineering Journal, 2007; 40 (6): 95-99. (in Chinese).
[14] Ling JM, Su HC, Xie HC. Library research on dynamic resilient modulus of subgrade soil. J Chinese Journal of Underground Space and Engineering, 2010; 6 (5): 919-925. (in Chinese).
[15] Andrei D, Witczak MW, Schwartz CW, Uzan J. Harmonized resilient modulus test method for unbound pavement materials. J Trans. Res. Rec. TRB, 2004: 29-37.
[16] Ministry of Communications of China. Specifications for design of highway subgrades. China Communications Press, Beijing; 2015. (in Chinese).
[17] Liu M. Analysis of the relationship among the statistical tests
on linear regression model. J Statistics & Information Forum, 2011; 26 (4): 21-24. (in Chinese).
[18] Dong C. Study on dynamic resilient modulus and critical dynamic stress of subgrade soil and performance analysis of subgrade and pavement (Ph. D. thesis). Changsha: Central South University; 2014. (in Chinese).