©2015 JNAS Journal-2015-4-4/501-507 ISSN 2322-5149 ©2015 JNAS
Automatic Algorithm Design by Neural Network
and Indicators in Iran Stock Transactions
Roohallah Bahmani Zargari
1*, Mansur Aminilari
2and Mohsen Bashiri
31- MA Department of Computer, Broujerd Branch, Islamic Azad University, Broujerd, Iran
2- Assistant Professor, Department of IT and Computer College of Engineering, Marvdasht branch, Islamic Azad University, Marvdasht, Iran
3- Assistant Professor, Department computer College of Engineering, Tehran Branch, Sanati Sharif University, Tehran, Iran
Corresponding author:
Roohallah Bahmani Zargari
ABSTRACT: By predicting the situation of market in the future an investor can determine its position, situation and the rate of his investments, in a way that the efficiency of his/her assets reach to its maximum. The advanced technology of computer has made a vast revolution in the field of financial markets and trade approach. This technology has made two important and interrelated changes in this area. One is using computer by investors for automat zing trade processes and the other is reconstructing financial markets and furnishing them with system the electronic limit order book. With this kind of order book, there is no need for physical presence in the salon of stock market trades. In this research, we have tried to offer the best prediction of the movement trend in the next day share price by using technical analysis (stock exchange diagram analysis) and cascade forward, learning by three layer supervised learning, artificial neural networks and levenberg-marquardt learning algorithm, weight learning function and delta rule), math metical rules, trade rules,Geometric devices(trend line), survey devices (indicators) such as Ichimoku Cloud indicator and relative strength index (RSI) and also geometrical tools. In doing so, an efficient and profitable algorithm is offered to do the selling and buying processes automatically (with the management of investor).
Keywords: Technical analysis, cascade forward neural network, algorithmic trades, indicator.
INTRODUCTION
502
A Review of Past Research
Technical analysis emerged with Charles down and William Hamilton’s perspectives and articles (1900-1902). A review of literature on this topic manifests those numerous researchers who worked on this field. Before the systematic constitution of this method of analysis, brown and Jennings (1989) showed the value of technical analysis associated whit signals and prices.
In his research, Sweeny (1988) concluded that depending on the level of transactions expenses, filtering rules (filtering rules and mobile mean rules are the two transactional rules of technical analysis), lead to a more or less profitable result.
Lakonishok and Lebaron (1992) used mobile mean rules and concluded that these rules will also make profitable results.
Lerich and Thomas (1993) and Kho (1996) also investigated the mobile mean strategy and concluded that the mentioned strategies are helpful.
Ratner and Lill (1993), in some of Asian and Latin American countries, reached to this result that the use of technical analysis methods will lead to profitable results. Menig and Matno and Goro (2010) concluded that mobile mean rules are of more prediction ability and they are able to get more efficiency. Mang and Manzure and Chew (2012) proved the better function of mobile mean method and partial power index comparing with selling and maintenance method in Singapore stock exchange.in his research, Amiri (1995),concluded that technical analysis method can be implemented in Tehran stock exchange market to analyze the shares. Khanloo (1996) reached to this result that various methods of technical analysis which were used in the world financial markets, are also applicable to some extent in Iran stock market.
The results of Gholamzade and Norush’s research (2000) showed that the process of making annual profit by those Iranian firms which were under investigation was mobile mean method. In predicting shares profitability, Mehrani and Karami (2008) used historical information (both financial and non-financial) to distinguish successful firms from unsuccessful ones. In their research, Sadeghisharif and sultan Zareii (2011) concluded that technical analysis methods are helpful and profitable for analyzers and investors of Tehran stock exchange market.
Designing the Suggested Neural Network
In the stock market, lots of data are declared daily as shares characters. The parameters which we consider as input variables in this model, includes five important data in time period of one day; 1) The open price of share 2) The close price of price of share 3) The low share price 4) The high share price 5) Close gold price. Since, for modeling with artificial neural networks, test-error data are required, the information of a 2 year period (2011-2013) about total index of Tehran stock exchange market was considered suitable for this research. This information which was extracted daily and online from formal site of Tehran stock exchange market (www.irbourse.com), constituted the basic data base of this research.
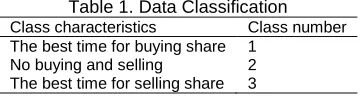
The aim of classification is to know how the situation of the considered share for selling or per chasing, will be in future. In this research, using trend rule (up trend, down trend, sideways trend) and circumstances of previous days occurred in the market, were considered as a standard for data classification. By referring to past data and evaluating the market atmosphere and above cited cases, an investor decides to calibrate share and per chase it in the incoming days.In order to classify data, we have divided them in to 3 classes based on their characteristics (Table1).
Table 1. Data Classification
Class characteristics Class number
The best time for buying share 1
No buying and selling 2
The best time for selling share 3
Up to this section, a set of 5 variables as the network input and a classification of 1 to 3 are determined for the output.
Various models and architectures were examined for determining the suitable topology of neural network. By changing the number of hidden layers, the main prediction model was selected. Finally, the optimum number of layers was calculated as four layers (one input layer, two hidden layers, and one output layer) and the number of neurons was considered as (5-6-1).
503
Figure 1. An Overall Representation of the Structure of optimized Neural Network
After developing the data base related to training, and defining the suitable number of layers and neurons, now it is time to select the type of network. To do so, in this research, we used the cascade forward network with multi-layered supervisor for the first time (multi multi-layered networks are far more efficient and stronger than unit multi-layered networks to solve problems)(figure 2).
Figure 2. The Structure of Nodes in the Cascade Forward Network
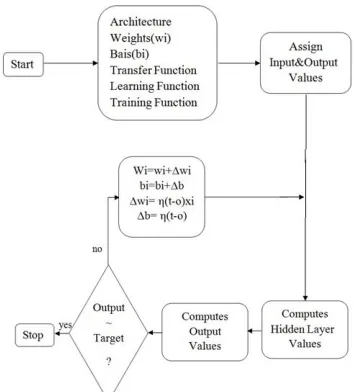
Generally, if we want to describe the body of neural network designed in this paper, we can show it in the following figure (3).
Figure 3. The body of suggested neural network
504
Table 2. A Summary of Parameters and Specifications of Neural Network Explanation
Parameters
Cascade forward The structure of neural network
Feed forward Type of neural network
Levenberg – Marquardt algorithm Learning (training) algorithm
Delta ruler (stochastic gradient) Bias and weight learning function
Mean square error (MSE) and root mean square error (RMSE) Error function
2 Number of hidden layers
6 Number of nodes in the hidden layer
6 Validation check
tan sigmoid Hidden layer transfer function
Symmetric saturating function Output layer transfer function
530 Number of training data
131 Number of examination data
Investigating the Value of Real Data and Prediction
After training the network, now it is time to test the network for the new data in order to evaluate the precision rate of simulation output with the target value. According to figure (4), we can observe the graph of network output with the obtained target value.
Figure 4. The graph diagram of network output with a target value of test data
Designing the Proposed Trade Algorithm
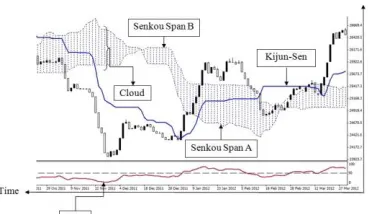
Indicators are used for clarification of the market’s movement type. According to figure 5, we draw Ichimoku indicator lines for confirmation and subsequently the relative strength index line for announcing movement warnings on the diagram of the market’s past days (the total index diagram), to have a glance at the market. Consequently we will design the sell and buy signals for our algorithm.
Figure 5. Drawing the indicators line on the total index data
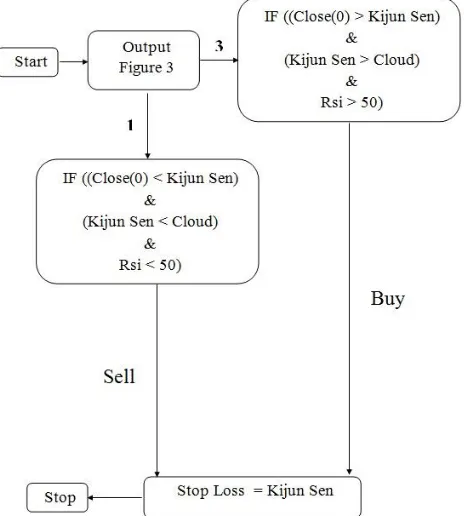
The Proposed Buy Signal
If the neural network output is numerical value of one and (the best time for buying share), the daily information of close price of each share will be based on the candle of previous day, sits above the line “kijun-sen” and the line “kijun-sen” sits over the “ichimuko cloud” indicator and lines of this indicator are calculated in the following range: Tenkan-Sen= Over Last 9 Periods
Kijun-Sen= Over Last 26 Periods
505
Cloud = Senkou Span A and B
The relative strength index (RSI) of indicator is bigger than number 50. RSI >50
The signal buy is transmitted and the point “stop loss” lies on the line “kijun-sen”.
The Proposed Sell Signal
If the neural network output is numerical value of three and (the best time for selling share), the daily information of close price of each share will be based on the candle of previous day, lies below the line “kijun-sen” and the line “kijun-sen” lies below the “ichimuko cloud” indicator and lines of this indicator are calculated in the following range: Tenkan-Sen= Over Last 9 Periods
Kijun-Sen= Over Last 26 Periods
Senkou Span B= Over Past 52 Time Periods, Sent 26 Periods Ahead
Senkou Span A: (Tenkan Line + Kijun Line)/2 Plotted 26 Time Periods Ahead Cloud = Senkou Span A and B
The relative strength index (RSI) of indicator is smaller than number 50. RSI <50
The signal sell is transmitted and the point “stop loss” lies on the line “kijun-sen”.
The Body of Proposed Algorithm
Generally, if we want to investigate the body of proposed algorithm in this research, we had better to look at the body of algorithm in figure 6.
Figure 6. The body of proposed algorithm
Investing the Outputs of Trade Algorithm
506
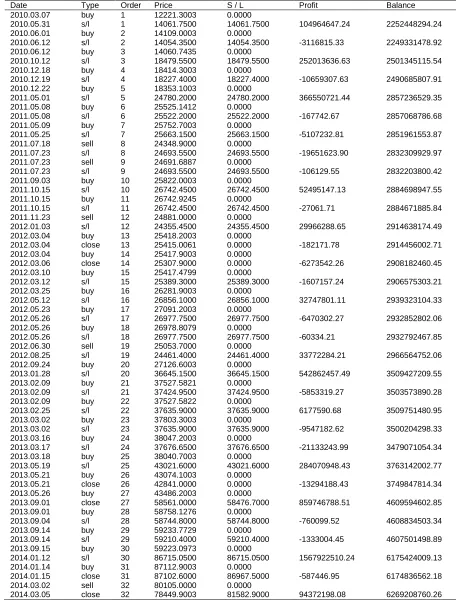
Table 3. step by step output of proposed algorithm
Date Type Order Price S / L Profit Balance
2010.03.07 buy 1 12221.3003 0.0000
2010.05.31 s/l 1 14061.7500 14061.7500 104964647.24 2252448294.24
2010.06.01 buy 2 14109.0003 0.0000
2010.06.12 s/l 2 14054.3500 14054.3500 -3116815.33 2249331478.92
2010.06.12 buy 3 14060.7435 0.0000
2010.10.12 s/l 3 18479.5500 18479.5500 252013636.63 2501345115.54
2010.12.18 buy 4 18414.3003 0.0000
2010.12.19 s/l 4 18227.4000 18227.4000 -10659307.63 2490685807.91
2010.12.22 buy 5 18353.1003 0.0000
2011.05.01 s/l 5 24780.2000 24780.2000 366550721.44 2857236529.35
2011.05.08 buy 6 25525.1412 0.0000
2011.05.08 s/l 6 25522.2000 25522.2000 -167742.67 2857068786.68
2011.05.09 buy 7 25752.7003 0.0000
2011.05.25 s/l 7 25663.1500 25663.1500 -5107232.81 2851961553.87
2011.07.18 sell 8 24348.9000 0.0000
2011.07.23 s/l 8 24693.5500 24693.5500 -19651623.90 2832309929.97
2011.07.23 sell 9 24691.6887 0.0000
2011.07.23 s/l 9 24693.5500 24693.5500 -106129.55 2832203800.42
2011.09.03 buy 10 25822.0003 0.0000
2011.10.15 s/l 10 26742.4500 26742.4500 52495147.13 2884698947.55
2011.10.15 buy 11 26742.9245 0.0000
2011.10.15 s/l 11 26742.4500 26742.4500 -27061.71 2884671885.84
2011.11.23 sell 12 24881.0000 0.0000
2012.01.03 s/l 12 24355.4500 24355.4500 29966288.65 2914638174.49
2012.03.04 buy 13 25418.2003 0.0000
2012.03.04 close 13 25415.0061 0.0000 -182171.78 2914456002.71
2012.03.04 buy 14 25417.9003 0.0000
2012.03.06 close 14 25307.9000 0.0000 -6273542.26 2908182460.45
2012.03.10 buy 15 25417.4799 0.0000
2012.03.12 s/l 15 25389.3000 25389.3000 -1607157.24 2906575303.21
2012.03.25 buy 16 26281.9003 0.0000
2012.05.12 s/l 16 26856.1000 26856.1000 32747801.11 2939323104.33
2012.05.23 buy 17 27091.2003 0.0000
2012.05.26 s/l 17 26977.7500 26977.7500 -6470302.27 2932852802.06
2012.05.26 buy 18 26978.8079 0.0000
2012.05.26 s/l 18 26977.7500 26977.7500 -60334.21 2932792467.85
2012.06.30 sell 19 25053.7000 0.0000
2012.08.25 s/l 19 24461.4000 24461.4000 33772284.21 2966564752.06
2012.09.24 buy 20 27126.6003 0.0000
2013.01.28 s/l 20 36645.1500 36645.1500 542862457.49 3509427209.55
2013.02.09 buy 21 37527.5821 0.0000
2013.02.09 s/l 21 37424.9500 37424.9500 -5853319.27 3503573890.28
2013.02.09 buy 22 37527.5822 0.0000
2013.02.25 s/l 22 37635.9000 37635.9000 6177590.68 3509751480.95
2013.03.02 buy 23 37803.3003 0.0000
2013.03.02 s/l 23 37635.9000 37635.9000 -9547182.62 3500204298.33
2013.03.16 buy 24 38047.2003 0.0000
2013.03.17 s/l 24 37676.6500 37676.6500 -21133243.99 3479071054.34
2013.03.18 buy 25 38040.7003 0.0000
2013.05.19 s/l 25 43021.6000 43021.6000 284070948.43 3763142002.77
2013.05.21 buy 26 43074.1003 0.0000
2013.05.21 close 26 42841.0000 0.0000 -13294188.43 3749847814.34
2013.05.26 buy 27 43486.2003 0.0000
2013.09.01 close 27 58561.0000 58476.7000 859746788.51 4609594602.85
2013.09.01 buy 28 58758.1276 0.0000
2013.09.04 s/l 28 58744.8000 58744.8000 -760099.52 4608834503.34
2013.09.14 buy 29 59233.7729 0.0000
2013.09.14 s/l 29 59210.4000 59210.4000 -1333004.45 4607501498.89
2013.09.15 buy 30 59223.0973 0.0000
2014.01.12 s/l 30 86715.0500 86715.0500 1567922510.24 6175424009.13
2014.01.14 buy 31 87112.9003 0.0000
2014.01.15 close 31 87102.6000 86967.5000 -587446.95 6174836562.18
2014.03.02 sell 32 80105.0000 0.0000
507
RESULTS AND DISCUSSION
Generally, the results of this research can be expressed as follows:
The first finding of this study understands the complexity and procedure of price variations in Tehran stock market.
By technical analysis, Tehran stock market can achieve an acceptable prediction.
Optimum exploitation of the indicators “relative strength index (RSI) ” and “Ichimoku Cloud” with the mentioned input (entry) variables can result in the best profit and the best consequence for investors. Modeling indicators with proposed parameters and consequently achieving the new trade algorithm
have brought about a desirable success in predicting the total index.
By designing an automatic and secure trade algorithm, investors are encouraged to invest their capital in Tehran stock market and consequently flourish the economics of the country.
The time behavior of stock market (based on a daily extent) is not a stochastic process, instead, it is a non-stochastic process which can be predicted to considerably. Although this time behavior is a non-non-stochastic process, but it has many complications and it needs a network with many hidden neurons and layers. While increasing the number of hidden neurons and layer leads to higher precision of the network, however, this increase is limited and above that limit, the efficiency of network will be decreased.
Among the previously designed neural networks, the neural network with the feed forward cascade architecture and five input parameters, two hidden layer and 6 hidden node (with a 5-6-1 architecture), transfer function of tan-sigmoid in hidden layers and symmetric saturating function in the output layer, levenberg-marquardt training algorithm and weight learning function, delta bias with the validation check of 6, epoch=37,MSE=0.0154, R=0.9840 and RMSE=0.1261, is the best network modeled for predicting the total index of stock market.
At present, the best method to predict the price in Tehran stock market by investors and those who expect a profitable transaction (trade) in a short term period, are focusing on variations of past prices in the market.
REFERENCES
Amirihanzaki H. 1997. “Investigating the role of technical analysis in the analysis of stock”, MA thesis, Tehran management college, Iran.
Arab Mazar A. 2000. “General Economics Measure”, first edition, Kavir Publication, Tehran, Iran.
Banz R and Breen W. 1986. “Sample-Dependent Results Using Accounting and Market Data: Some Evidence”, Journal of Finance, No. 41, PP.779-793.
Capital Markets Consortium. High Frequency Trading: Market Structure, Technology and Regulation. 9 December 2009, New York.
Jahankhani A. 2010.”Investing effective factors in share price and a review of change trend in share price of Tehran stock market”, background, no.65, pp: 13-16.
Lotfiali 2009. “Technical indices”, First Edition, Term publication, Tehran, Iran.
Rao SK. 2007. Algorithmic Trading: Pros and Cons. Tata Consultancy Services. 2006 - 2007.