Comparative study of foF2 measurements with IRI-2007
model predictions during extended solar minimum
I.E. Zakharenkova
a,b,⇑, A. Krankowski
b, D. Bilitza
c,d, Iu.V. Cherniak
a,
I.I. Shagimuratov
a, R. Sieradzki
baWest Department of IZMIRAN, 41 Av. Pobeda, 236010 Kaliningrad, Russia bGeodynamics Research Laboratory, University of Warmia and Mazury, Olsztyn, Poland
c
NASA, Goddard Space Flight Center, Code 672, Greenbelt, MD, USA
d
George Mason University, Space Weather Laboratory, Fairfax, VA, USA
Available online 20 November 2011
Abstract
The unusually deep and extended solar minimum of cycle 23/24 made it very difficult to predict the solar indices 1 or 2 years into the future. Most of the predictions were proven wrong by the actual observed indices. IRI gets its solar, magnetic, and ionospheric indices from an indices file that is updated twice a year. In recent years, due to the unusual solar minimum, predictions had to be corrected downward with every new indices update. In this paper we analyse how much the uncertainties in the predictability of solar activity indi-ces affect the IRI outcome and how the IRI values calculated with predicted and observed indiindi-ces compared to the actual measurements. Monthly median values of F2 layer critical frequency (foF2) derived from the ionosonde measurements at the mid-latitude ionospheric station Juliusruh were compared with the International Reference Ionosphere (IRI-2007) model predictions. The analysis found that IRI provides reliable results that compare well with actual measurements, when the definite (observed and adjusted) indices of solar activity are used, while IRI values based on earlier predictions of these indices noticeably overestimated the measurements during the solar min-imum. One of the principal objectives of this paper is to direct attention of IRI users to update their solar activity indices files regularly. Use of an older index file can lead to serious IRI overestimations of F-region electron density during the recent extended solar minimum. Ó2011 COSPAR. Published by Elsevier Ltd. All rights reserved.
Keywords: Ionosphere; F2 region critical frequency; International Reference Ionosphere; Solar cycle dependence
1. Introduction
The solar minimum of cycle 23/24 began around March 2006 and many predictions of the start and size of solar cycle 24 were given thereafter (e.g. see review in Pesnell, 2008). In 2007, the solar cycle 24 Prediction Panel antici-pated that the solar minimum marking the onset of cycle 24 would occur in March 2008 (±6 months). This date
was then corrected to August 2008. In the next update, users were informed that the solar minimum would occur in December 2008 (http://www.swpc.noaa.gov/SolarCycle/ SC24/index.html). The minimum was in fact reached in the middle of 2009 and thus exceeded the earliest prediction by more than 2 years. This unusually deep and extended solar minimum makes corrections to the predicted values of solar cycle progression. With every update, the predicted values of sunspot numbers were decreased. Currently, the cycle continues to fall below predictions and is exhibiting 50% lower sunspot activity than predicted in May 2009.Fig. 1illustrates the changes in the predictions of the 12-month-running mean of the global ionospheric IG index (IG12). Indicated by a thick line is the definitive IG12
0273-1177/$36.00Ó2011 COSPAR. Published by Elsevier Ltd. All rights reserved. doi:10.1016/j.asr.2011.11.015
⇑Corresponding author at: West Department of IZMIRAN, 41 Av. Pobeda, 236010 Kaliningrad, Russia. Tel./fax: +7 4012 215606.
E-mail addresses:[email protected](I.E. Zakharenkova),kand@ uwm.edu.pl (A. Krankowski), [email protected], dbilitza@gmu. edu(D. Bilitza).
www.elsevier.com/locate/asr
Available online at www.sciencedirect.com
index from 1996 to 2010. The other lines show the IG12 indices predicted at several specific dates from January 2005 to February 2010. These curves show the continued downward correction of the IG12 index starting from 2007. The cycle 23/24 minimum went lower and lasted much longer than was expected so the predictions from 2007 to 2009 overestimated the actual (definitive) indices.
The empirical International Reference Ionosphere (IRI) model (Bilitza, 2001) is actively used in a great variety of applications and research projects (e.g.McNamara, 2002; Hernandez-Pajares et al., 2002; Bilitza et al., 2008; ISRIM; SWENETportal). The IRI describes the median or average values of electron density, electron content, electron tem-perature and the ion composition as a function of height, location, local time and sunspot number for magnetically quiet conditions. The model takes into account daily and seasonal variations as well as the impact of solar activity on ionospheric conditions. Therefore, the IRI model results depend on the input parameters of solar activity level and the use of uncertain predicted values can lead to significant discrepancies in the IRI model outcome. The objective of this paper was to analyze how much uncertainty in the pre-dictability of solar activity indices during this unusually deep and extended minimum of solar activity was able to affect the IRI outcome and how this variability compared to actual measurements.
2. Database
The data used for the present research were the monthly median values of the F2 layer critical frequencies (foF2) with 1 h temporal resolution. These monthly median values were calculated from the daily hourly values scaled from the ionograms recorded routinely by the DPS-4 digisonde at Juliusruh, Germany. The geographical coordinates of this mid-latitude ionospheric station are 54.6 N, 13.4 E. The ionograms were obtained from the European Digital Upper Atmosphere Server (DIAS). Since May 2005, the
DIAS server (http://www.iono.noa.gr/DIAS) has been delivering such products as real-time and archive ionograms from all DIAS ionosonde stations located in Europe, and frequency plots and maps of the ionosphere over Europe based on the foF2, M(3000)F2, MUF and electron density parameters (Belehaki et al., 2005). The selected time period coverage of the ionosonde data used (from January 2007 to December 2009) is corresponded to the period of the extended solar minimum.
In order to investigate the influence of prediction values of solar activity on the IRI-derived results, we used the IRI-2007 version of the model (Bilitza and Reinisch, 2008), whose FORTRAN code is available online (ftp:// nssdcftp.gsfc.nasa.gov/models/ionospheric/iri). The foF2 values were generated for each hour of the 15th (middle day) of each month of the years considered. These hourly values are taken to be representative of the ionospheric average behavior during that month. The foF2 STORM model option was turned off because this study deals with quiet geomagnetic conditions. The hourly averages obtained in this way were compared with the correspond-ing ones obtained from the observed foF2 values. For the input parameters of solar activity level, we used the monthly values of IG12 (a 12-month-running mean of the global ionosphere index). These values can either be found automatically from an indices file that is included with the IRI software package or the user can provide his/her own input values for this index. The file “ig_rz.dat”, which contains the IG12 and Rz12 (a 12-month-running mean of the sunspot number) indices for IRI model, is updated regularly with the most recent observed and predicted indices. This file starts from January 1958 and includes indices predictions for the upcoming two years. However, the final (actual) values of IG12 and Rz12 are only available at least 6 months after the fact because the 12-month running mean is cen-tered on the current date and needs therefore 6 months of predictions. For comparative analysis, we used the
1996 1997 1998 1999 2000 2001 2002 2003 2004 2005 2006 2007 2008 2009 2010 2011 2012 Years -20 0 20 40 60 80 100 120 140 160 IG 12 IG observed Jan 2005 Nov 2006 Nov 2007 Nov 2008 Apr 2009 Feb 2010
Fig. 1. Global ionospheric index IG12 for years 1996–2010 (solid curve) and IG12 predictions issued at various times from January 2005 to February 2010.
“ig_rz.dat” files issued in January 2005, November 2006, November 2007, November 2008, April 2009, May 2010 and February 2011.
3. Results and discussion
Fig. 2illustrates a comparison of the measured monthly median values of the critical frequency foF2 for local noon and midnight with IRI results derived with different pre-dicted/observed indices of solar activity level. Each graph contains a monthly median of measured foF2 values at the mid-latitude station Juliusruh (thick solid line) and for comparison the IRI results calculated with the use of actual (observed) IG12 values (thin solid line) and IRI
results calculated with the use of indices predicted 1– 2 years in advance (dotted lines with symbols). Actual (observed) IG12 values can be taken from any version of “ig_rz.dat” file, issued 9–12 months after the considered date, or from one of the latest versions of this file, e.g. February 2011.
The left panels of Fig. 2 show variations of midnight foF2 values for each month of 2007, 2008 and 2009. The first graph shows the observed and predicted behavior of foF2 for 2007. It clearly displays rather good agreement between observed variations and all IRI-derived predic-tions. It is interesting to note that IRI prediction based on indices issued in 2005 is very close to the IRI prediction based on the indices of 2007.Fig. 1shows that indeed the
1 2 3 4 5 6 7 8 9 10 11 12 Months 1 2 3 4 5 6 7 8 9 10 foF2, MHz Obs IRI (actual) IRI (pred 2007) IRI (pred 2006) IRI (pred 2005) YEAR: 2007 TIME: 00 LT 1 2 3 4 5 6 7 8 9 10 11 12 Months 1 2 3 4 5 6 7 8 9 10 foF2, MHz Obs IRI (actual) IRI (pred 2008) IRI (pred 2007) IRI (pred 2006) YEAR: 2008 TIME: 00 LT 1 2 3 4 5 6 7 8 9 10 11 12 Months 3 4 5 6 7 8 9 10 foF2, MHz YEAR: 2007 TIME: 12 LT 1 2 3 4 5 6 7 8 9 10 11 12 Months 3 4 5 6 7 8 9 10 foF2, MHz YEAR: 2008 TIME: 12 LT 1 2 3 4 5 6 7 8 9 10 11 12 Months 1 2 3 4 5 6 7 8 9 10 foF2, MHz Obs IRI (actual) IRI (pred 2009) IRI (pred 2008) IRI (pred 2007) IRI (pred 2006) YEAR: 2009 TIME: 00 LT 1 2 3 4 5 6 7 8 9 10 11 12 Months 3 4 5 6 7 8 9 10 11 12 foF2, MHz YEAR: 2009 TIME: 12 LT
Fig. 2. Comparison of the measured monthly median values of the critical frequency foF2 for local noon and midnight with IRI results derived with different predicted/observed indices of solar activity level.
indices predictions issued in 2005 and 2007 are very close, while the 2006 indices exceed both predictions. Compari-son of the results of IRI model calculations using actual (definitive) indices with foF2 observations shows that the IRI model underestimated the observations throughout practically all of 2007. IRI model gives a good fit to the observed foF2 values only during the summer months (May–August) and underestimates observations during the rest of the year.
The two other graphs of the left panels inFig. 2, corre-sponding to the years 2008 and 2009, demonstrate the changes in the predicted midnight foF2 values depending on the year-to-year corrected indices of solar activity. The IRI model prediction of foF2 values shows a tendency to decrease with each updating of the indices and getting closer to the measurements. While the earliest predictions mainly overestimate observed foF2 values, the final IRI result depending on the actual solar activity indices demon-strates an underestimation of the observed foF2 values.
For 2008, the IRI model calculations with actual indices compare rather well with foF2 observations during April– September months; for May and June the IRI model over-estimates observations, while for July and August the model gives results that are very close to the ionosonde measurements. The most pronounced underestimation is revealed during January–March and October–December.
For 2009, the IRI results depending on actual indices are practically identical with the observations during June– August and have lower values during January–May and September–December.
The right panel of Fig. 2 illustrates comparison of IRI predictions and observations of foF2 values corresponding to the local noon. The graphs clearly show how the IRI foF2 values became increasingly closer to the measure-ments as the predictions came closer to the actual (defini-tive) indices. The 2008 and 2009 graphs highlight the
significant discrepancies (overestimation) to the data that were introduced into IRI through the use of predicted IG12 indices issued in 2006 and 2007. A user who did not update his/her index file would therefore encounter a significant overestimation by IRI that is solely due to using the incorrect indices.
It is interesting that with an increase in solar activity level in the predicted indices, the results of the IRI model calculations showed a more pronounced effect of winter anomaly. The phenomenon of winter anomaly in the elec-tron density of the F2 region maximum appears in greater values in winter than in summer by day, but the anomaly disappears at night (Rishbeth and Garriott, 1969; Torr et al., 1980). The magnitude of the winter anomaly decreases along with decreasing solar activity (Torr and Torr, 1973).
For the IRI-derived values of noon foF2 (indicated by the thin line in all graphs), calculated with the use of actual IG12 indices, very good agreement was found with iono-sonde measurements during the summer – (April–Septem-ber 2007, April–August 2008 and June–August 2009). Comparatively good agreement was also observed during August–December 2008 and September–December 2009. For winter and spring months, the IRI model results based on actual solar activity indices underestimated the observed noon values.
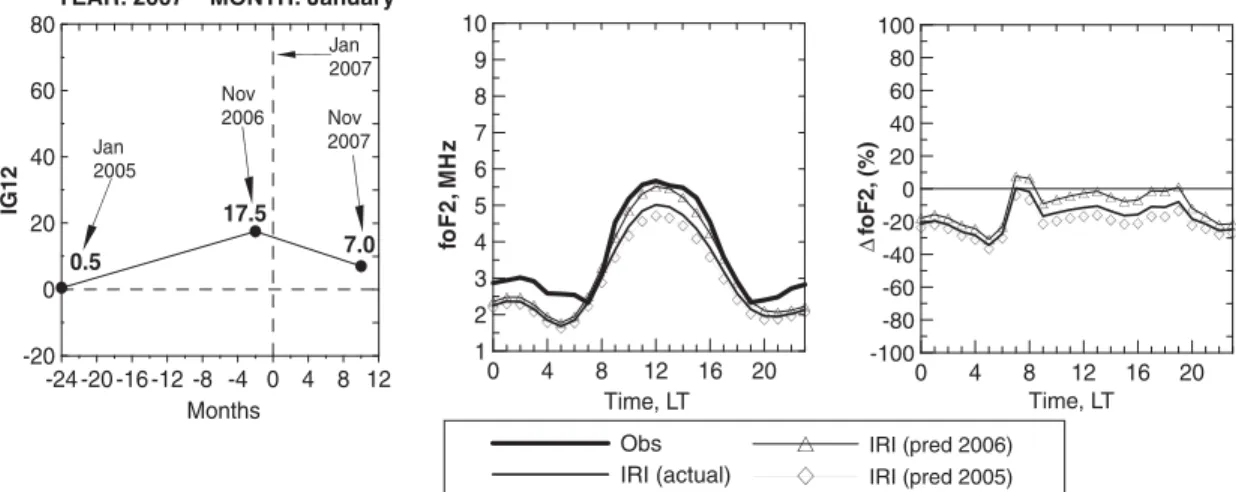
Fig. 3 presents a set of graphs with the results of our comparative analysis between observations and IRI predic-tions of daily variapredic-tions of foF2 corresponding to January 2007. This figure contains three graphs. The first graph illustrates the IG12 changes from predicted values to actual values. The vertical dotted line indicates the position of the considered date (i.e. January 2007); the number of months preceding and following this date is shown at the bottom axis. In the first graph, the horizontal dotted line shows the position of zero changes for the IG12 index. The black
0 4 8 12 16 20 Time, LT 1 2 3 4 5 6 7 8 9 10 foF2 , M H z Obs IRI (actual) IRI (pred 2006) IRI (pred 2005)
YEAR: 2007 MONTH: January
0 4 8 12 16 20 Time, LT -100 -80 -60 -40 -20 0 20 40 60 80 100 Δ foF2, (%) -24 -20 -16 -12 -8 -4 0 4 8 12 Months -20 0 20 40 60 80 IG12 0.5 17.5 7.0 Jan 2005 Nov 2006 Nov 2007 Jan 2007
Fig. 3. Comparison of the measured monthly median values of the critical frequency foF2 for 0-23 LT with IRI predictions corresponding to January 2007. The first graph illustrates the IG12 changes from predicted values to actual values. The second graph contains the monthly median of measured foF2 values (thick solid line) and the IRI results calculated with actual (observed) IG12 values (thin solid line) and IRI results calculated with indices predicted 1–2 years in advance (dotted lines with symbols). The third graph shows the percentage differences of the IRI-derived foF2 relative to the observed values.
dots in this graph display the position of prediction in time (months) and its value. The second graph contains the monthly median of measured foF2 values for the time of 0–23 LT at the mid-latitude station Juliusruh (thick solid line) as well as the IRI results calculated with the use of actual (definitive) IG12 values (thin solid line) and also IRI results calculated with indices predicted 1–2 years in advance (dotted lines with symbols). The third graph shows the percentage differences of IRI-derived foF2 relative to the observed values, i.e. DfoF2 (%). It is necessary at this
point to describe the main features of the graphs. For the given case of January 2007, we have two points with pre-dicted values: the first one was issued on January 2005 (i.e. a prediction 24 months ahead) and the second one on November 2006 (2 months ahead). On the right side of the vertical dotted line, there is one point corresponding to November 2007 (10 months after January 2007 and therefore including definitive indices for January 2007). One can trace the course of the indices’ changes over time. IG12 index changes from 0.5 (prediction of 24 months) and
0 4 8 12 16 20 Time, LT 1 2 3 4 5 6 7 8 9 10 foF2, MHz Obs IRI (actual) IRI (pred 2006) IRI (pred 2005)
YEAR: 2007 MONTH: January
0 4 8 12 16 20 Time, LT -100 -80 -60 -40 -20 0 20 40 60 80 100 Δ foF2, (%) -24 -20 -16 -12 -8 -4 0 4 8 12 Months -20 0 20 40 60 80 IG12 0.5 17.5 7.0 0 4 8 12 16 20 Time, LT 1 2 3 4 5 6 7 8 9 10 foF2, MHz Obs IRI (actual) IRI (pred 2007) IRI (pred 2006)
YEAR: 2008 MONTH: January
0 4 8 12 16 20 Time, LT -100 -80 -60 -40 -20 0 20 40 60 80 100 Δ foF2, (%) -24 -20 -16 -12 -8 -4 0 4 8 12 Months -20 0 20 40 60 80 IG12 35.8 18.0 -6.1 0 4 8 12 16 20 Time, LT 1 2 3 4 5 6 7 8 9 10 fo F 2 , M H z Obs IRI (actual) IRI (pred 2009) IRI (pred 2008) IRI (pred 2007)
YEAR: 2009 MONTH: January
0 4 8 12 16 20 Time, LT -100 -80 -60 -40 -20 0 20 40 60 80 100 Δ fo F 2 , ( % ) -24 -20 -16 -12 -8 -4 0 4 8 12 Months -20 0 20 40 60 80 IG12 62.7 15.5 -8.9 2.9
17.5 (prediction of 2 months) to the actual value of 7.0. These changes in indices led to the changes in foF2 daily variations shown in the second graph. Differences are seen mainly during the day. The dotted line with rhombuses shows foF2 values predicted 24 months ahead, the dotted line with triangles shows foF2 values predicted 2 months ahead and the thin solid line corresponds to the foF2 val-ues based on the actual indices. The third graph of Fig. 3
shows the deviation of these variations from the observed values of foF2. For the case of January 2007, all IRI-derived foF2 variations were in a close range and showed that the IRI model underestimated observations, especially
at night. In this case the differences due to incorrect predic-tions are small and within the day-to-day variability (15%). This is not always the case as we will see in the fol-lowing section.
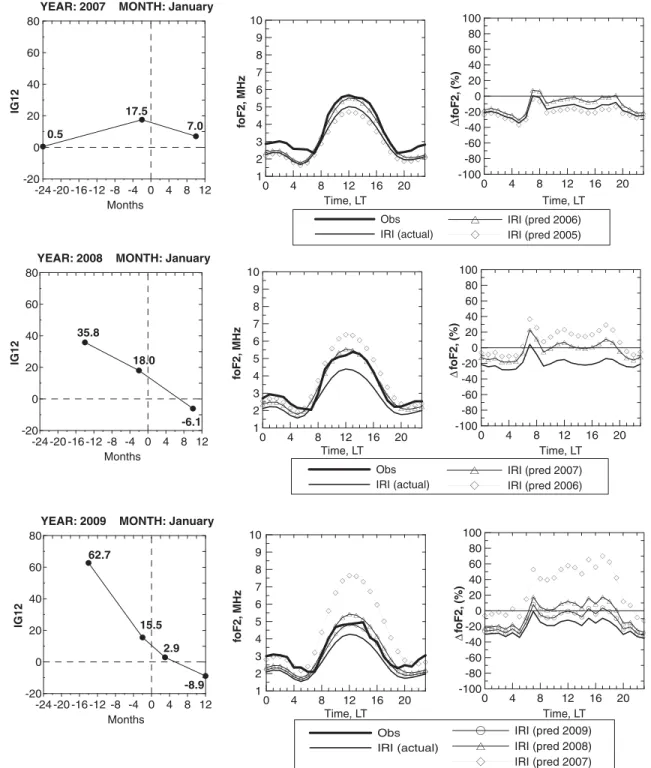
This example illustrates the approach of presenting the results of our comparative analysis using a combined set of graphs for different seasons and different years of the recent solar minimum.Fig. 4demonstrates the results of a comparison between observations and IRI predictions for the month of January in the years 2007, 2008, and 2009. Looking at the indices plots on the left we notice a distinct difference between 2007 and the minimum years 2008 and
0 4 8 12 16 20 Time, LT 1 2 3 4 5 6 7 8 9 10 foF2, MHz Obs IRI (actual) IRI (pred 2007) IRI (pred 2006) IRI (pred 2005)
YEAR: 2007 MONTH: April
0 4 8 12 16 20 Time, LT -100 -80 -60 -40 -20 0 20 40 60 80 100 Δ foF2, (%) -24 -16 -8 0 8 16 Months -20 0 20 40 60 80 IG12 1.9 23.7 4.3
YEAR: 2008 MONTH: April
-24 -16 -8 0 8 16 Months -20 0 20 40 60 80 IG12 40.7 26.4 -8.4 0 4 8 12 16 20 Time, LT 1 2 3 4 5 6 7 8 9 10 fo F 2 , M H z Obs IRI (actual) IRI (pred 2009) IRI (pred 2008) IRI (pred 2007)
YEAR: 2009 MONTH: April
0 4 8 12 16 20 Time, LT -100 -80 -60 -40 -20 0 20 40 60 80 100 Δ fo F 2 , ( % ) -24 -16 -8 0 8 16 Months -20 0 20 40 60 80 IG12 78.1 25.6 -8.3 13.5 6.7 -4.3 0 4 8 12 16 20 Time, LT 1 2 3 4 5 6 7 8 9 10 foF2, MHz Obs IRI (actual) IRI (pred 2008) IRI (pred 2007) IRI (pred 2006) 0 4 8 12 16 20 Time, LT -100 -80 -60 -40 -20 0 20 40 60 80 100 Δ foF2, (%)
2009. For 2007 the IG12 predictions were first corrected somewhat upward and than downward while for 2008 and 2009 there was a persistent and significant downward corrections from year to year indicating the unexpected solar behavior during this minimum. This descending ten-dency of indices corrections leads to the steady downward correction of IRI-derived results seen in the right part of
Fig. 4. The final version of IRI foF2 computed with the actual indices in fact underestimates the observations.
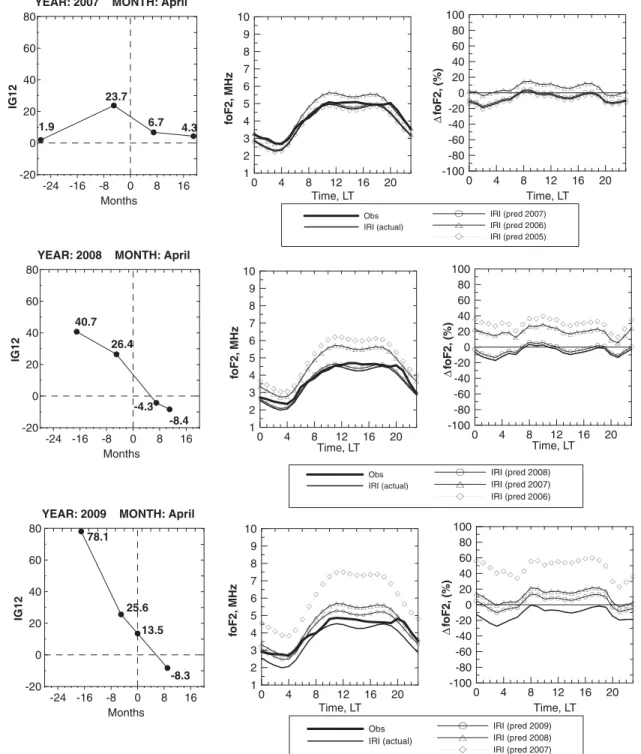
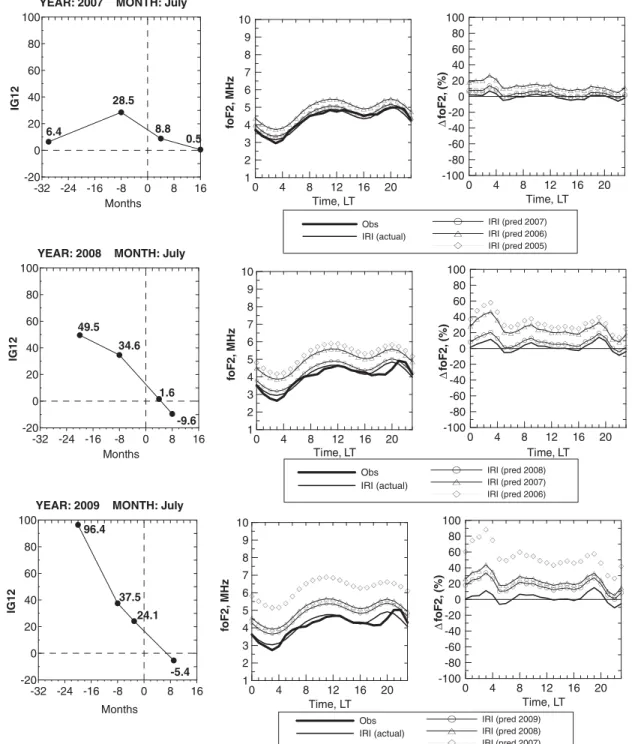
Figs. 5–7 illustrate similar results obtained for the months of April, July and October.
The dynamics of indices correction for April (Fig. 5), especially for April 2009, highlights the important uncer-tainties in the predictability of a new solar cycle. Both long-term and short term predictions give excessive values of indices for April 2008 and April 2009 in comparison to the definite indices Use of definite (actual) indices of solar activity in the IRI model provides results which are in very good agreement with observed values (April 2007 and April 2008). For the case of April 2009, IRI with actual indices produced underestimated values in comparison to the observations. 0 4 8 12 16 20 Time, LT 1 2 3 4 5 6 7 8 9 10 foF2, MHz Obs IRI (actual) IRI (pred 2007) IRI (pred 2006) IRI (pred 2005)
YEAR: 2007 MONTH: July
0 4 8 12 16 20 Time, LT -100 -80 -60 -40 -20 0 20 40 60 80 100 Δ foF2, (%) -32 -24 -16 -8 0 8 16 Months -20 0 20 40 60 80 100 IG12 6.4 28.5 0.5
YEAR: 2008 MONTH: July
-32 -24 -16 -8 0 8 16 Months -20 0 20 40 60 80 100 IG12 49.5 34.6 -9.6 0 4 8 12 16 20 Time, LT 1 2 3 4 5 6 7 8 9 10 fo F 2 , M H z Obs IRI (actual) IRI (pred 2009) IRI (pred 2008) IRI (pred 2007)
YEAR: 2009 MONTH: July
0 4 8 12 16 20 Time, LT -100 -80 -60 -40 -20 0 20 40 60 80 100 Δ fo F 2 , ( % ) -32 -24 -16 -8 0 8 16 Months -20 0 20 40 60 80 100 IG12 96.4 37.5 -5.4 24.1 8.8 1.6 0 4 8 12 16 20 Time, LT 1 2 3 4 5 6 7 8 9 10 foF2, MHz Obs IRI (actual) IRI (pred 2008) IRI (pred 2007) IRI (pred 2006) 0 4 8 12 16 20 Time, LT -100 -80 -60 -40 -20 0 20 40 60 80 100 Δ foF2, (%)
Fig. 6 shows the results for the month of July. As already mentioned forFig. 2, the IRI model (with the use of actual indices) gives a very good fit to the observed foF2 values for the summer months. For July 2007, all IRI predictions are close to the observed foF2 variations, both in magnitude and form. For July 2008 and July 2009 the pattern is the same as for the previous months, predictions get successively closer to the observations as the prediction issue date gets closer to the date when the observations were made.
Fig. 7demonstrates that for October 2009, prediction of the IG12 index was overestimated more than 100 times in comparison to the actual values. We see that this overesti-mation of the IG12 indices results in a factor of 2 (doubling) overestimation of foF2. We also note that for this month, the IRI model (with the use of actual indices) consistently underestimates the observation values for all three years.
To summarize, the analysis showed that IRI-derived results, calculated with use of actual IG12 indices, are close to, or slightly underestimate, the experimental values of
0 4 8 12 16 20 Time, LT 1 2 3 4 5 6 7 8 9 10 11 foF2, MHz Obs IRI (actual) IRI (pred 2007) IRI (pred 2006) IRI (pred 2005)
YEAR: 2007 MONTH: October
0 4 8 12 16 20 Time, LT -100 -80 -60 -40 -20 0 20 40 60 80 100 Δ foF2, (%) -32 -24 -16 -8 0 8 16 Months -20 0 20 40 60 80 100 120 IG12 14.9 32.2 -2.3
YEAR: 2008 MONTH: October
-32 -24 -16 -8 0 8 16 Months -20 0 20 40 60 80 100 120 IG12 51.6 47.0 -10.2 0 4 8 12 16 20 Time, LT 1 2 3 4 5 6 7 8 9 10 11 fo F 2 , M H z Obs IRI (actual) IRI (pred 2009) IRI (pred 2008) IRI (pred 2007)
YEAR: 2009 MONTH: October
0 4 8 12 16 20 Time, LT -100 -80 -60 -40 -20 0 20 40 60 80 100 Δ fo F 2 , ( % ) -32 -24 -16 -8 0 8 16 Months -20 0 20 40 60 80 100 120 IG 1 2 114.0 56.7 1.1 37.0 13.2 8.2 0 4 8 12 16 20 Time, LT 1 2 3 4 5 6 7 8 9 10 11 foF2, MHz Obs IRI (actual) IRI (pred 2009) IRI (pred 2008) IRI (pred 2007) IRI (pred 2006) 0 4 8 12 16 20 Time, LT -100 -80 -60 -40 -20 0 20 40 60 80 100 Δ foF2, (%) -3.7
foF2 measured at the mid-latitude ionospheric station Juliusruh. Using IRI with predicted indices results in signif-icant overestimations of the actual measurements during the recent solar minimum.
InFig. 8, the percentage deviation of IRI-2007 foF2 esti-mates from ionosonde measurements for local midnight and noon from 2007 to 2009 are presented. The thick solid line displays deviation of IRI-derived foF2 values calcu-lated with actual indices from corresponding Juliusruh observations. The thin line with crosses displays deviation between foF2 values, calculated with the use of indices issued 1–12 months prior to the interest point (a 1-year pre-diction) and corresponding Juliusruh observations. The thin line with rhombuses represents deviation between foF2 values, calculated with the use of indices issued more than 12 months prior to the interest point (a 2-year predic-tion) and corresponding Juliusruh observations. These graphs illustrate the impact of the applied indices (i.e. the quality of prediction of solar activity indices) on agreement with real observations. The first graph ofFig. 8represents results for local midnight. The deviations corresponding to
the foF2 values (based on actual indices) demonstrate a rather stable performance of the model with practically the same amplitude for each year within the 2007–2009 interval. In general, the model underestimated the midnight values of foF2 during winter and agreed well in summer. Deviations based on 1- and 2-year predictions show a ten-dency to increase towards the solar minimum. It is interest-ing to note the fact that for 2007, one can observe the very good agreement between deviations based on 2-year pre-diction and actual indices, this agreement is even better than for the result line based on 1-year prediction indices. For the case of 2009, it is clear that the use of long-term predictions (1- and 2-years in advance) results in overesti-mated values of foF2 predictions and excessive divergence in comparison with results based on actual indices.
The second graph of Fig. 8represents results for local noon. Deviations corresponding to the foF2 values based on actual indices are within 20% during the 2007–2009 interval. Again as in the case of the nighttime values the model underestimates (10%) observations in winter and shows good agreement in summer. As our results indicate,
Jan Apr Jul Oct Jan Apr Jul Oct Jan Apr Jul Oct -60 -40 -20 0 20 40 60 80 foF2 (%) 2007 2008 2009
Jan Apr Jul Oct Jan Apr Jul Oct Jan Apr Jul Oct -60 -40 -20 0 20 40 60 80 fo F2 (%)
actual prediction <1 year prediction >1 year
2007 2008 2009
00 LT
12 LT
there has been no dramatic change in IRI-derived esti-mates of foF2 during the recent solar minimum, if these estimates are based on the actual values of IG12 indices. The results based on 1-year and 2-year predictions of indi-ces display a tendency of increasing divergence between model results and observations with the year progressing towards the solar minimum and this trend is more clearly seen in the case of predictions more than a year ahead than with predictions less than a year ahead. It is impor-tant to note that predictions of IG12 indices were gener-ally well on the mark as the 2007 examples in Figs. 4–7
show, it is only with the highly unusually recent solar min-imum that predictions were significantly off and resulted in a factor of 2 and more overestimation of IRI-computed foF2 values.
4. Conclusion
This paper presents a comparison of foF2 values pre-dicted by the IRI-2007 model with observed values over a mid-latitude European station (Juliusruh) during the deep extended solar minimum of cycle 23/24. The analysis found that IRI-derived results, calculated with the use of actual IG12 indices, are close to, or somewhat underesti-mate, the experimental values of foF2. Using the IRI model with predicted indices gives an evident overestima-tion of the actual measurements that can reach a factor of 2 and more. It is important to note that a user should always use the latest indices file because the use of an ear-lier file with indices predictions of 1 or 2 years ahead could result in significant overestimation of F-region densities with the IRI model. This is particularly important during the recent solar minimum because predictions had to be corrected downward throughout the minimum period of 2007 to 2009.
Acknowledgments
We acknowledge the IRI Working group for providing and evaluating the IRI model FORTRAN code. The authors are grateful to the European Digital Upper Atmo-sphere Server (DIAS) for providing the ionosondes’ data.
DB acknowledges support through NASA Grant
NNX09AJ74G. References
Belehaki, A., Cander, Lj., Zolesi, B., et al. DIAS Project: The establish-ment of a European digital upper atmosphere server. J. Atmos. Sol.-Terr. Phys. 67 (12), 1092–1099, 2005.
Bilitza, D. International Reference Ionosphere 2000. Radio Sci. 36 (2), 261–275, doi:10.1029/2000RS002432, 2001.
Bilitza, D., Reinisch, B.W. International Reference Ionosphere 2007: improvements and new parameters. Adv. Space Res. 42 (4), 599–609, doi:10.1016/j.asr.2007.07.048, 2008.
Bilitza, D., Reinisch, B., Lastovicka, J. Progress in observation-based ionospheric modeling. Space Weather 6, S02002, doi:10.1029/ 2007SW000359, 2008.
Hernandez-Pajares, M., Juan, J.M., Sanz, J., Bilitza, D. Combining GPS measurements and IRI model values for space weather specification. Adv. Space Res. 29 (6), 949–958, 2002.
ISRIM (Incoherent Scatter Radar Ionospheric Model): http://www.mad-rigal.haystack.mit.edu/models.
McNamara, L.F. Prediction of total electron content using the Interna-tional Reference Ionosphere. Adv. Space Res. 4 (1), 25–50, doi:10.1016/0273-1177(84)90470-8, 2002.
Pesnell, W.D. Predictions of solar cycle 24. Solar Phys. 252, 209–220, doi:10.1007/s11207-008-9252-2, 2008.
Rishbeth, H., Garriott, O.K. Introduction to Ionospheric Physics. Academic Press, New York, 1969.
SWENET (Space Weather European Network) portal: http://www.esa-spaceweather.net/swenet.
Torr, D.G., Torr, M.R. The seasonal behavior of the F2 layer of the ionosphere. J. Atmos. Terr. Phys. 35, 2237–2251, 1973.
Torr, D.G., Torr, M.R., Richards, P.G. Causes of the F region winter anomaly. Geophys. Res. Lett. 7 (5), 301–304, 1980.