Research Article
1
The Influence of Noise Uncertainty and SNR Wall
on the Performance of Hybrid Sensing Method
M. Kustra
1,*, K. Kosmowski
1and M. Suchanski
11Military Communication Institute, Warszawska 22A St., 05-130 Zegrze, Poland
Abstract
The paper discusses the hybrid sensing method and presents the hybrid detector (HD) which improves the sensing performance. The proposed HD takes advantage of the energy detection (ED) and a method based on the Covariance Absolute Value (CAV) or Cyclic Autocorrelation Function (CAF). The paper characterizes the limitations of the use of ED resulting from the uncertainty of spectral density of noise power estimation known as ‘SNR Wall’. The paper describes the
system model and presents the simulation results for OFDM signal (Orthogonal Frequency Division Multiplexing) of WiMAX system. The simulation results refer to the ideal case of an environment with well-known parameters and for an environment with the uncertainty of spectral density of noise power estimation, as it has been considered in the literature so far.
*Corresponding author. Email: [email protected]
1. Introduction
Cognitive radio systems [1][2] are an effective solution to the problem of spectrum scarcity, mainly owing to Dynamic Spectrum Access (DSA) to bandwidths that are temporarily not used by primary users (PU). Sensing is one of the basic tasks of cognitive radio which must be carried out in order to enable communication. It relies on monitoring broad spectrum bands and detecting the channels not occupied by non-primary (unlicensed) users, which can be used by secondary users (SU).
The issue of sensing has been theoretically referred to many times. Numerous spectrum scanning techniques have been proposed for cognitive radio systems, which have both advantages and disadvantages. For this reason the literature dealing with the methods of spectrum sensing optimization in order to increase their efficiency proposes detectors with hybrid architecture, which combines advantages of various detection methods [3][4]. The structure of the hybrid sensing
model depends on the spectrum recognition scenario. An example of such a solution could be a two-phase system which uses ED in the first phase. Energy detection, as the simplest and fastest method of sensing, allows for reliable detection of strong signals, for which a relatively small number of samples allows to detect emissions. And in other cases, if the detected energy level does not allow for accurate estimation using the energy method, another more accurate method can be used.
ED [5] is characterized by low computational complexity and simple implementation. This method is a semi-blind detection which requires knowledge of spectral density of noise power for signal detection and as such, ED is sensitive to the uncertainty of its estimation [6][7]. For this reason, the second phase of HD uses a method that does not require this parameter. These methods most often use distinctive features which let us distinguish noise from modulated signals. However, they are usually more computationally complex or require a large number of samples to ensure proper detection reliability. Examples of methods that can
on Cognitive Communications
Keywords: Hybrid detector, sensing, SNR Wall, noise uncertainty, Covariance Absolute Value, Cyclic Autocorrelation Function, OFDM, WiMAX.
Received on 13 November 2017, accepted on 12 December 2017, published on 13 December 2017
Copyright © 2017M. Kustraet al., licensed to EAI. This is an open access article distributed under the terms of the Creative Commons Attribution licence (http://creativecommons.org/licenses/by/3.0/), which permits unlimited use, distribution and reproduction in any medium so long as the original work is properly cited.
doi: 10.4108/eai.13-12-2017.153474
2 be used in the second HD phase are matched filter, cyclostationary features detector, eigenvalue-based sensing detector, wavelet-based sensing detector or covariance-based detector.
In the literature [8][9] the results of HD research show the superiority of the hybrid method over others. However, these publications refer to an ideal situation in which the uncertainty of spectral density of noise power estimation is not taken into account. In real systems it is not possible to accurately estimate noise variance, which results in restrictions on the use of ED. Each measurement of physical value is characterized by finite accuracy and as a result, it is burdened with uncertainty. In the case of ED, this uncertainty in relation to the measurement of the spectral density of noise power is revealed as the so-called ‘SNR Wall’ [10].
When the noise is burdened with uncertainty, the current approach presented in the literature is too idealistic. For this reason, the paper presents an analysis of HD efficiency in an environment with uncertainty associated with the spectral density of noise power estimation. In the paper there is a description of two hybrid sensing methods (HDCAV and HDCAF) using ED and CAV or ED and CAF, respectively. A system model for which simulations have been carried out is characterized. Next the results of the study for WiMAX system are presented for two cases: the ideal case of an environment with well-known parameters, as considered in the literature so far, and for an environment with the uncertainty of spectral density of noise power estimation. The results obtained indicate that the optimization of the scenario by introducing the uncertainty of spectral power density estimation leads to significant deterioration of the results, but still allows us to achieve better HD detection properties in relation to other methods.
2. Hybrid Detector
The proposed HD is a two-phase detector taking advantage of both detection methods: ED and CAV. The scheme of the detector is shown in Fig. 1.
For each channel, the presence of PU is firstly determined in the first detection phase in which ED is used. Although this method is sensitive to the uncertainty of noise, its undoubted advantage is the speed of detection and accuracy at high SNR values. Therefore, the decision about PU signal
Figure 1. Scheme of the hybrid detector
presence will be taken only in unquestionable situations – the energy of the received signal (T1st = TED) will be higher
than the first phase detection threshold (λ1st = λED) calculated
for the assumed probability of a false alarm (Pfa).
When the decision cannot be made using ED, the second phase of hybrid detection is a more accurate method: CAV or CAF. Depending on the detector (CAV or CAF) used in the second sensing phase, as in the first phase, the decision about PU signal presence is taken when decision statistic (T2nd) is greater than the second phase threshold (λ2nd).
Otherwise, a decision about PU signal absence is made. Depending on the used detector in the second phase(CAV or CAF), the above expressions will be T2nd = TCAV and λ2nd = λCAV or T2nd = TCAF and λ2nd = λCAF, respectively.
2.1. ED
The decision statistic for the energy detector can be expressed by [5][11]:
1
0 2 ) ( 1 Ns
n s
ED y n
N
T
where: y(n) – the received signal; Ns – number of signal samples.
The detection threshold for the assumed constant Pfa
value is expressed as follows:
ED
Q Pfa NS NS
2 ) ( 1 2
where: ση2 – noise variance; Q(t) – Q function given by:
.
2 1 )
( 2
2
t u
du e t
Q
The equation (2) can be used in the case of an ideal environment, for which it is possible to estimate the noise variance with as high accuracy as desired. In real systems, this condition is impossible to fulfill. Therefore, it is needed to take into account the uncertainty associated with the actual value of parameters [10] assuming that the actual variance of noise is within the uncertainty interval:
2 1 2, 2 , 1,
where: ση2 – nominal noise variance; – parameter that
quantifies the size of the uncertainty.
Considering the uncertainty associated with spectral density of noise power measurement, the detection threshold takes the form of:
ED
Q Pfa NSNS
2 ) ( 1 2
3
Equation (6) specifies the time (number of samples) necessary to obtain the result of the channel state corresponding with the assumed probability values [10]:
. ) 1 ( )] 1 ( ) ( [ 2 2 2 1 1 SNR P Q P Q
N f m
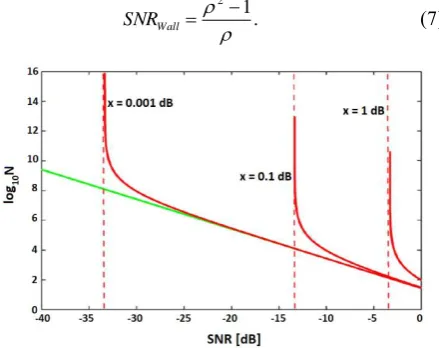
Equation (6) shows that the number of samples tends to infinity when the decreasing SNR reaches the value comparable to the area of approximated spectral density of noise power uncertainty. 0Figure 2 shows the number of samples needed to obtain the assumed probabilities in the SNR function. Depending on the accuracy of the spectral density of noise power estimation expressed as uncertainty (x10log10), the ‘SNR Wall’ level is achieved at lower
SNRs, but as the limit approaches, the number of samples necessary to maintain the required credibility increases rapidly.
The detector cannot make a reliable decision if the signal power level is lower than the uncertainty associated with the spectral density of noise power measurement. ‘SNR Wall’ in
the function of uncertainty expressed by (7) is shown in Fig. 3.
1.
2 Wall
SNR
Figure 2. Number of samples in SNR function
depending on the spectral density of noise power uncertainty estimation
Figure 3. ‘SNR Wall’ in a noise uncertainty function
2.2. CAV
CAV uses the differences between autocorrelation of noise and signal. Autocorrelation of received signal is [12]:
() 1 ( )* ( ), 0,1... 1,
1 0
L l l n y n y N l s N n s where Ns – number of signal samples; L – smoothing factor.
The statistical covariance matrices Rx of the whole signal
and noise can be estimated using a matrix Rˆ formed for x L
consecutive signal samples:
. ) 0 ( ) 2 ( ) 1 ( ) 2 ( ) 0 ( ) 1 ( ) 1 ( ) 1 ( ) 0 ( ) ( ˆ L L L L N Rx s
This matrix is symmetric and Toeplitz. Based on symmetric property of autocorrelation matrix, two ratios T1
and T2 are expressed as follows:
1 ,
1 1 1
L n L m nm r LT
1 ,
1 2
L n nn r LT
where: rnm and rnn are elements of Rˆ matrix.x
The decision statistic for CAV is expressed as:
.
2 1
T T
TCAV
The detection threshold (λCAV) is calculated as:
1
1
2 1
2 .1 1 s fa s CAV N P Q N L
2.3. CAF
According to [13], the complex x(t) process with the average zero value is cyclostationary in a wide sense, if its autocorrelation function (varying in time domain) is periodic with repetition period Tf and can be represented as a Fourier
series:
(
,
)
(
)
2.
j txx
xx
t
R
e
R
Values are added by integral multiplies of the basic frequency α = k/Tf, k = 1,2,3.... The Fourier series
coefficients depending on the time lag have the following form:
4
(
)
lim
1
(
)
.
2 / 2 / 2
T T t j xx Txx
R
e
dt
T
R
The function Rxx() is called the cyclic autocorrelation function (CAF) [14], and the Fourier transform of the cyclic autocorrelation function:
S
xx(
f
)
R
xx(
)
e
j2fd
is called the spectral correlation density function.
According to the relations above, CAF functions are discrete functions in terms of frequency – equation (14) and continuous functions in terms of time lag – equation (15).
For non-cyclostationary processes, CAFs: 0
) (
xx
R ,0. Each non-zero value of the
parameter, where Rxx()0 is called the cyclic frequency. CAF for the OFDM signal has the following form [15]:
df f G f G e e f f N T A R n f j N f f j s s xx n s ) ( ) ( sin sin 2 2 1 2 0 where G(f) is the Fourier transform of a rectangular pulse shape, A – variance of symbol sequence, Ts=Tu+Tg – symbol
duration, Tu = 1/Δf – useful symbol duration, Δf – subcarrier
spacing and Tg – guard interval duration.
The detection threshold (λCAF) is calculated as:
(1 )).
2 1
( fa_CAF
CAV tg P
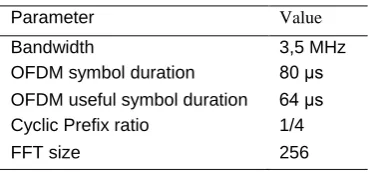
3. System Model
The requirements that the cognitive radio must fulfill in sensing of the primary user’s signals are strictly connected with the cognitive system scenario. In the paper as a licensed system, the WiMAX (IEEE 802.16-2004 [16]) system was assumed with the parameters specified in Table 1. The following detection parameters were also assumed:
• probability of a detection Pd = 0,9;
• probability of a false alarm Pfa = 0,1;
• uncertainty associated with spectral density of noise power estimation x = ± 1 dB.
For the second phase of HD using the CAF, a detection of a single CAF peak is proposed (0 and
Tu). In this regard it is similar to [17], with the difference that other decision statistic have been proposed.Table 1. Parameters of the licensed system
Parameter Value
Bandwidth 3,5 MHz
OFDM symbol duration 80 µs OFDM useful symbol duration 64 µs Cyclic Prefix ratio 1/4
FFT size 256
The decision statistics for proposed CAF is:
y x CAF R R
T
where: Rx – empirical CAF of the OFDM signal,
y R –
empirical CAF of noise. TCAF test is a simple ratio test
between Rx and Ry evaluated for 0 and Tu. The
test compares characteristic points of CAF for OFDM signals and noise.
The question that remains open is how to acquire noise samples for the test. One of the solutions proposed in the literature is to take data from a very rarely used channel. Such an example is the American channel 37 reserved for radio astronomy. Another proposal is to use samples from the tested channel on the basis of which the previous decision was made that the channel does not emit PU signals.
4. Simulation Results
The purpose of the simulations was to check the efficiency of HDCAV and HDCAF in comparison to other available
techniques (ED, CAV, CAF). According to the theoretical assumptions, the utilization of HD should significantly increase the reliability of sensing. However, the insertion of the uncertainty of noise variance into the scenario should significantly worsen the results. For this reason, the proposed hybrid detectors were first tested for the ideal case, i.e. in an environment that did not take into account the uncertainty of spectral density of noise power estimation and then the tests were repeated for an environment with such uncertainty.
In order to determine the dependence of Pd on the SNR
with the assumed number of samples, the probability of a false alarm was set at 10% (Pfa = 0,1).
0Figure 4 and Fig. 5 show the comparison of HDCAV and HDCAF (resp.) performance with the methods used for them for a varying number of OFDM signal symbols (N) depending on SNR values for the ideal case. It can be easily concluded that HD is characterized by better detection parameters than other methods. For HD, the assumed
Pd = 0,9 is reached at lower SNR values than for the other
methods.
Error! Reference source not found.
5
Figure 4. The probability of detection in a SNR
function for HDCAV (without uncertainty of spectral
density of noise power estimation influence)
Figure 5. The probability of detection in a SNR
function for HDCAF (without uncertainty of spectral
density of noise power estimation influence)
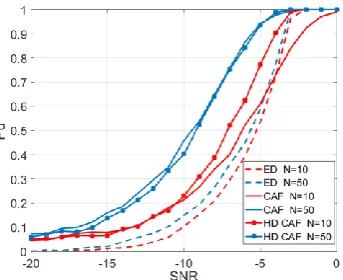
Figure 6 and Fig. 7 show the same comparison as in Fig. 4 and Fig. 5 but with uncertainty of noise variance. In this situation the results are considerably worse. The uncertainty of noise variance leads to significant deterioration of the HD detection performance. It can be seen that the biggest gain from the use of HD is achieved for short signals. So the longer the signal, the more dependent the HD performance becomes on the method used in the second phase of detection or even worse, as in the case of the HDCAF.
Figure 6. The probability of detection in a SNR
function for HDCAV (with uncertainty of spectral density
of noise power estimation influence)
Figure 7. The probability of detection in a SNR
function for HDCAF (with uncertainty of spectral density
of noise power estimation influence)
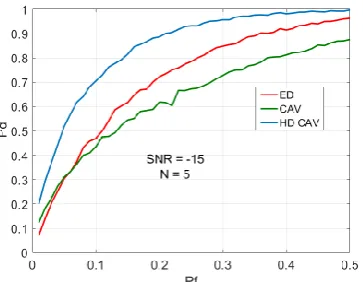
In order to compare the detectors under consideration, the ROC (Receiver Operating Characteristic) curves were determined (Fig. 8, Fig. 9, Fig. 10, Fig. 11).
It can be noticed that for the ideal case HDCAV and HDCAF (Fig. 8, Fig. 9 – resp.) are characterized by significantly better parameters than the other detectors. According to the theoretical assumptions, the introduction of HD (by minimizing Pfa) increases the reliability of sensing.
Figure 8. The ROC curves for HDCAV (without
uncertainty of spectral density of noise power estimation influence)
Figure 9. The ROC curves for HDCAF (without
uncertainty of spectral density of noise power estimation influence)
6 Figure 10 and Fig. 11 show the ROC curves taking into account the uncertainty of the noise variance effect. In this case the results are also much worse. In the ideal case (0Fig. 8, Fig. 9), the detection threshold for ED (
ED) was calculated from the equation (2), which did not account for the uncertainty of the noise variance. That is why the results show HD superiority over others. However, by analyzing the ROC curves after taking into account the uncertainty, it can be seen that ED and ‘SNR Wall’ have great impact onthe HD reliability.
Figure 10. The ROC curves for HDCAV (with
uncertainty of spectral density of noise power estimation influence)
Figure 11. The ROC curves for HDCAF (with
uncertainty of spectral density of noise power estimation influence)
5. Conclusions
The paper has presented a hybrid sensing technique and described HDCAV and HDCAF using ED and CAV or CAF,
respectively. In the first phase, the signal is detected via ED, which allows for a quick detection of strong signals, but it depends on the uncertainty of spectral density of noise power estimation. In other cases, when the detected energy level does not allow for making an unquestionable decision about the presence or absence of PU on the channel, the CAV or CAF method is utilized.
Then, the results of simulations of the proposed HDCAV and HDCAF for the OFDM signal of the WiMAX system have been presented. First, the simulations were conducted for the ideal case, that is in an environment that did not take into account the uncertainty of noise variance, and then they were repeated for the environment with such uncertainty.
In the ideal situation, for which some research results have been presented in the literature, the hybrid detection method is characterized by better detection performance than other methods. However, the results obtained indicate that the optimization of the scenario by the introduction of the uncertainty of spectral power density estimation and incorporating the effect of ‘SNR Wall’ leads to significant deterioration of the results, but still allows us to achieve better HD detection properties in relation to other methods. In this case, the highest gain of HD performance is achieved for short signals, which is important in the context of works on reducing the sensing time.
References
[1] Federal Communications Commission (2003) Notice of proposed rulemaking and order, Facilitating opportunities for flexible, efficient and reliable spectrum use employing cognitive radio technologies. FCC 03-322.
[2] Kapoor S., Singh G. (2011) Non-cooperative spectrum sensing: A hybrid model approach. 2011 International Conference on Device and Communications (ICDeCom), India.
[3] Bogucka H. (2013) Technologie Radia Kognitywnego. PWN, Warsaw, Poland.
[4] Haykin S., Thomson D. J., Reed J. (2009) Spectrum sensing for cognitive radio. Proc. IEEE, 97: 849 -877.
[5] Urkowitz H. (1867) Energy detection of unknown deterministic signals. Proc. IEEE, 55: 523–531, 1967. [6] Cabric D., Tkachenko A., Brodersen R. (2006) Experimental
study of spectrum sensing based on energy detection and network cooperation. Proc. of the ACM International Workshop on Technology and Policy for Accessing Spectrum, Boston, USA.
[7] Sahai A., Cabric D. (2005) Spectrum sensing: fundamental limits and practical challenges. Proc. of the IEEE International Symposium on New Frontiers in Dynamic Spectrum Access Networks (DySPAN), Baltimore, 546-551. [8] Geethu S., Lakshminarayanan G. (2013) A Novel Selection
Based Hybrid Spectrum Sensing Technique for Cognitive Radios. 2013 IEEE International Conference on Emerging Trends in Computing, Communication and Nanotechnology (ICECCN 2013), India.
[9] Simunic D., Dhope T. S. (2012) Hybrid Detection Method for Spectrum Sensing in Cognitive Radio, MIPRO 2012, Opatija, Croatia.
[10] Tandra R. and Sahai A. (2008) SNR Wall for Signal Detection. IEEE Journal of Selected Topics In Signal Processing, 2(1): 4 – 17.
[11] Zeng Y., Liang Y.-Ch., Hoang A T., Zhang R. (2010) Review on spectrum Sensing for cognitive radio: Challenges and Solutions. EURASIP Journal on Advances in Signal Processing, 1-15.
[12] Zeng Y., Liang Y.-Ch. (2007) Covariance based signal detections for cognitive radio. DYSPAN07, Dublin, 202-207.
7 [13] Öner M., Jondral F. (2007) Air interface identification for
Software Radio systems. Int. J. Electron. Commun. (AEÜ).
61: 104 – 117.
[14] Gardner W. (1987) Statistical spectral analysis: a nonprobabilistic theory. NJ: Prentice Hall.
[15] Goo L. P. (2007) Detectors for Cognitive Radio. Master Thesis, National University of Singapore, Singapore. [16] http://ieee802.org/16/pubs/80216-2004.html
[17] Ye Z., Memik G., Grosspietsch J. (2008) Energy detection using estimated noise variance for spectrum sensing in cognitive radio networks. Proc. IEEE wireless communications and networking Conf. (WCNC), Nevada, USA, April 711-716.