A Cascade-Classifier Approach for Fall Detection
I Putu Edy Suardiyana
Putra
Cogent Labs Coventry University Coventry, United Kingdom
[email protected]
James Brusey
Cogent Labs Coventry University Coventry, United Kingdom
[email protected]
Elena Gaura
Cogent Labs Coventry University Coventry, United Kingdom
[email protected]
ABSTRACT
The current machine learning algorithms in fall detection, especially those that use a sliding window, have a high com-putational cost because they need to compute the features from almost all samples. This computation causes energy drain and means that the associated wearable devices re-quire frequent recharging, making them less usable. This study proposes a cascade approach that reduces the compu-tational cost of the fall detection classifier. To examine this approach, accelerometer data from 48 subjects performing a combination of falls and ordinary behaviour is used to train 3 types of classifier (J48 Decision Tree, Logistic Regression, and Multilayer Perceptron). The results show that the cas-cade approach significantly reduces the computational cost both for learning the classifier and executing it once learnt. Furthermore, the Multilayer Perceptron achieves the high-est performance with precision of 93.5%, recall of 94.2%, and f-measure of 93.5%.
Categories and Subject Descriptors
J.3 [Computer Applications]: Life and Medical Sciences—
health, medical information system
General Terms
Algorithms, Design, Experimentation, Performance
Keywords
Fall detection, Machine Learning, Cascade classifier, Com-putational cost
1.
INTRODUCTION
Falls are one of the major leading causes of injury-related death and they are the main cause of disability and death for people aged over 65 in the UK [2]. Complications such as hypothermia or pneumonia can become a long term negative effect of falls [8]. Although fall detection cannot prevent falls, it may alleviate or reduce complications by going some way to ensure that fall victims receive help quickly.
Most of the current fall detection techniques use threshold based algorithms because of the efficiency of this technique. However, this produces a high number of false alarms be-cause some activities (such as sitting down quickly, walking down the stairs, or lying on the bed) produce an acceleration as high as fall events [20].
Machine learning based algorithms have become popular in recent time because they are able to construct a classifier that can detect falls effectively. Research has shown that machine learning approaches are able to distinguish fall and non-fall activities with a high accuracy [7, 6, 18]. However, the disadvantage of machine learning based algorithms is that they need to extract the features from a sliding window that can cause a high computational cost issue. This issue makes them difficult to implement in wearable sensors that have limited resources.
To overcome the computational cost issue, we propose a cascade-classifier approach that has lower computational cost and better accuracy than a sliding window based machine
learning algorithm. We tested our approach on a large
dataset that contains various types of Activities of Daily Living (ADLs) and simulated falls from 48 healthy subjects between 18–51 years old [17]. J48 Decision Tree, Logistic Regression and Multilayer Perceptron were chosen to test our approach.
The rest of the paper is organised as follows. Section II presents related work in fall detection. The dataset that used in this research is described in Section III. Our ap-proach is explained in Section IV. Section V discusses the results and Section VI gives conclusions as well as prospec-tive future work.
2.
RELATED WORK
Igual et al. [11] identifies two categories of fall detectors: context-aware systems and wearable devices. Context-aware systems use cameras, infrared, or floor sensors while the wearable devices are worn on the subject (such as a pen-dant, watch or belt). According to Gjoreski et al. [9], the context-aware systems face several challenges such as the sensors placement, flexibility, user privacy, and the price of the sensors. Therefore, the wearable devices may be a better alternative as they are inexpensive and small. Accelerometer and gyroscope sensors are the most common sensors in wear-able fall detectors. Within such systems, there are generally two types of algorithm used: threshold-based and machine
MOBIHEALTH 2015, October 14-16, London, Great Britain Copyright © 2015 ICST
learning-based [11]. Threshold-based algorithms use a pre-defined value as a threshold to detect a fall [4, 14, 21]. Ma-chine learning-based approaches use a supervised maMa-chine learning tool, such as a Support Vector Machine (SVM), Decision Tree, or Artificial Neural Network, to learn a clas-sifierthat can recognise a fall, based on either the raw sensor measurement or somefeature that has been computed from the raw measurement [6, 7, 15, 18].
Although the threshold-based algorithms have a low com-putational cost, implementing them in real-world cases is a difficult task because the thresholds are usually configured based on simulated fall signals [3]. This makes them inap-propriate for real-world falls. Therefore, machine learning based algorithms are a better alternative as they can be trained using simulated fall signals to get a general pattern of falls. However, these approaches incur a high computa-tional cost because of feature calculation.
Kau and Chen [13] proposed a cascade-classifier approach with Support Vector Machine (SVM) classifier as a fall de-tector on the smartphone. Their study shows that their approach increases the efficiency of the machine learning al-gorithm for fall detection by reducing the number of fea-ture calculations. Their approach used an accelerometer and a gyroscope that are embedded in a smartphone plat-form. Based on Abbate et al.[1], the problem with using a smartphone as a fall detector is users needs to carry their smartphone in a fixed position. In most cases, they prefer to have a small and non-invasive sensor so they can put their smartphone wherever they want. Therefore, this study fo-cused on developing an approach that can learn patterns of falls from small and non-invasive wearable sensors.
3.
DATASET
A large dataset from Ojetola et al. [17] was used in this study. The data were gathered from 48 (9 females and 39 males) healthy subjects where each of them was required to simulate 14 falls (forward-fall, backward-fall, lateral fall) and several ADLs for 23 minutes on average. A more detailed information regarding the protocol is described on Ojetola et al. [17].
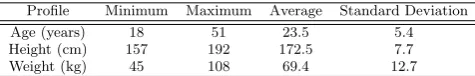
Table 1 shows the profile of the subjects. The data were gathered from sensors that were strapped to the chest, wrist, and thigh of each subject. Some subjects also have data that were gathered from a sensor that was strapped to waist. In this study, we used only the chest sensor data because the chest is the best place to place a sensor for posture recogni-tion [9].
Shimmer sensors with a sampling rate of 100 Hz were used as data collectors. The sensor consists of 3D accelerometer, 3D gyroscope, a Bluetooth device, and MSP430F1611 micro-controller device. The data were transferred to a Personal Computer (PC) using a Bluetooth device and they were an-notated with a LabView program. Figure 1 shows the falls and some ADLs of this dataset.
4.
THE CASCADE-CLASSIFIER APPROACH
4.1
The Micro-annotation Approach
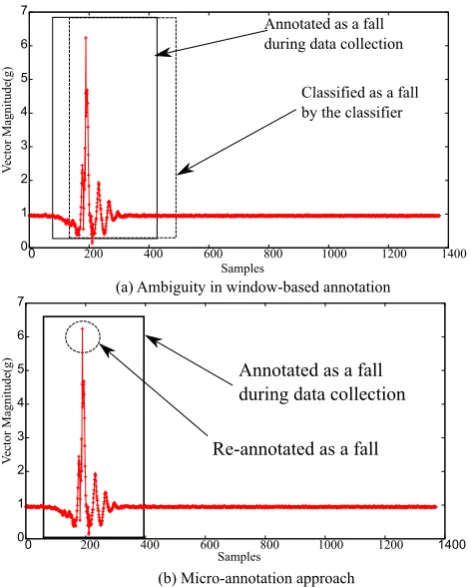
In the window-based approach, the output of the classifier is often misalign with the data segment that is annotated
Table 1: Subject body profile summary
Profile Minimum Maximum Average Standard Deviation
Age (years) 18 51 23.5 5.4
Height (cm) 157 192 172.5 7.7 Weight (kg) 45 108 69.4 12.7
as a fall. It produces an ambiguity especially in the train-ing and testtrain-ing phases of the machine learntrain-ing algorithm. Ojetola [16] proposed a micro-annotation approach to solve this problem. This approach re-annotates only one sample as a fall in each fall event segment. In our experiment, we adopted this approach to train and test our cascade-classifier approach. The illustrations of both the ambiguity of win-dow based approach and the micro-annotation approach are shown in Figure 2.
4.2
Features
In calculating the features, three stages were used: pre-impact, impact and post-impact. These three stages are useful to capture the fall history of the subject [16]. The lengths of pre-impact, impact, and post-impact are 1 sec-ond, 6 seconds, and 9 seconds. The length of the windows were chosen based on [16]. The following subsections ex-plain the features that were used in our approach for their respective stages.
4.2.1
Active State (
Act state)
This feature was extracted based on the vector magnitude of three-axis acceleration outputs. Based on Abbate et al.[1], people in an inactive state (e.g sitting or standing) produce an acceleration vector magnitude approximately 1.0 g while they produce above 1.5 g in active state. In this study we used 1.6 g as threshold and the active state was calculated using a non-overlapped 2 seconds sliding window [16].
4.2.2
Minimum Acceleration (
M in)
The minimum vector magnitude of acceleration over 1 sec-ond window was calculated. Based on Kangas et al. [1], the minimum value of vector magnitude was nearly 0.0g in a pre-impact fall event.
4.2.3
Maximum Acceleration (
M ax)
The maximum vector magnitude of acceleration over 1 sec-ond overlapping window was calculated. It overlapped by 50% from the Minimum Value feature window. This feature was used to detect the highest peak of the vector magnitude of the acceleration when the fall impact phase happened [1].
4.2.4
Mean
Based on Ojetola [16], the mean acceleration is higher in pre-impact and pre-impact stages than the post pre-impact. Therefore this feature is calculated for those three stages.
4.2.5
Velocity
We used this feature because the velocity value from fall events tends to be higher than static activities [4]. This feature was calculated for the three stages. The equation to calculate this feature is:
V = ˆ
Standing & Making a Call Falling Forward Lying on The Bed Sitting on The Bed Sitting on The Chair
Falling Backward Near Fall Walking and
Making a Call Crouching
Fall in Right Direction
Fall in
Left Direction Pushed to Fall Forward Pushed to Fall Backward
Figure 1: Activities of Daily Living (ADLs) and simulated fall illustration[16]
whereVmis the acceleration vector magnitude.
4.2.6
Energy Expenditure (
Energy)
The energy expenditure was calculated for the three stages [16]. The energy expenditure was calculated using:
E= ˆ
a2xdt+ ˆ
a2ydt+ ˆ
a2zdt, (2)
where ax,ay, and az are the outputs of the accelerometer on x-axis, y-axis, and z-axis respectively.
4.2.7
Variance
The variance of accelerometer vector magnitude was calcu-lated for the three stages [5, 16].
4.2.8
Root Mean Square (RMS)
The RMS of the acceleration signal was also calculated for the pre-impact, impact, and post-impact stages. RMS has previously been used in research for fall detection [4, 9].
4.2.9
Exponential Moving Average (EMA)
The EMA value of vector magnitude was calculated from the three stages as feature values [5]. EMA is calculated as:
st=αVm+ (1−α)st−1, (3)
where st is the EMA value at time t , is the smoothing factor, andVmis the vector magnitude of acceleration.
4.2.10
Signal Magnitude Area (SMA)
The SMA is useful to distinguish human activities [12]. It was calculated using:
γ=1
t
t ˆ
0
|ax|dt+ t ˆ
0
|ay|dt+ t ˆ
0 |az|dt
, (4)
Table 2: Fall stages and their extracted features
Pre-impact Impact Post-impact
Mean Mean Mean
Velocity Velocity Velocity
Energy Expenditure Energy Expenditure Energy Expenditure
Variance Variance Variance
Root Mean Square Root Mean Square Root Mean Square Exponential Moving Average Exponential Moving Average Exponential Moving Average
Signal Magnitude Area Signal Magnitude Area Signal Magnitude Area Minimum Acceleration Maximum Acceleration
whereγ is the SMA value andais the accelerometer value fromx,y, andzaxis.
The stages and their respective features are shown in Table 2.
4.3
The Cascade-Classifier Approach
The key aspect of the cascade-classifier approach is the use of a threshold to trigger the feature calculation process. In this way, the cascade-classifier approach prevents the system performing the features calculation for all samples. Our pro-posed cascade-classifier approach is shown in Algorithm 1.
Algorithm 1Cascade-classifier approach
1: whilestopping conditionis Falsedo
2: Act samples←acceleration vector magnitude (Vm) 3: Act state←Check act(Act Samples)
4: if Act state is Truethen
5: pre impact←1 second window samples 6: imp post←11 seconds window samples
7: instance←Feature Calc(pre impact,imp post)
8: end if
9: returninstance
10: end while
(a) Ambiguity in window-based annotation
(b) Micro-annotation approach Annotated as a fall during data collection
Classified as a fall by the classifier
Re-annotated as a fall Annotated as a fall during data collection
0 1 2 3 4 5 6 7
0 200 400 600 800 1000 1200 1400
V
ector Magnitude
(g)
Samples
0 1 2 3 4 5 6 7
0 200 400 600 800 1000 1200 1400
V
ector Magnitude
(g)
Samples
Figure 2: (a) Ambiguity in sliding window based approach; (b) Micro-annotation approach
Active State (Check act()) of the samples using a non-overlapped sliding window every 2 seconds. This means, if a sample that has a vector magnitude of acceleration higher than 1.6 g is detected, the features calculation process is triggered. We call this sample theactive sample. Other-wise, the feature calculation process is not triggered.
The second phase contains features calculations. This pro-cess is started by collecting samples with a 1 second window before and 11 seconds window after theactive sample. The 1 second window before theactive sample captures the pre-impact stage while the 11 seconds window after the active sample captures the impact and post-impact stages. The next step calculates the features based on the three stages (pre-impact, impact, and post-impact). The features and their windows are illustrated in Figure 3.
5.
EXPERIMENTAL EVALUATION
5.1
Experimental Setup
The data were pre-processed offline using Python program-ming language and WEKA [10] was chosen for training and testing the instances. J48 Decision Tree, Logistic Regression and Multilayer Perceptron were used as the classifier. For the Multilayer Perceptron classifier, we used 3 hidden layers. Five nodes were used in the first hidden layer, four nodes in the second hidden layer, and three nodes were used in the third hidden layer. As comparison, we also implemented a sliding window based approach that uses J48 Decision Tree as a classifier [16]. We used a machine with the specifica-tion: Intel core i7 @ 3.10 GHz, 8 GB of DDR3 Memory, and
Min
Max
Mean, Velocity, Energy, Variance, RMS, EMA,SMA
0 1 2 3 4 5 6 7
0 200 400 600 800 1000 1200 1400
Vector Magnitude (g)
Samples
Figure 3: Features window illustration
Table 3: Precision, Recall, and f-measure from sliding win-dow based J48 Decision Tree (J48 DT), cascade-classifier based J48 Decision Tree (CC J48 DT ), cascade-classifier based Logistic Regression (CC LR), and cascade-classifier based Multilayer Perceptron (CC MLP)
Classifier Precision (%) Recall (%) f-measure (%) Mean STD Mean STD Mean STD J48 DT 86.9 9.5 89.0 13.6 87.4 10.1 CC J48 DT 87.5 10.8 86.0 17.7 85.7 13.6 CC LR 90.8 6.7 90.8 13.4 90.0 8.5 CC MLP 93.5 7.0 94.2 8.92 93.5 6.3
Linux Mint 17 Qiana to run the experiment.
Leave-one-subject-out cross-validation was used in this ex-periment. Precision, recall, and f-measure were used to mea-sure the performance of our cascade-classifier. The exact Wilcoxon sign rank test was performed to show the signifi-cance of our improvement.
5.2
Results and Discussion
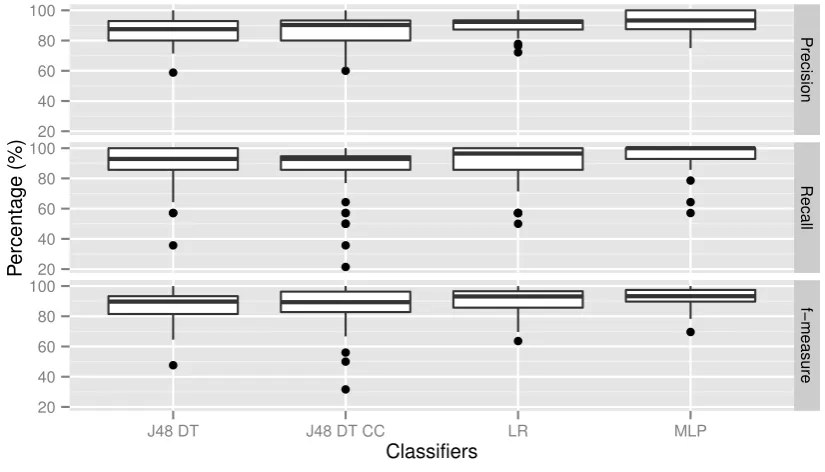
The result of our experiment shows that our cascade-classifier can achieve up to 93.5% of f-measure when it used Multi-layer Perceptron as the classifier. Our approach can sur-pass the sliding window based approach’s accuracy signifi-cantly if Logistic Regression (p-value= 0.04) or Multilayer Perceptron (p-value = 0.00001) are used as the classifier. Although our cascade-classifier approach with J48 Decision Tree as a classifier achieves lower performance than the slid-ing window based algorithm, the difference is not significant (p-value = 0.3). Overall, the Multilayer Perceptron is the best classifier for our cascade-classifier approach because it achieves the highest f-measure. Table 3 shows the average mean and standard deviation of the precision, recall, and f-measure of the sliding window based algorithm and our cascade-classifier approach. The distribution of the perfor-mance values from all classifiers is shown in Figure 4.
20 40 60 80 100
20 40 60 80 100
20 40 60 80 100
Precision
Recall
f−measure
J48 DT J48 DT CC LR MLP
Classifiers
P
ercentage (%)
Figure 4: The classifiers performance
Table 4: Running time
Approach
A segment from a subject
All segments from a subject
Average STD Average STD
Sliding window 0.025 s 0.0009 2677.1 s 712.7
Cascade-classifier 0.006 s 0.0006 0.4 s 0.05
of the machine learning approach. As all the subjects in the dataset follow the same protocol, a subset of them that consists of 4 random subjects was used. The experiment measured the time that was needed to calculate features for each segment and all segments from a subject.
Table 4 shows that our cascade-classifier approach requires significantly less time than the sliding window based ap-proach for feature extractions of each segment (p-value = 3.327e-09) and all segments (p-value = 3.327e-09). The de-lay in detecting falls can be reduced once the running time of the feature calculation from a segment is reduced. By detecting the falls early, the negative effects of them can be reduced. Furthermore, our approach also requires less time to do feature calculation from all segments corresponding to one subject than the sliding window based approach. This means that if our algorithm is implemented on the node, it prevents the sensor node battery lifetime from draining rapidly.
6.
CONCLUSION AND FUTURE WORK
This study proposed a cascade-classifier approach to over-come the high computational cost issue in machine learning based algorithms for fall detection. Our cascade-classifier approach uses Active State feature in the initial phase to trigger the features calculation in the next phase. This
technique prevents the features calculation being executed for some samples. As classifiers, this study used J48 Deci-sion Tree, Logistic RegresDeci-sion, and Multilayer Perceptron. A large dataset of Falls and ADLs with total of 48 subjects and 672 simulated falls was used to assess our approach. We also implemented a sliding window based machine learning approach for a comparison.
From our experiment, it can be concluded that the cascade-classifier approach can significantly reduce the computational time of the current sliding window based machine learning algorithm. It can lead to reduction in computational cost and have a further impact on energy consumption of the node. In terms of accuracy, our approach is able to achieve better performance than the sliding window based machine learning algorithm if it uses Logistic Regression or Multi-layer Perceptron as the classifier. Among the classifiers, the Multilayer Perceptron achieves the best performance with 93.5% of precision, 94.5% of recall, and 93.5 of f-measure.
Some possible avenues for the next step of our research are: (i) investigation of postural sway [19] to trigger the ture calculation process; (ii) investigation of low-cost fea-tures that can increase both performance and speed of the classifier.
Acknowledgment
The authors would like to thank to Dr Olukunle Ojetola for his valuable input.
7.
REFERENCES
[2] Age UK. Stop falling: Start saving lives and money. http:
//www.ageuk.org.uk/documents/en-gb/campaigns/ stop_falling_report_web.pdf?dtrk=true, 2013. [3] F. Bagal`a, C. Becker, A. Cappello, L. Chiari,
K. Aminian, J. M. Hausdorff, W. Zijlstra, and J. Klenk. Evaluation of accelerometer-based fall detection algorithms on real-world falls.PLoS ONE, 7(5):1–9, 2012.
[4] A. K. Bourke, K. J. O’Donovan, J. Nelson, and G. M. OLaighin. Fall-detection through vertical velocity thresholding using a tri-axial accelerometer
characterized using an optical motion-capture system.
Conference proceedings : ... Annual International Conference of the IEEE Engineering in Medicine and Biology Society. IEEE Engineering in Medicine and Biology Society. Conference, 2008:2832–2835, 2008. [5] J. Brusey, R. Rednic, E. I. Gaura, J. Kemp, and
N. Poole. Postural activity monitoring for increasing safety in bomb disposal missions.Measurement Science and Technology, 20(7):075204, 2009.
[6] Y. Choi, a. S. Ralhan, and S. Ko. A study on machine learning algorithms for fall detection and movement classification. In2011 International Conference on Information Science and Applications, ICISA 2011, pages 1–8, Jeju Island, Republic of Korea, 2011. IEEE. [7] C. Dinh and M. Struck. A new real-time fall detection
approach using fuzzy logic and a neural network. In
Wearable Micro and Nano Technologies for
Personalized Health (pHealth), 2009 6th International Workshop on, pages 57–60, June 2009.
[8] J. H. Downton.Falls in the Elderly. Edward Arnold London, 1993.
[9] H. Gjoreski, M. Lustrek, and M. Gams. Accelerometer Placement for Posture Recognition and Fall Detection. In2011 Seventh International Conference on
Intelligent Environments, pages 47–54. Ieee, July 2011. [10] M. Hall, E. Frank, G. Holmes, B. Pfahringer,
P. Reutemann, and I. H. Witten. The weka data mining software: An update.SIGKDD Explor. Newsl., 11(1):10–18, Nov. 2009.
[11] R. Igual, C. Medrano, and I. Plaza. Challenges, issues and trends in fall detection systems.Biomedical engineering online, 12:66, 2013.
[12] D. M. Karantonis, M. R. Narayanan, M. Mathie, N. H. Lovell, and B. G. Celler. Implementation of a real-time human movement classifier using a triaxial accelerometer for ambulatory monitoring.IEEE Transactions on Information Technology in Biomedicine, 10(1):156–167, 2006.
[13] L. J. Kau and C. S. Chen. A smart phone-based pocket fall accident detection system.2014 IEEE International Symposium on Bioelectronics and Bioinformatics, IEEE ISBB 2014, 19(1):44–56, 2014. [14] J. K. Lee, S. Robinovitch, and E. Park. Inertial
Sensing-Based Pre-Impact Detection of Falls Involving Near-Fall Scenarios.IEEE Transactions on Neural Systems and Rehabilitation Engineering, 4320(c):1–1, 2014.
[15] A. J. A. Majumder, I. Zerin, S. I. Ahamed, and R. O. Smith. A multi-sensor approach for fall risk prediction and prevention in elderly.ACM SIGAPP Applied
Computing Review, 14(1):41–52, 2014.
[16] O. Ojetola.Detection of Human Falls using Wearable Sensors. PhD thesis, 2013.
[17] O. Ojetola, E. Gaura, and J. Brusey. Data set for fall events and daily activities from inertial sensors. In
Proceedings of the 6th ACM Multimedia Systems Conference, MMSys ’15, pages 243–248, New York, NY, USA, 2015. ACM.
[18] O. Ojetola, E. I. Gaura, and J. Brusey. Fall detection with wearable sensors - Safe (SmArt Fall dEtection). InProceedings - 2011 7th International Conference on Intelligent Environments, IE 2011, pages 318–321, 2011.
[19] A. Turcato and S. Ramat. Predicting losses of balance during upright stance: Evaluation of a novel approach based on wearable accelerometers. In2010 Annual International Conference of the IEEE Engineering in Medicine and Biology Society, EMBC’10, pages 4918–4921, 2010.
[20] M. Vallejo, C. V. Isaza, and J. D. Lopez. Artificial Neural Networks as an alternative to traditional fall detection methods. InConference proceedings : ... Annual International Conference of the IEEE Engineering in Medicine and Biology Society. IEEE Engineering in Medicine and Biology Society. Conference, volume 2013, pages 1648–51, 2013. [21] G. Wu and S. Xue. Portable preimpact fall detector
with inertial sensors.IEEE Transactions on Neural Systems and Rehabilitation Engineering,
![Figure 1: Activities of Daily Living (ADLs) and simulated fall illustration[16]](https://thumb-us.123doks.com/thumbv2/123dok_us/8425841.1695878/3.595.118.489.53.276/figure-activities-daily-living-adls-simulated-fall-illustration.webp)