Operation Risk
Management
of Planning and
Piping Design
in a Large
Petrochemical
Plant Project
Operation Risk Management
of Planning and Piping Design
in a Large Petrochemical Plant Project
Kamolwan Deeswasmongkol
International Graduate Program in Industrial Engineering, Faculty of Engineering,
Kasetsart University, 50 Pahonyothin Rd, Jatujak, Bangkok 10900, Thailand
[email protected]
Punnamee Sachakamol
International Graduate Program in Industrial Engineering, Faculty of Engineering,
Kasetsart University, 50 Pahonyothin Rd, Jatujak, Bangkok 10900, Thailand
[email protected]
Abstract
Purpose – The purpose of this paper is to present practical and research lessons learned from analysis and the identification of failures which can occur. Failure mode and effects piping analysis (FMEPA) has been shown to be an effective way of improving piping design reliability. FMEPA is also employed for making sample control plans.
Design/methodology/approach – To reduce project losses by using failure mode and effects piping analysis as a tool for analysis of the piping design department. The samples were selected from five projects. It was found that nine major points yielded a risk priority number (RPN) higher than 125.
Findings – Results of RPN calculation concerning four topics revealed that the RPN value was reduced from 211 to 75, demonstrating a 64.4 percent improvement.
Research limitations/implications – The study is limited to a planning and piping case study which considers RPN. Testing of the performance network regression model can be employed in companies, in which quality control has been implemented of solutions for failure prevention of piping design.
Practical implications – This paper serves practitioners as a guideline and tool to understand and implement the FMEPA methodology. At this level, management sets the limits for determining measures. Management also decides whether a risk is acceptable or not. Management needs to clarify which risk priority number (RPN) represents the critical level above which requires risk reduction.
Social implications –Conflicts and social unrest can cause costly delays to new projects and operations. Conflicts can also result in damage to a company’s reputation. This depends on the company’s responses to the conflict and the consequences or perceived consequences of its behavior and actions.
Originality/value – This paper furnishes lessons learned for practitioners in various industrial sectors in preference to other methods of risk assessment and control activities.
Keywords: failure mode and effects analysis, piping design and drawing process, control plan
International Journal of Synergy and Research
Vol. 3, 2014 p. 45–66
IJSR
3
1. Introduction
The “Operation Risk Management of Planning and Piping Design in a Large PetrochemicalPlant Project” is in a state of uncertainty. Some possible event could have either a desirable or undesirable effect on maintainability and operability. This project concerns large chemical production at a petroleum plant project. It is based ona 3Dpiping design model that revolves around the following four steps: 1: Identifying key project risks in a timely manner. 2: Assessing and analyzing the likelihood of risks crystallizing and the consequent cost/schedule impacts on the project. 3. Developing appropriate strategies and actions to respond to risks. 4. Monitoring and controlling risks and implementing action.
The piping problems were identified during fiscal years 2012 to 2014 during which time numerous projects were unable to be completed according to the requirements of the customers. The problems were mainly caused by internal processes. The problems focused sharply on piping design which was not directly related to actual site work. Many faults in piping design forced the company to reorder and rework. From the track record of problems during the period of this study, the project cost for reordered materials increased dramatically compared to original offer costs. Internal processes such as waiting for piping design between internal departments also delayed the overall process. Under current organization, each department is independently managed, leading to poor cooperation between departments. These issues led to poor quality of work and project delays caused overall lack of efficiency. Customer satisfaction and trust were damaged, threatening the company’s chances of winning further projects. At the end of fiscal year 2014, on-going projects were valued at 32,200 million Thai baht. Meanwhile, backlogged projects were valued at 6,740 million Thai baht.
Loss of investment capital is the main factor that threatens any company. In most settings, 7 QC tools (Varsha et al., 2014) are applied and analyzed under statistical methods. For solving quality problems, the seven QC tools used are Pareto diagrams, cause and effect diagrams, histograms, control charts, scatter diagrams, graphs and check sheets. All of these are important tools that are widely used in the manufacturing field to monitor overall operations and to assure continuous process improvement. These tools are used to determine root causes and eliminate them in order to improve the manufacturing process. The modes of defects on a production line are investigated through direct observation and statistical tools.
The collected data is then used to make decisions on current problems with appropriate direction. Statistical tools are then employed for data collection using checklists. Data is then input into a Pareto diagram. From there, a team selects and arranges the problems according to their severity. They are all put into a cause and effect diagram, which shows the systematic relationship between a result, a symptom or an effect and its possible causes. It is an effective tool to systematically generate ideas about causes for problems and to present these in a structured form. This tool was devised by Dr Kaoru Ishikawa and is also known as an Ishikawa diagram.
On the other hand, several local industries have applied failure mode and effects analysis: FMEA is a systematic process intended for reliability analysis. It improves the operational performance of production cycles and reduces their risk level (Scipioni et al., 2002). FMEA was initially used in the industrial production of machinery, motor cars, mechanical and electronic components and electric motor control systems for vehicle
Operation Risk
Management
of Planning and
Piping Design
in a Large
Petrochemical
Plant Project
heating, ventilation and air conditioning (Cassanelli et al., 2011). It has also been used in the pastry industry (Antikalamos and Kalamata, 2011) and food companies (Antonio et al., 2001). From failure analysis, the effects are classified in 3 groups. The first group of FMEA is used for analysis by the design team to evaluate potential failure trends, including mechanisms that can lead to failure. The second group of FMEA is needed to establish understanding of each activity in processes that poses risks. The third group of FMEA links these activities together to determine failure trends and employs analysis to control and reduce risks during the processes. Similar research having equivalent procedures started with rearranging the level of severe problems, then doing analysis with a fish-bone diagram, followed by analysis of failures and effects with FMEA. Finally, all analysis data was input to the control plan. Pasuk et al., (2009) studied waste reduction in the chromium plating process using FMEA and developing the quality of plating surface using six sigma. Their research reduced waste from the process by up to 70 percent. Jiwawongsawas et al., (2007) applied FMEA and AHP for process improvement in the ceramic coating industry as a major product faced serious quality problems. Prada and Kuptadsathien, (2007) performed analysis using FMEA for the fire protection coat production for all processes and calculated risk priority numbers (RPN) with a Pareto diagram. Next, they conducted a control plan showing that productivity increased up to 15.32 percent and waste in the process decreased by 11.15 percent.
Rittipakdee, (2011) studied ways to improve the painting process in the automobile industry. He used cause and effect diagrams to determine production problems and developed a relationship diagram together with a tree diagram, employing new 7 QC Tools to determine the problems. Thongpraiwa and Kuptadsathien, (2010) applied FMEA to improve the efficiency of the glass molding design and development processes. They found process RPN of 100 points or more. The major failures of mold design that needed immediate correction included 33 out of 65 topics. As a result of RPN correction, failure of mold testing was reduced from 2.7 times to 1 time for each molded product. Furthermore, production lead time was reduced on average from 75 days to 45 days, representing a 40 percent improvement.
A review of related literature reveals numerous ways to apply FMEA theory to real jobs of planning and piping design. It can be used to analyze and identify potential failures. FMEA has also been used to create a control plan for a sample company.
2. Literature review
Similar research concerning equivalent procedures began with analyzing the severity of problems, then conducting analysis using a fish-bone diagram, followed by analysis of failures and effects with FMEA. Finally, all of the analysis data was input to a control plan. Jiwawongsawas et al., (2007) applied FMEA and an analytic hierarchy process (AHP) for process improvement at a ceramic coating industry facing major quality problems with some of its products. Prada and Kuptadsathien, (2007) analyzed FMEA for the production of fire protection coats for all processes and calculated the risk priority number (RPN) using a Pareto diagram. The control plan in that study revealed that productivity increased up to 15.32 percent and waste in process decreased by 11.15 percent. Rittipakdee, (2011) studied methods to improve the painting process for the automobile industry. He used
IJSR
3
cause and effect diagrams to determine production problems plus he created a relationship diagram and tree diagram to determine the major problems. Scipioni et al., (2002)applied FMEA to categorize risk evaluation as follows: slight risk (RPN<60), moderate risk (RPN<80), high risk (RPN<100) and crisis risk (RPN>100).
Review of related literature has enabled the researchers to apply FMEA theory in genuine planning and piping design. Scipioni et al., (2002) studied the ways in which FMEA can control and reduce waste from design processes which affect quality in the petrochemical industry. Klomjit and Kaewsaithom, (2010) studied ways to reduce downtime caused by machine breakdown during operation and to select preventative maintenance task categories based on reliability-centered maintenance (RCM) for machine components. The study began by identifying the critical machine or equipment that impacted paper production and then analyzing the root causes and failures analysis using FMEA. The next step was to simulate the failure patterns of component parts using statistical data to forecast reliability parameters. The final phase was selecting preventive maintenance tasks which met the reliability parameters of each failure mode. This study has shown that downtime decreased. Meanwhile, machine availability increased.
Jang-Shyong et al., (2006) studied a probable failure analysis to determine the failure probabilities of piping segments, and a probable risk assessment model was employed to identify risks at a nuclear power plant. The multiplication of the piping failure probability and the consequences of that particular failure results in the risk contribution of the pipe. The degrees of risk for different piping segments can then be ranked and the results can be used as the basis for planning a risk-informed inspection program.
Tavner et al., (2010) researched FMEA techniques to compare the prospective reliability of three versions of the geared R80 turbine with different drive train solutions. These solutions have been proposed to reduce the overall wind turbine failure rate and raise its reliability. The first solution incorporated a conventional LV doubly fed induction generator (DFIG) with partially-rated electrical converter and transformer. The second solution incorporated an innovative hydraulic converter coupled to an MV synchronous generator (SG) without a transformer. The third solution incorporated an innovative LV brushless doubly fed induction generator (GDFIG) with a partially-rated electrical converter and transformer. Their research proposed modifications to the FMEA method to analyze and compare reliability. They applied that approach to three alternative designs in order to identify optimum solutions.
3. Methodology
FMEA, which originated in 1950, is a form of reliability analysis technology used for the prevention of accidents. It was first used in the primary operation system in the Grumman Aircraft Corporation to analyze relevant processes, detect potential failure modes and effects, take corrective action to eliminate potential failures and bring about continuous improvement. Included is the important concept and skill of the risk classification/assessment method.
FMEA is a reliable technology for preventing defects and improving product safety and quality. The main function of FMEA is to point out a design or system failure mode, explore the impact of the failure on the system, give qualitative or quantitative assessments, take necessary corrective measures and then implement preventive policies.
Operation Risk
Management
of Planning and
Piping Design
in a Large
Petrochemical
Plant Project
This method is often used in the product design stage or applied to the improvement of manufacturing engineering and safety analysis. Although FMEA has been widely used in the definition and elimination of known or latent failures in order to improve reliability and security, it was not until recent years that hospitals began to use FMEA for improvement. The main operating procedures of FMEA include: establishment of the team, analysis of the current situation work process, latent failure and impact analysis, risk assessment, failure cause identification, implementation of countermeasures, countermeasure tracking and outcome measurement (Ching and Chao, 2014).
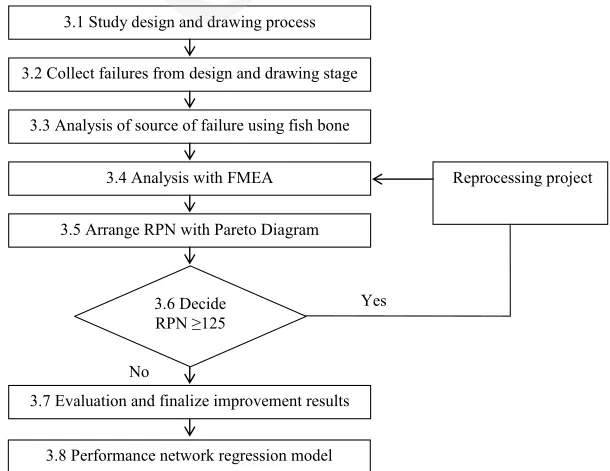
A research method consisting of eight processes is shown in Figure 1. It begins with a study of design and collection of data of the piping design and drawing process, followed by analysis of the data to determine failures. Using a cause and effect diagram, analysis is performed using FMEPA. The findings are then arranged according to RPN using a Pareto chart. Processes with high RPNs are then selected for rework. Finally, the data is applied with a control plan and the results are summarized.
3.1 Studying design and drawing process
The process of design and drawing comprises a variety of steps. It begins with project data as shown in Figure 2. The FMEPA technique does not account for technical specifications, design and drawing. After the design and drawing are complete, the isometric process, plus the piping and instrument diagram (P&ID) are matched with the vendor’s drawings together with information from other departments. Then, the data is rechecked and calculated. If the data is not correct, the process goes into a loop until it passes the qualifications before it is handed over to the construction department.
Figure 1:
Research Methodology
5
Figure 1 Research Methodology
3.2 Fault data from design and drawing
3.2.1 Design and drawing before improvement
This research collected data between the years 2012 and 2014. It was found that the percentage of losses over the project value tended to increase continuously as demonstrated in Table 1 and Figure 3. Faults were classified into four types of problems. Each group includes internal details with a description of the type of loss as shown in Table 1.
Table 1 Unplanned costs due to design and drawing faults from 2012 to 2014
Year
Project Value (P) (in Millions
USD)
Re-Order Cost (A) in Millions
USD
Cost of project correction (B)
in Millions USD
Total Cost (A+B) in Millions USD
Percentage of Loss
(A+B) /P, %)
2012 455 0.19 0.24 0.42 =(0.42*100)/461 =0.09
2013 500 0.44 0.52 0.95 =(0.95*100)/507=0.19
2014 976 0.93 1.24 2.17 =(2.17*100)/990=0.22
Average 0.17
No
Reprocessing project
Yes 3.1 Study design and drawing process
3.2 Collect failures from design and drawing stage
3.3 Analysis of source of failure using fish bone diagram
3.4 Analysis withFMEA
3.5 Arrange RPNwithPareto Diagram
3.6 Decide RPN ≥125
3.7 Evaluation and finalize improvement results
3.8 Performance network regression model
IJSR
3
3.2 Fault data from design and drawing
3.2.1 Design and drawing before improvementThis research collected data between the years 2012 and 2014. It was found that the percentage of losses over the project value tended to increase continuously as demonstrated in Table 1 and Figure 3. Faults were classified into four types of problems. Each group includes internal details with a description of the type of loss as shown in Table 1.
Year (in Millions USD)Project Value (P) Re-Order Cost (A) in Millions USD
Cost of project correction (B) in Millions USD
Total Cost (A+B) in
Millions USD Percentage of Loss (A+B) /P, %)
2012 455 0.19 0.24 0.42 =(0.42*100)/461 =0.09
2013 500 0.44 0.52 0.95 =(0.95*100)/507=0.19
2014 976 0.93 1.24 2.17 =(2.17*100)/990=0.22
Average 0.17
Table 1:
Unplanned costs due to design and drawing faults from 2012 to 2014
Figure 2:
Design and drawing process
Operation Risk
Management
of Planning and
Piping Design
in a Large
Petrochemical
Plant Project
Figure 3:
Cause and effect diagram
3.3 Cause and effect of faults and waste analysis using fish-bone
diagram
From the design and drawing process through the project handover to the end customer comprises 8 internal processes. Group brainstorming among several departments was conducted to analyze the effects of faults. The quality tool used for this analysis was a cause and effect diagram as shown in Figure 3.
3.4 Failure analysis using FMEA technique
Failure analysis is very important to determine cause and effects in the manufacturing process. It is used to solve problems systematically. It helps prevent losses before they occur. FMEA technique also enhances systematic problem solving skills. It is used by a project team to rearrange processes and prevent the high probability of loss on projects. FMEA consists of the methods explained below.
3.4.1 Pipe layout, material selection, pipe loading design and risk analysis are considered for selection and design. Brainstorming raises issues for design properties. Requirements for internal work and design must consider maximum usage; design must meet customer requirements and must aim for maximum safety. From brainstorming to analyzing the trends of failures due to piping design, nine types of failures were categorized. Failures were mainly caused by poor design which did not comply with the customer’s specifications. Some designs contributed to poor efficiency. Some designs failed due to material selection. Moreover, some design work caused parts damage during actual use. Table 5 summarizes the processes that led to failures.
3.4.2. Potential failure mode is a normal specification in the processes. If a sub-process does not comply with original specifications, it raises the question, “what will each department do to resolve the failure?” Potential failure mode is shown in Table 5.
IJSR
3
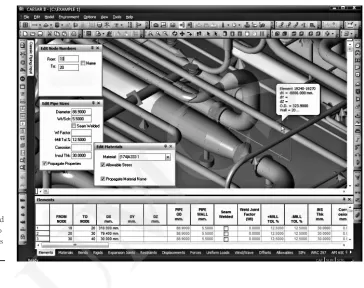
3.4.3 Failure detection methods in the current situation employ 3D simulation. These methods are used to determine failures and test the most suitable design. The design is then transferred to CAESAR II program (Pipe stress analysis) for design and calculation of mechanical support as shown in Figure 4.
3.4.4 Process control during the current situation is employed to control possible failures. Table 3 shows guidelines for fault control. This data is used for calculations in FMEA by arranging the risk priority number (RPN). RPN refers to results that will cause harm to the project. A higher RPN relates to a higher degree of risk. The calculation of RPN is shown in equation 1 (American Society for Quality (ASQ), 2005) as follows:
RPN = S x O x D (1)
Where S is Severity, O is Occurrence, D is Detection constraints: S, O and D, are integers ranging from 1–10
Figure 4:
Cutting-edge, annotated graphics make it easy to access or review analysis input data.
Operation Risk
Management
of Planning and
Piping Design
in a Large
Petrochemical
Plant Project
Evaluation Classification Explanation
1 Very low No adverse effects on product/process quality can be derived. The failure consequences are wholly insignificant.
2 Low No adverse effects on product/process quality are likely to be derived. The failure consequences are insignificant.
3 Low An applicable product can be expected. The master batch record is fulfilled, although some deviations in the process exist.
4 Low An applicable product can be expected. The master batch record is fulfilled, although considerable deviations in the process exist.
5 Medium The use of the product is limited; process is stable.
6 Medium The use of the product is limited; slight deviations in the process exist. 7 Medium The use of the product is limited; process is unstable.
8 High The product has to be rejected;
9 High The product has to be rejected; Process change has to be considered.
10 High The product has to be rejected; Process must be changed.
Evaluation Classification Explanation
1 Very low Failure frequency <0.01% or failure is not expected
2 Low Expected failure frequency ≥0.01% and <0.05%
3 Low Expected failure frequency ≥0.05% and <0.1%
4 Low Expected failure frequency ≥0.1% and <0.2%
5 Medium Expected failure frequency ≥0.2% and <0.5%
6 Medium Expected failure frequency ≥0.5% and <1%
7 Medium Expected failure frequency ≥1% and <2%
8 High Expected failure frequency ≥2% and <5%
9 High Expected failure frequency ≥5% and <10%
10 High Expected failure frequency ≥10%
Table 2:
Severity (S) of a Failure
Table 3:
Probability of Occurrence (O)
IJSR
3
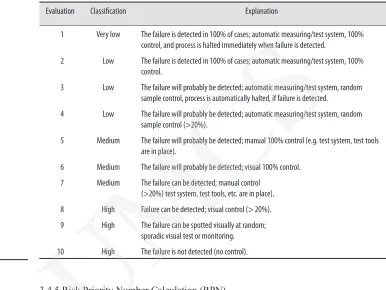
Evaluation Classification Explanation1 Very low The failure is detected in 100% of cases; automatic measuring/test system, 100% control, and process is halted immediately when failure is detected.
2 Low The failure is detected in 100% of cases; automatic measuring/test system, 100% control.
3 Low The failure will probably be detected; automatic measuring/test system, random sample control, process is automatically halted, if failure is detected.
4 Low The failure will probably be detected; automatic measuring/test system, random sample control (>20%).
5 Medium The failure will probably be detected; manual 100% control (e.g. test system, test tools are in place).
6 Medium The failure will probably be detected; visual 100% control.
7 Medium The failure can be detected; manual control
(>20%) test system, test tools, etc. are in place).
8 High Failure can be detected; visual control (> 20%).
9 High The failure can be spotted visually at random;
sporadic visual test or monitoring.
10 High The failure is not detected (no control).
3.4.5 Risk Priority Number Calculation (RPN)
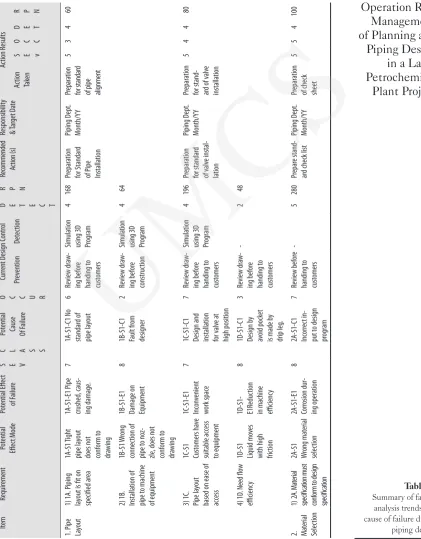
Results from RPN calculation reveal that the highest RPN value was 280 points and the lowest value was 32 points as shown in Table 5. This table shows the RPNs for the piping layout process.
3.5 Process selection for analyzing control plan with Pareto
diagram
When RPN numbers are rearranged using a Pareto diagram, the data is distributed and grouped to reveal the stability of data by frequency distribution count. Important data will have a low number or a few vital points. In contrast, less important data will yield a high number or many trivial points. Data analysis revealed that the major processes can be classified into nine crucial processes as demonstrated in Table 5.
Table 4:
Probability of Detection (D)
Operation Risk
Management
of Planning and
Piping Design
in a Large
Petrochemical
Plant Project
Item Requir emen t Pot en tial Eff ec t Mode Pot en tial E ffec t of F ailur eS E V
C L A S S
Pot
en
tial
Cause Of Failur
e
O C C U R
Curr en t D esign C on trol
D E T E C T
R P N
Re co m m en de d Ac tio n ( s) Responsibilit y & Tar get Da te Ac tion Results Pr ev en tion Det ec tion Ac
tion Taken S E v O C C D E T R P N
1. P
ipe
La
yout
1) 1A. P
iping
lay
out is fit on
specified ar ea 1A-S1 Tigh t pipe la yout
does not conf
orm t o dr awing 1A-S1-E1 P ipe crushed , c aus -ing damage . 7 1A-S1-C1 N o standar d of pipe la yout 6 Review dr aw -ing bef or e handing t o cust omers Simula tion
using 3D Progr
am 4 168 Pr epar ation for S tandar d of P ipe Installa tion Piping D ept . Mon th/Y Y Pre pa rat ion for st an da rd of pip e ali gn m en t 5 3 4 60 2) 1B . Installa tion of pipe t o machine of equipmen t 1B-S1 W rong connec tion of pipe t o no z-zle
, does not
conf
orm t
o
dr
awing
1B-S1-E1 Damage on Equipmen
t 8 1B-S1-C1 Fault fr om designer 2 Review dr aw -ing bef or e constr uc tion Sim ula tio n us ing 3D Pr og ram 4 64
3) 1C. Pipe la
yout
based on ease of access 1C-S1 Cust
omers ha ve suitable ac cess to equipmen t
1C-S1-E1 Incon
venien t work spac e 7 1C-S1-C1
Design and installa
tion for v alv e a t high position 7 Review dr aw -ing bef or e handing t o cust omers Simula tion
using 3D Progr
am 4 196 Pr epar ation for standar d of v alv e instal -lation Piping D ept . Mon th/Y Y Pr epar ation for stand -ar
d of v
alv e installa tion 5 4 4 80 4) 1D . N eed flo w efficienc y 1D -S1 Liquid mo ves
with high friction
1D
-S1-E1Reduc
tion
in machine efficienc
y 8 1D -S1-C1 Design b y av oid pock et
is made b
y drip leg . 3 Review dr aw -ing bef or e handing t o cust omers -2 48
2. Material Selec
tion 1) 2A . M ate ria l sp ec ific ati on m us t co nfo rm to de sig n sp ec ific ati on
2A-S1 Wrong ma
terial
selec
tion
2A-S1-E1 Corrosion dur
-ing oper ation 8 2A-S1-C1 Inc orr ec t in -put t o design pr ogr am 7 Review bef or e handing t o cust omers -5 280 Pr epar e stand -ar
d check list
Piping D ept . Mon th/Y Y Pr epar ation
of check sheet
5
5
4
100
Table 5:
Summary of failure analysis trends and cause of failure due to piping design
IJSR
3
Item Requir emen t Pot en tial Eff ec t Mode Pot en tial E ffec t of F ailur eS E V
C L A S S
Pot
en
tial
Cause Of Failur
e
O C C U R
Curr en t D esign C on trol
D E T E C T
R P N
Re co m m en de d Ac tio n ( s) Responsibilit y & Tar get Da te Ac tion Results Pr ev en tion Det ec tion Ac
tion Taken S E v O C C D E T R P N
4. O
per
a-tion risk analysis
3) 4A. P
roper
sizing f
or pipe
suppor
t
4A-S1 Under- sized pipe suppor
t
4A-S1-E1 Bending sup
-por
t, c
ollapsed
pipe Pipe suppor
t deflec tion 8 4A-S1-C1 W
rong input for pipe sup
-por t 5 Review dr aw -ing bef or e handing t o cust omers
Use CEASAR II progr
am f or load simula -tion 5 200 Pr epar e stand -ar
d check list
Piping D ept . Mon th/Y Y Pr epar ation
of check sheet
5 3 4 60 4) 4B . P ipe appear anc e
must not cr
ack
or bend during oper
ation
4B-S1 Defec
t and
cracks of pipe
Plan t/F ac tor y do wn 8 4B-S1-C1 W rong ma te -rial 2 Review bef or e handing t o cust omers
Use CEASAR II progr
am f or load simula -tion 3 48
5) 4C. N
ozzle
join
t must not
be damaged 4C-S1 N ozzle damage Chemic al leak -age 7 4C-S1-C1 Inappr opria te suppor t f or pipe 3 Review bef or e handing t o cust omers
Use CEASAR II progr
am f or load simula -tion 3 63 Table 5:
Summary of failure analysis trends and cause of failure due to piping design (continued)
Operation Risk
Management
of Planning and
Piping Design
in a Large
Petrochemical
Plant Project
3.6 Results from RPN arrangement
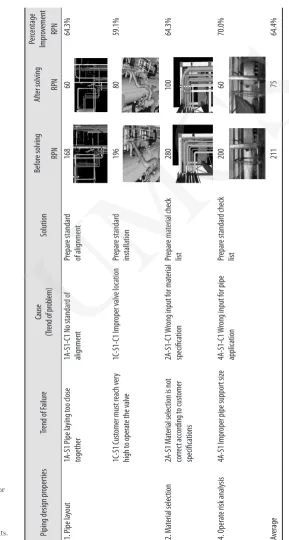
RPNs were arranged from low to high as shown in Figure 5. In this study, RPNs higher than 125 points were selected for improvement. This included four out of nine problems. The important issues comprised pipe layout in two problems, material selection in one problem and risk of use in one problem. Based on Table 5, the action team discussed the problems and solved them by referencing other project databases. The problems were solved as demonstrated in Table 6.
Results were discussed to resolve failures. Topics with RPNs higher than 125 points are summarized in Table 6. From RPN point re-calculation of four major types of failure, it was found that RPN points were reduced from 211 to 75 after improvement, representing a 64.4 percent reduction in RPN.
Figure 5:
Risk priority number for each issue
3.6.1 Rearrangement and Evaluation of revised RPN
IJSR
3
Piping design pr
oper
ties
Trend of F
ailur e Ca us e (Tr en d o f p rob lem ) Solution Bef or e solving Af ter solving Per cen tage Impr ov emen t RPN RPN RPN 1. P ipe la yout 1A-S1 P ipe la ying t oo close together 1A-S1-C1 N o standar d of alignmen t Pr epar e standar d of alignmen t 168 60 64.3% 1C-S1 C ust
omer must r
each v er y high t o oper at
e the v
alv e 1C-S1-C1 Impr oper v alv e loc ation Pr epar e standar d installa tion 196 80 59.1% 2. Ma terial selec tion 2A-S1 Ma terial selec
tion is not
corr ec t ac cor ding t o c ust omer specific ations 2A-S1-C1 W
rong input f
or ma terial specific ation Pr epar e ma terial check list 280 100 64.3% 4. O per at
e risk analysis
4A-S1 Impr
oper pipe suppor
t siz
e
4A-S1-C1
W
rong input f
or pipe applic ation Pr epar e standar d check list 200 60 70.0% Av er age 211 75 64.4% Table 6:
RPNs before and after improvement and summary of problem solving for piping design causes and effects to resolve topics with RPNs higher than 125 points.
Operation Risk
Management
of Planning and
Piping Design
in a Large
Petrochemical
Plant Project
3.7 Evaluation and final improvement results
A summary of the problems causing rework due to design errors are summarized in Table 7. Conclusion costs from design errors in Table 12 are based on the project valued at 17.8 million USD for the study.
Properties Potential Cause Trend of Failure or Mechanism Solution
1. Pipe layout 1) 1A. Piping layout is fit in specified area Not found 2) 1B. Tie in pipe with designed equipment Not found 3) 1C. Pipe alignment for ease of use Not found
4) 1D. Need flow efficiency The noise impact of fluid
inside the pipe. New pipeline planned in accordance with the type of liquid. 2. Material selection 1) 2A. Material must conform to design
specification Not found
3. Pipe loading design 2) 3A. Support must be able to take load
from pipe Not found
4. Operate 3) 4A. Proper sizing for pipe support Not found
risk analysis 4) 4B. Pipe appearance must not crack or bend during operation
Found cracked pipes due to poor quality of raw materials
Change to other source supplier for quality. And reinstallation. 5) 4C. Nozzle joint must not be damaged Not found
The results reveal that the average percentage of the cost due to design error decreased from 0.31 to 0.08 percent, achieving the goals that were set. Using a reduced percentage of losses, costs were reduced to 74.2 percent (percentages comes from 100-(0.08/.31)*100).
Trend of Failure or Mechanism Solution The cost of reorder materials (in
millions USD)
The cost of Rework (in millions USD) The noise impact of fluid inside
the pipe. New pipeline planned in accordance with the type of liquid. 0.17 0.08
Found cracked pipes due to
bad quality of raw materials. Change to other source supplier for quality plus reinstallation 0.14 0.07
Total cost of each topic. 0.31 0.15
Total cost 0.46
Percent of the cost compared to the value of the project. (overall 17.6 million US dollar)
0.08
Table 7:
Summary of problems causing rework due to design error
Table 8:
Conclusion of costs due to design errors
60
IJSR
3
3.8 Test of the performance network regression model in the
piping department
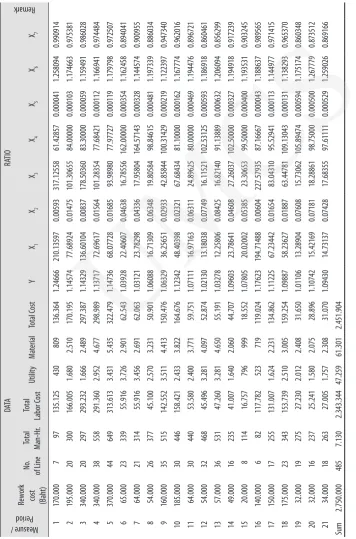
The most commonly used measure for profitability is the ratio of revenue and cost. Productivity represents the ability of the organization to utilize its resources for generating outputs. Then, performance measures (in terms of a ratio) that relate to the two performance criteria are developed. The following Table 10 demonstrates some of the performance measures and their respective results from the data that has been collected.The next step involves the use of the performance network concept. This concept represents an attempt to cluster different performance measures into one group. This cluster is based on the cause-and-effect relationships among the performance measures. Given the establishment of the PNs on profitability and productivity, the next step is to test the significance (in terms of the reliability and the goodness of the equations) of the interrelationships among different measures (which have been clustered). Usually, the Significance-F Value is less than 0.05. Figure 6 demonstrates this step in details for the PNs on both profitability and productivity respectively.
Figure 6:
Piping Detail Design Network Performance Measurements for 21 weeks
14
Mechanism materials (in millions
USD) millions USD) Rework (in
The noise impact of fluid
inside the pipe. accordance with the type of New pipeline planned in liquid.
0.17 0.08
Found cracked pipes due to
bad quality of raw materials. Change to other source supplier for quality plus reinstallation 0.14 0.07
Total cost of each topic. 0.31 0.15
Total cost 0.46
Percent of the cost compared to the value of the project.
(overall 17.6 million US dollar) 0.08
3.8 Test of the performance network regression model in the piping department
The most commonly used measure for profitability is the ratio of revenue and cost. Productivity represents the ability of the organization to utilize its resources for generating outputs. Then, performance measures (in terms of a ratio) that relate to the two performance criteria are developed. The following Table 10 demonstrates some of the performance measures and their respective results from the data that has been collected.
The next step involves the use of the performance network concept. This concept represents an attempt to cluster different performance measures into one group. This cluster is based on the cause-and-effect relationships among the performance measures. Given the establishment of the PNs on profitability and productivity, the next step is to test the significance (in terms of the reliability and the goodness of the equations) of the interrelationships among different measures (which have been clustered). Usually, the Significance-F Value is less than 0.05. Figure 6 demonstrates this step in details for the PNs on both profitability and productivity respectively.
Figure 6 Piping Detail Design Network Performance Measurements for 21 weeks
Pobrane z czasopisma International Journal of Synergy and Research http://ijsr.journals.umcs.pl Data: 08/09/2020 10:11:16
Operation Risk
Management
of Planning and
Piping Design
in a Large
Petrochemical
Plant Project
Table 9:
Performance Measures (Ratios) and Results
Measure / Period DA TA RA TIO Remark Rew ork
cost (Baht)
N
o.
of Line
Total Man-Hr
IJSR
3
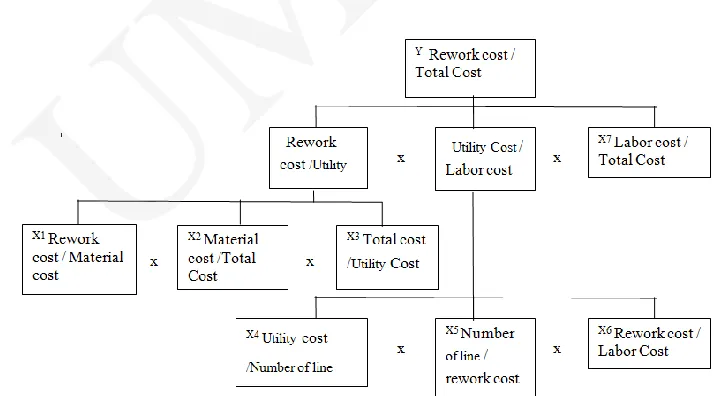
Figure 6 shows that a cluster at the lowest level represents the set of performance measures for determination of the profitability level is shown as follows:
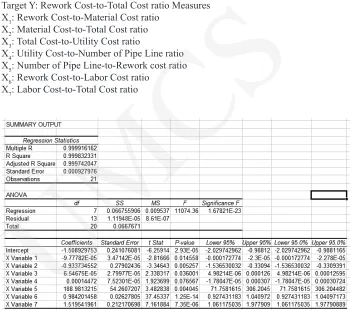
Target Y: Rework Cost-to-Total Cost ratio Measures X1: Rework Cost-to-Material Cost ratio
X2: Material Cost-to-Total Cost ratio X3: Total Cost-to-Utility Cost ratio
X4: Utility Cost-to-Number of Pipe Line ratio X5: Number of Pipe Line-to-Rework cost ratio X6: Rework Cost-to-Labor Cost ratio
X7: Labor Cost-to-Total Cost ratio
Analysis of the multiple regression for statistical testing was performed on the set of the measures with time order (T) by using the target as variable Y and the measures as variable X. The multiple regression equation for profitability is:
Y = - 1.55 - 0.000100 X1 - 0.945 X2 + 0.000066 X3 + 0.000156 X4 + 197 X5+ 0.988 X6 + 1.55 X7 (2)
The profitability PNs regression equation has R-square equal to 0.999 or 99.9%, meaning the set of 7 measures and time order with their coefficients can estimate about 99.99% of the variation of Y (a profitability measure). Standard error of regression analysis is 0.000927976. It is close to zero (meaning this regression analysis is accurate with a margin of error of about 0.000927976). For the F-test, Significance-F of this regression analysis is 1.67821 × 10⁻²³, meaning the probability of F (7,13,0.99) > F-statistic = 11074.36 is about 1.67821 × 10⁻²³ %. When the F-statistic value = 11074.36, > F (7,13,0.99) = 4.441, it implies that this regression is significant and could be applied for the estimation of Y.
Figure 6:
Summary of the
Operation Risk
Management
of Planning and
Piping Design
in a Large
Petrochemical
Plant Project
A plot scatter diagram of each pair of variables shows two perspectives. The X-axis represents independent variables. The Y-axis represents response variables. The scatter plots show the distribution of the individual variables. The shape or curve of the plot can help to indicate the possible behavior of an interrelationship as shown in Figure 7.
4. Results
4.1 This research has established the necessary steps for risk assessment for the piping design process from a sample company. The company is mature in the petrochemical and chemical plant building business. Design failure mode and effects piping analysis have been applied to evaluate and determine the risks involved in process failures. Solutions were designed to protect piping systems before failures could occur. Nine crucial topics of failure were evaluated in this research. Each topic yielded a risk priority number (RPN) higher than 125 points. A summary of how to prevent failures or problems is shown in Table 9.
Trend of Failure or Mechanism Solution
1A-S1-C1 No standard of alignment Prepare a standard of installation based on customer specifications. 1C-S1-C1 Improper valve location Prepare a standard of piping design and installation at proper position
for ease of access.
2A-S1-C1 Wrong input for material specification Prepare standard checklist of material before actual construction. 4A-S1-C1 Wrong input for pipe application Prepare standard checklist for support to match actual site work and
construction.
Figure 7:
Residual Plots for Y
Table 9:
Summary of solutions for failure prevention of piping design
IJSR
3
Failure mode and effects piping analysis (FMEPA) of late project transfer to customers significantly reduced problems. During the study of FMEPA on five ongoing projects, nine crucial failure topics were identified. Four topics had RPNs higher than 125. A committee then researched ways to determine solutions to the problems. The RPNs were reduced from an average score of 211 points to 75 points, representing a 64.4 percent reduction of problems.
4.2 The equations model was obtained from the multiple regression equation of the Rework cost / Total cost (Y) ratio.
The research revealed that coefficient X5 yielded the highest value. This indicates that the Number of Pipe Lines-to-Rework cost ratio (X5) affects the Rework cost / Total cost (Y). Therefore, managers should consider the weight value for optimization.
From equation Y, the value of the high secondary coefficient was 1.55. This indicates the Labor Cost-to-Total Cost ratio (X7). Therefore, the piping design should improve the Number of Pipe Lines-to-Rework cost ratio.
5. Conclusion
This research shows the importance of applying operation risk management analysis and identifying potential failures by improving piping design reliability. Due to the difficulty of each piping design pattern, managers should increase the knowledge of technical staff and improve procedures before starting work. Therefore, employees can increase the number of pipes to make more quality in the model. Overall, working hours can be reduced.
6. Recommendations
The RPN cannot be used to measure the effectiveness of corrective actions. Further, the three risk factors (S, O and D) are difficult to precisely evaluate. There is a need to split risk factors to reduce their vagueness and add other risk factors in the determination of risk priority of failure modes. FMEA innovation can become a more powerful tool for safety and reliable analysis of systems, processes, designs and services in an organization when risk factors and risk priority methods are appropriate for the specific risk evaluation problems.
7. Contribution
Financial benefits are also derived from the design improvements that FMEA is expected to facilitate, including reduced warranty costs and increased sales through enhanced customer satisfaction. Conflicts and social unrest can cause costly delays to new projects and operations. Conflicts can also result in damage to a company’s reputation. This depends on the company’s responses to conflicts and the consequences or perceived consequences of its behavior and actions.
Operation Risk
Management
of Planning and
Piping Design
in a Large
Petrochemical
Plant Project
8. Future research
Using FMEA to identify the risk factors related to those sustainability metrics and integrating them into QFD to formulate the best sustainability strategy of service operation is still relatively scarce in the literature.
9. Management Implications
Management determines measures and then decides whether a risk is acceptable or not. Management needs to clarify which RPNs represent a critical level above which risk reducing measures need to be implemented as shown in Figure 8.
References
Antonio, S., Giovanni S., Angela C. and Francesca A. (2001), “FMEA methodology design, implementation an integration with HACCP system in a food company”, Food Control. Vol. 13, pp. 495–501.
Antikalamos and Kalamata, H. (2011), “Application of ISO 22000, Failure Mode, and Effect Analysis (FMEA) Cause and Effect Diagrams and Pareto in Conjunction with HACCP and Risk Assessment for Processing of Pastry Products”. Critical Reviews in Food Science and
Nutrition, Vol. 51, pp. 762–782.
Cassanelli, G., Mura G., Fantini , F., M. Vanzi. and Plano B. (2011), “Failure Analysis-assisted FMEA”. Microelectronics Reliability, Vol. 46, pp. 1795–1799.
Ching, J., and Chao, C. (2014). “Risk management for outsourcing biomedical waste Disposal – Using the failure mode and effects analysis”. Waste Management. Vol. 34, pp. 1324–1329. Jang Shyong, Y., Hung Ta K. and Wen Fang W. (2006), Case studies of risk-informed in service
inspection of nuclear piping systems. Nuclear Engineering and Design, Vol. 236, pp. 35–46.
Jirawongsawad K., et. al., 2007. “Applying FMEA and AHP for Process Production Improvement; Case Study Ceramic Industries”, Industrial Engineering Network Seminar, Thailand. Klomjit, P., and Kaewsaithom, P. (2010), Applications of Reliability Centered Maintenance
for Reducing Downtime in a Paper Plant, “Department of Industrial Engineering and
Figure 8:
Management Implications for determining RPN limits
IJSR
3
Management”, Faculty of Engineering and Industrial Technology, Silpakorn University,
Thailand.
Pasuk, W., et al. (2009), “Waste Reduction for Chromium Plating by Using Six Sigma Case Studies from Chromium Plating Industries”, Industrial Engineering Network Conference, Thailand.
Prada, A., and N. Kuptadsathien. (2007), “Failure Mode Analysis and Effects in Anti Fire Suite Production and Control Plan for Increasing Productivity: Case Study Anti Fire Suite
Industries”, Industrial Engineering Network, Thailand.
Rittipakdee, A. (2011), “Quality Improvement for Painting Process in Auto mobile Industries”.
Industrial Engineering, Chulalongkorn University, Thailand.
Scipioni, A., Saccarola, G., Centazzo, A., & Arena, F. (2002), “FMEA methodology design, Implementation and integration with HACCP system in a food company”. Food Control, Vol. 13, pp. 495–501.
Tavner, J., Higgins, A., Arabian H., Long H., Y Feng (2010), “An FMEA method to compare prospective wind turbine design reliabilities” , European Wind Energy Conference (EWEC
2010), Berlin, Germany.
Thongpraiwan, W., and Kuptadsathien, N. (2010), “Applying FMEA for Glass Moulding Design and Development Improvement”, Industrial Operation and Development Symposium”, Thammasart University, Thailand.
Varsha, M., and Vilas, B. (2014). “Application of 7 Quality Control (7 QC) Tools for Continuous Improvement of Manufacturing Processes”, International Journal of Engineering Research
and General Science .Vol.2, No. 4, pp. 710–730.
Biographical Notes
Kamolwan Deeswasmongkol currently works as section chief of the piping and planning division at Toyo-Thai Corporation Public Company Limited (TTCL). She is a part time Ph.D. student in Industrial Engineering at the Faculty of Engineering at Kasetsart University in Thailand. She holds a Bachelor’s degree in mechanical engineering and a Master’s degree in engineering management. Her research interests include how to use game theory for strategic decisions.
Punnamee Sachakamol is a lecturer in the department of Industrial Engineering in the Faculty of Engineering at Kasetsart University. He received his B.A.Sc., M.A.Sc. and Ph.D. in Industrial System Engineering from the University of Regina in Canada. His research interests are optimization of production processes, ecological footprints, supply chain/value chain management, cool chain management, and pharmaceutical operation management. He has experience with numerous large-scale projects with private firms.