http://www.sciencepublishinggroup.com/j/es doi: 10.11648/j.es.20170202.13
Development of Mathematical Model to Predict Micrococcus
Influenced by Diffusion in High Heterogeneous Permeable
Gravel Formation, Warri Delta State of Nigeria
Eluozo S. N
.Department of Civil and Environmental Engineering, Subaka Nigeria Limited Port Harcourt, Port Harcourt, Nigeria
Email address:
[email protected], [email protected]
To cite this article:
Eluozo S. N. Development of Mathematical Model to Predict Micrococcus Influenced by Diffusion in High Heterogeneous Permeable Gravel Formation, Warri Delta State of Nigeria. Engineering Science. Vol. 2, No. 2, 2017, pp. 45-52. doi: 10.11648/j.es.20170202.13
Received: October 26, 2016; Accepted: February 24, 2017; Published: March 28, 2017
Abstract:
This paper examined the behaviour of micrococcus
deposition in higher heterogeneous permeable gravel formation in the study area, diffusion was observed to pressurize the behaviour of the contaminant in terms of inhibition from other deposited mineral in the formation, such development was experienced in the study, the transport processes were observed to reduce the concentration at different soil formation, despite the fluctuation deposition of the contaminant, the concentration was very low due to an inhibition from diffusion of micrococcus
concentration in the study area, fluctuation were also observed in the transport process, the pressure were from diffusion influences through some other deposited minerals that were also observed to cause more inhibition in the study location. Such condition express fluctuation from the simulation values, the study is imperative because the rate of micrococcus diffusion of contaminant has been expressed in various dimension, experts will definitely apply this techniques as another breakthrough in monitoring transport system of micrococcus
in the study location.Keywords:
Mathematical Model, Micrococcus, High Permeable, Gravel Formation1. Introduction
The rate of Mass flow movement of dissolved ions in water within the soil profile has been observed in various experts, such development like the downward movement due to rainfall and applied irrigation water, or upward movement by water evaporation from the soil surface, with this downward/upward movement occurring in the soil mass through its pores. This are in lined with a the process of diffusion of contaminant in the soil to phreatic bed Diffusion is known to be the movement of ions within water films that exist around soil particles, the driving force being the ion concentration gradient, always moving from an area of high concentration to an area of lower concentration. Most ions in solution are moved by diffusion, the movement occurring in very short distances around and between the soil particles. Development in modeling microbial processes in porous media is necessary to improving our thoughtful of how physical, chemical, and biological processes are attached in groundwater and their effect on groundwater- chemistry evolution, bioremediation, and the reactive transport of contaminants and bacteria [1 - 4]. Much of the emphasis to date
limited and most of the biomass is associated with the solid phase [5, 6, 7, 8, 9, and 10]. In these growth-limited environments, physical processes likely dominate transport of that portion of the biomass in the aqueous phase. In contrast, in nutrient-rich environments, such as contaminated aquifers, field observations consistently indicate a higher level of biomass in the aqueous phase. In a contaminated portion of the Cape Cod aquifer in Massachusetts, USA, [10 - 14] report that the aqueous biomass increased by an order of magnitude, whereas the concentration on the sediments remained approximately the same. [16 -17] observed 130% of total biomass free-living in a sewage-contaminated plume; [18] note that 90% of total biomass in a creosote contaminated aquifer was attached, but 49% of (creosote-degrading) methanogens were in the aqueous phase. Likewise, at an in-situ bioremediation study at the Savannah River Site in Georgia, USA, the proportion of methanotrophs, which were stimulated to degrade chlorinated hydrocarbons, increased by as much as five orders of magnitude in the aqueous phase 15, 17]. These observations are consistent with specific recognition of growth-induced partitioning to the aqueous phase [11-13, 16, 17 and 18]. Such conditions indicate greater propensity for transport of native microbes under natural hydraulic gradients or under pumping as part of an accelerated bioremediation strategy when growth is a factor [15].
2. Governing Equation
2
2 0
d c dc dc
Du Vt Kt
dx dx
dx − + = (1)
(
)
2
2 0
d c dc
Du Vt Kt
dx
dx − − = (2)
Let
0
n n n
C a x
∞ = =
∑
1 1 1 n n nC na x
∞ − = =
∑
(
)
11 2 21 n n n
C n n a x
∞
−
=
=
∑
−(
)
2(
)
12 1
1 n n 0
n n
n n
Du n n a x Vt Kt na x
∞ ∞
− −
= =
− − − =
∑
∑
(3)Replace n in the 1st term by n+2 and in the 2nd term by
n+1, so that we have;
(
)(
)
2(
) (
)
10 0
2 1 n 1 n 0
n n
n n
Du n n a x Vt Kt n a x
∞ ∞
+ +
= =
+ + − − + =
∑
∑
(4)i.e.
(
2)(
1)
n 2(
)(
1)
n 1Du n+ n+ a+ = Vt−Kt n+ a+ (5)
(
)(
)
(
)(
)
12
1 2 1
n n
Vt Kt n a
a
Du n n
+ +
− +
=
+ + (6)
(
)
(
)
12
2
n n
Vt Kt a
a Du n + + − =
+ (7)
For
(
)
12
0,
2
Vt Kt a
n a
Du
−
= = (8)
For
(
)
(
)
22 3
1,
3 2 3
Vt Kt a Vt Kt
n a
Du Du Du
− −
= = =
• (9)
For
( ) ( ) ( ) ( )3
3 1 1
4
2;
4 4 3 2 4 3 2
Vt Kt a Vt Kt Vt Kt a Vt Kt a n a
Du Du Du Du Du Du Du
− − − −
= = = • =
• • • (10)
For
(
)
4(
)
41 5
3;
5 5 4 3 2
Vt Kt Vt Kt a
n a
Du Du Du Du Du
− −
= = =
• • • (11)
For
(
)
11 1 ; ! n n n
Vt Kt a
n a
Du n
−
−
−
− (12)
( )
2 3 4 50 1 2 3 4 5 ... n n
C x = a +a x a x+ +a x +a x +a x + +a x (13)
( ) 2 ( ) 3 ( ) 4 ( )
1 1 1
0 1 2! 3! 2 4! 3 5! 4 ....
Vt Kt a x Vt Kt a x Vt Kt a x Vt Kt a a x
Du Du Du Du
− − − −
= + + + + + + (14)
( ) 0 1 ( ) 2 ( )22 3 ( )3 4 ( )4 5
2! 3! 4! 5!
Vt Kt x Vt Kt x Vt Kt x Vt Kt x C x a a x
Du Du Du Du
− − − −
= + + + + +
(15)
( )
0 1 ( )Vt Kt x Du
C x a a
−
= + ℓ (16)
Subject equation (16) to the following boundary condition
( )
1( )
0
C o = and C o =H
( )
0 1 ( )Vt Kt x Du
C x a a
−
= + ℓ
( )
0 1 0C o = a +a =
i.e.
0 1 0
a +a = (17)
( ) (
)
( ) 1 1 2! Vt Kt x Du Vt KtC x a
Du − − = ℓ
( ) (
)
1 1 2! Vt KtC o a H
Du
−
1
HDu a
Vt Kt
=
− (18)
Substitute (18) into equation (17)
1 0
a = −a
0 HDu a Vt Kt − ⇒ =
− (19)
Hence, the particular solution of equation (16) is of the form:
( )
(Vt Kt)xDu
HDu HDu
C x
Vt Kt Vt Kt
−
= − +
− − ℓ
( )
( ) 1Vt Kt x Du HDu C x Vt Kt − ⇒ = − −
ℓ (20)
3. Materials and Method
Standard laboratory experiment where performed to monitor metrococcous concentration at different formation, the soil deposition of the strata were collected in sequences base on the structural deposition at different locations, this samples collected at different location generated variations at different depth producing different migration of Micrococcus concentration through column experiment at different strata. The experimental results are applied to be compared with the theoretical values for model validation.
4. Result and Discussion
Results and discussion are presented in tables including graphical representation of micrococcus concentration
Table 1. Predictive Values of Micrococcus Concentration at Different Depth.
Depth [M] Micrococcus Concentration [Mg/L]
3 1.04E-03
6 2.19E-03
9 1.10E-03
12 4.40E-03
15 5.50E-04
18 6.61E-04
21 7.70E-04
24 8.81E-05
27 9.91E-05
30 1.10E-07
33 1.21E-07
36 1.32E-07
39 1.43E-07
Table 2. Predictive and experimental values for Micrococcus concentration at Different Depth.
Depth [M] Predictive Micrococcus Concentration [Mg/L]
Micrococcus Experimental Values [Mg/L]
3 1.04E-03 1.10E-03
6 2.19E-03 2.12E-03
9 1.10E-03 1.70E-03
Depth [M] Predictive Micrococcus Concentration [Mg/L]
Micrococcus Experimental Values [Mg/L]
12 4.40E-03 4.80E-03
15 5.50E-04 5.80E-04
18 6.61E-04 6.71E-04
21 7.70E-04 7.90E-04
24 8.81E-05 8.88E-05
27 9.91E-05 9.98E-05
30 1.10E-07 1.70E-07
33 1.21E-07 1.31E-07
36 1.32E-07 1.34E-07
39 1.43E-07 1.45E-07
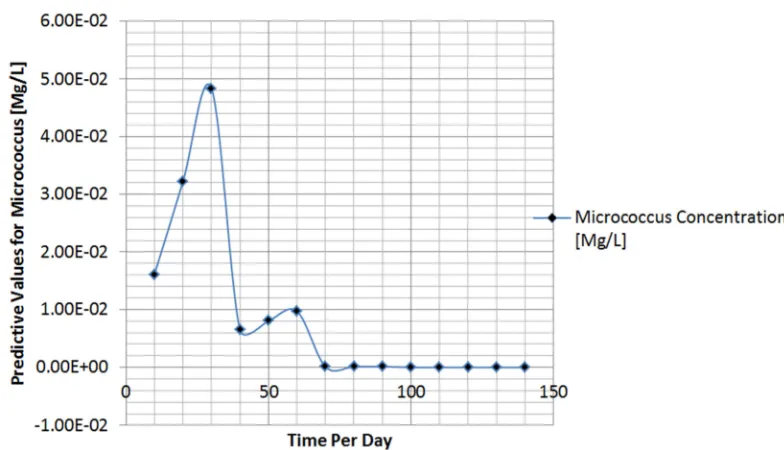
Table 3. Predictive Values of Micrococcus Concentration at Different Time.
Time Per Day Micrococcus Concentration
[Mg/L]
10 1.61E-02
20 3.22E-02
30 4.84E-02
40 6.45E-03
50 8.07E-03
60 9.68E-03
70 1.13E-04
80 1.29E-04
90 1.45E-04
100 1.61E-06
110 1.77E-06
120 1.93E-06
130 2.09E-06
140 2.26E-06
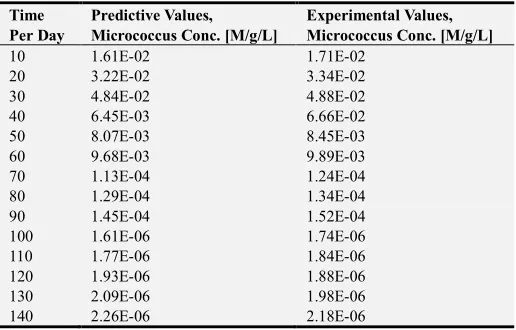
Table 4. Predicted and Measured of Micrococcus Concentration Different Time.
Time Per Day
Predictive Values, Micrococcus Conc. [M/g/L]
Experimental Values, Micrococcus Conc. [M/g/L]
10 1.61E-02 1.71E-02
20 3.22E-02 3.34E-02
30 4.84E-02 4.88E-02
40 6.45E-03 6.66E-02
50 8.07E-03 8.45E-03
60 9.68E-03 9.89E-03
70 1.13E-04 1.24E-04
80 1.29E-04 1.34E-04
90 1.45E-04 1.52E-04
100 1.61E-06 1.74E-06
110 1.77E-06 1.84E-06
120 1.93E-06 1.88E-06
130 2.09E-06 1.98E-06
140 2.26E-06 2.18E-06
Table 5. Predictive Values of Micrococcus Concentration at Different Depth.
Depth [M] Micrococcus Concentration[M/g/L]
3 2.16E-03
6 5.24E-03
9 7.86E-03
12 1.04E-05
15 1.31E-05
18 1.57E-05
21 1.75E-03
24 2.00E-03
27 2.25E-04
30 2.50E-04
33 2.75E-06
Table 6. Predicted and Measured of Micrococcus Concentration Different Depth.
Depth [M] Micrococcus Predictive Values [M/g/L] Micrococcus Experimental Values [M/g/L]
3 2.16E-03 2.34E-03
6 5.24E-03 5.56E-03
9 7.86E-03 7.98E-03
12 1.04E-05 1.15E-05
15 1.31E-05 1.44E-05
18 1.57E-05 1.69E-05
21 1.75E-03 1.86E-03
24 2.00E-03 2.14E-03
27 2.25E-04 2.45E-04
30 2.50E-04 2.66E-04
33 2.75E-06 2.89E-06
36 3.25E-06 3.44E-06
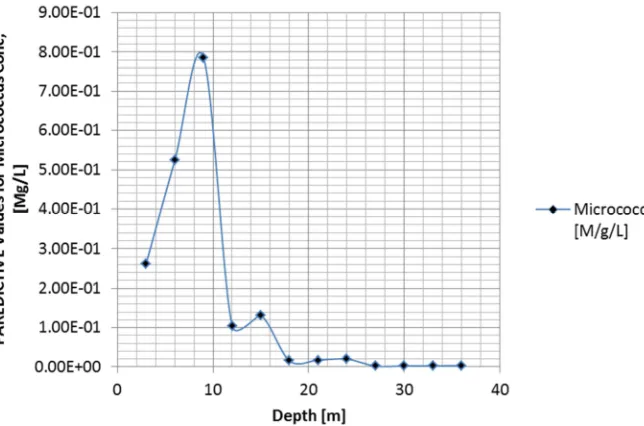
Table 7. Predictive Values of Micrococcus Concentration at Different Depth.
Depth [M] Micrococcus Concentration[M/g/L]
3 2.62E-01
6 5.24E-01
9 7.86E-01
12 1.04E-01
15 1.31E-01
18 1.57E-02
21 1.75E-02
24 2.00E-02
27 2.25E-03
30 2.50E-03
33 2.75E-03
36 3.25E-03
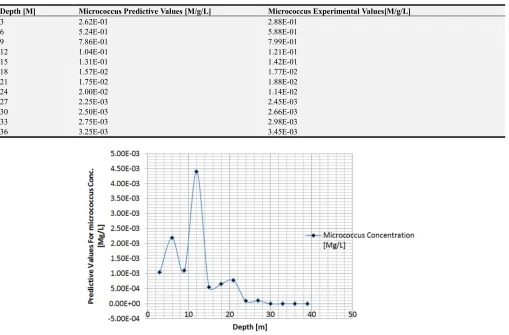
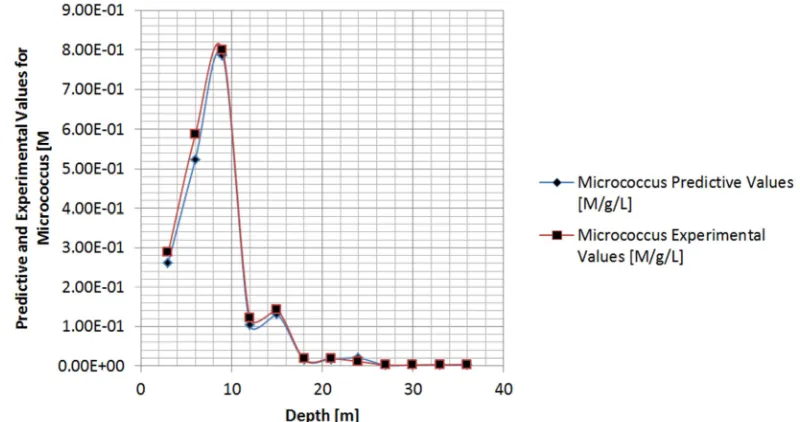
Table 8. Predicted and Measured of Micrococcus Concentration Different Depth.
Depth [M] Micrococcus Predictive Values [M/g/L] Micrococcus Experimental Values[M/g/L]
3 2.62E-01 2.88E-01
6 5.24E-01 5.88E-01
9 7.86E-01 7.99E-01
12 1.04E-01 1.21E-01
15 1.31E-01 1.42E-01
18 1.57E-02 1.77E-02
21 1.75E-02 1.88E-02
24 2.00E-02 1.14E-02
27 2.25E-03 2.45E-03
30 2.50E-03 2.66E-03
33 2.75E-03 2.98E-03
36 3.25E-03 3.45E-03
Figure 2. Predicted values for Concentration Different Depth.
Figure 3. Predicted values for Concentration Different Depth.
Figure 5. Predictive Values of micrococcus Concentration at Different Depth.
Figure 6. Predictive Values of micrococcus Concentration at Different Depth.
Figure 8. Predictive Values of micrococcus Concentration at Different Depth.
The deposition micrococcus has been thoroughly evaluated through graphical representation from the simulation values, the rate of diffusion in the system were observed to affect the deposition of the contaminant in terms of migration process, this were express from the developed simulation values in the study area. The study shows that figure one and two maintained rapid fluctuation where the optimum values were recorded at twelve metres, sudden decrease were observed as it declined to the lowest concentration at thirty metres, but the influencing factor is the variation of diffusion that affected the transport system between the strata through the velocity of flow. These were observed to affect the migration process down to phreatic bed, while figure three and four maintained similar fluctuation process of deposition, the rate of migration at various time were monitor through the rate of velocity on the direction of flow. the deposition of diffusion in the soil structural deposition express fluctuation where the optimum values were recorded at thirty metre, sudden decrease were observed through change in depth, were the lowest were recorded at thirty six metres. The rates of diffusion are reducing the rate of concentration, slight depositions of the contaminant were observed in the transport process inhibited by the rate of diffusion in the strata. while figure five and six also experiences vacillation at different transport process in the study environment, fluctuation were observed on the rate of transport, the diffusion were found to pressure the system fluctuating as expressed in the figures, this development implies that the migration of micrococcus generates direct effect from diffusion rate in those strata, velocity of flow were under heterogeneous deposition as observed in the geological setting in the study environment, such development generated the fluctuation of micrococcus concentration as expressed in figure seven and eight.
5. Conclusion
The study has definitely evaluate the behaviour of
micrococcus as express from the graphical representation, the rate of its depositions and transport level express fluctuation were the higher values are normally observed at the shallow depth between three to twelve metres and the lowest level deposited between thirty and thirty nine metres, the behaviour of the contaminant were found diffused by some other deposited minerals, slight migration were observed in the transport process due to inhibition of the minerals deposited in the formation, the study has express influences form diffusion in the transport of micrococcus, thus the structural setting are base on geomorphology and geochemistry deposit in the formation. There is no doubt that the rate of deposition has definitely evaluate the influences from diffusion in various rate of micrococcus in the study area. The developed model generated simulation values expressing the behaviour of the contaminant in the system, thus the level of diffusion impact on the transport process of the contaminant. Sight deposition observed has express the rate of inhibition from other deposited minerals, formation characteristics may also have generate slight impact on the transport process, these study has thoroughly examined the rate of effect from diffusion on migration of micrococcus in the study location.
References
[1] Albrechtsen H-J (1994) Distribution of bacteria, estimated by a viable count method, and heterotrophic activityin different size fractions of aquifer sediment. Geomicrobiol J 12:253– 264.
[2] Ellyn M. Murphy and Timothy R. Ginn (2000) Modelling microbial processes in porous media Hydrogeology Journal 8:142–158.
[4] Harvey RW, Smith RL, George L (1984) Effect of organic contamination upon microbial distributions andheterotrophic uptake in a Cape Cod, Mass., aquifer. Appl Environ Microbiol 48:1197–1202.
[5] Harvey RW, George LH, Smith RL, LeBlanc DR (1989) Transport of microspheres and indigenous bacteriathrough a sandy aquifer: results of natural- and forced-gradient tracer experiments. Environ SciTechnol 23:51–56.
[6] Harvey RW, Kinner NE, MacDonald D, Metge DW, Bunn A (1993) Role of physical heterogeneity in theinterpretation of small-scale laboratory and field observations of bacteria, microbial-sized microsphere, and bromidetransport through aquifer sediments. Water Resour Res 29:2713–2721.
[7] Harvey RW, Kinner NE, Bunn A, MacDonald D, Metge D (1995) Transport behavior of groundwater protozoaand protozoan-sized microspheres in sandy aquifer sediments. Appl Environ Microbiol61:209–217.
[8] Hornberger GM, Mills AL, Herman JS (1992) Bacterial transport in porous media: evaluation of a model usinglaboratory observations. Water Resour Res 28:915–938 [9] Jenneman GE, McInerney MJ, Knapp RM (1985) Microbial
penetration through nutrient-saturated Bereasandstone. Appl Environ Microbiol 50:383–391.
[10] Jenneman GE, McInerney MJ, Crocker MF, Knapp RM (1986) Effect of sterilization by dry heat or autoclavingon bacterial penetration through Berea sandstone. Appl Environ Microbiol 51:39–43.
[11] Godsy EM, Goerlitz DF, Grbic-Galic D (1992) Methanogenic
biodegradation of creosote contaminants innatural and simulated ground-water ecosystems. Ground Water 30:232– 242.
[12] Champ DR, Schroeter J (1988) Bacterial transport in fractured rock: a field-scale tracer test at the Chalk RiverNuclear Laboratories. Water Sci Technol 20:81–87.
[13] Hirsch P, Rades-Rohkohl E (1988) Die Vielfalt mikrobieller Mosrphotypen im Grundwasservereich des Segeberger Forstes. Z Dtsch Geol Ges 139:343–353.
[14] Kölbel-Boelke J, Anders E, Nehrkorn A (1988) Microbial communities in the saturated groundwaterenvironment II: diversity of bacterial communities in a Pleistocene sand aquifer and there in vitro activities. MicrobEcol16:31–48. [15] Reynolds PJ, Sharma P, Jenneman GE, McInerney MJ (1989)
Mechanisms of microbial movement insubsurface materials. Appl Environ Microbiol55:2280–2286.
[16] Sharma PK, McInerney MJ, Knapp RM (1993) In situ growth and activity and modes of penetration ofEscherichia coli in unconsolidated porous materials. Appl Environ Microbiol 59:3686–3694.
[17] Tan Y, Gannon JT, Baveye P, Alexander M (1994) Transport of bacteria in aquifer sand: experiments andmodel simulations. Water Resour Res 30:3243–3252.