Published online June 20, 2013 (http://www.sciencepublishinggroup.com/j/earth) doi: 10.11648/j.earth.20130203.12
Seismic slope stability of the Tipaimukh Dam of
north-eastern India: A numerical modelling approach
Md. Rafiqul Islam
*, Mohammed Omar Faruque
Dept. of Petroleum & Mining Engineering, Shahjalal University of Science & Technology, Sylhet-3114, Bangladesh
Email address:
[email protected](M. R. Islam)
To cite this article:
Md. Rafiqul Islam, Mohammed Omar Faruque. Seismic Slope Stability of the Tipaimukh Dam of North-Eastern India: A Numerical Modelling Approach. Earth Science. Vol. 2, No. 3, 2013, pp. 73-87. doi: 10.11648/j.earth.20130203.12
Abstract:
This article represents the seismic slope stability analysis of earth core rock-fill Tipaimukh Dam under static and dynamic loading conditions. The Tipaimukh area is located at the triple junction of the three continental plates- Indian, Eurasian and Burmese tectonic plate. The area is frequently interrupted by unanticipated geological discontinuities, such as regional and local-scale faults and fractures that behave as a strike-slip and extensional movements. Two kinds of numerical models (A and B) are presented here. Both models consist of five zones and each zone has individual rock mechanical characteristics. Model A assumes safety factor of dam slope associated with impervious core including clay material. Model B assumes also safety factor associated with masonry wall as an impervious core. The present numerical modeling results reveal that under static condition of the dam the safety factor ranges from 2.56 to 2.69. On the contrary, under seismic/dynamic loading conditions associated with earthquake M6.0 to M8.5, the safety factor ranges from 1.60 to 0.98 for model A, and from 1.66 to 0.98 for model B. The past records of the historical earthquakes in north-eastern India reveal that the recurrence period of intensive magnitude earthquakes, as experienced in Assam, Shillong plateau and Manipur area, is 38 to 53 years. The calculated safety factor of the Tipaimukh Dam implies that the dam would be destroyed if it would be affected by earthquakes magnitude over 7.0 throughout its operational life, which is usually extent from 50 to 100 years.Keywords:
Tipaimukh, Earth & Rockfill Dam, Regional Seismicity, Numerical Modeling, Safety Factor1. Introduction
The earth and rock-fill dam has been constructed in different parts of the world with increasing frequency in the last few decades. Earth and rock-fill dams have been essentially constructed and utilized for the hydroelectricity generation, flood control, navigation, tourism, fishery and irrigation projects. The government of India wishes to construct a 163 m height (someone says 178 m) earth core rock-fill dam (ECRD) on the Barak riverbed section at the Tipaimukh area of Manipur State of north-eastern India (Figs.1ab). Earth core rock-fill dams having different heights have been constructed in several areas of the world. For example, the Nurek Dam which is 317 m height was completed in Tajikistan. The dam was constructed on the Vakhsh river. The Tehri Dam with a height of 261 m was constructed on the Bhagirati river of Uttarkhand province of India, which is the highest dam of the country. The Guavio Dam with a height of 243 m was constructed on the Guavio river of Colombia. A crest length of the dam was 390 m. The Mica Dam was built to a height of 244 meters above bedrock
of the Columbia River of Canada. The La Esmeralda Dam with a central core rock-fill material was built to a height of 237 m on the Bata river of Colombia. The 230 m high Oroville Dam, which is the tallest dam in the USA, was built on the Feather river section of California. The Shuibuya Dam with a height of 233 m was constructed on the Qingjiang river of China in 2002. The Kurobe dam and Takase dam with a height of 186 m and 176 m, respectively, were constructed in Japan [1], the Masjeid Soleyman dam with a height of 177 m was built up in Iran [2].
dam structures must be adequate to determine stability of the foundation and abutments. Foundation rock characteristics such as dip of bedding, fissures, orientation of joints, clay seams, gouge zones, and faults which may affect the stability of rock foundations and slopes must be investigated. Knowledge of the regional seismic source and local geology is essential in developing plan. To meet the dam safety, the dam, foundation and abutments must be stable under all static and dynamic (seismic) loading conditions [4]. So, seismic slope stability analysis of high earth and rockfill dam is very essential.
Although several studies regarding massive damage to rock-fill dams have been reported; however, the potential risk of seismic effect still has aroused public deep concerns because the failure of dam can become critical threat to public safety [5]. Therefore, understanding the seismic behaviors of earth core rockfill dam [6], like- Tipaimukh Dam of eastern India, under static and dynamic loading conditions is very important. The Tipaimukh area is one of the high seismic zones of the world (Fig. 2a). The area (Fig.1a) is located at a triple junction of three continental plates, like- Indian, Eurasian and Burmese plate. Focal mechanism solution (Fig. 2b) data shows that the epicenters of the past earthquake events were relatively shallower around the Tipaimukh area.
The purpose of present study is to illustrate a two-dimensional FEM computation analysis of earth core rockfill dam (ECRD) at the Tipaimukh area in order to verify the slope stability of the dam under static and seismic loading conditions. The analysis is performed by using the Slide2 software. For the purpose of the analysis there was developed a 3D schematic model of dam foundation system across the Barak riverbed. The cross-section of the dam and its foundation is modeled by 2D finite elements. The cross-section of rockfill dam is designed based on slope stability, which means damage by sliding of the dam body for lateral seismic force (as scale of usual earthquake motions). There were considered main and specific combintions of loads consisting of water pressure of the reservoir, self-weight of the structure and seismic action.
2. Location of the Tipaimukh Dam
The proposed Tipaimukh Dam is to be located 500 meters downstream from the confluence of Barak and Tuivai rivers (Fig. 1b), and lies on the south-western corner of Manipur State of north-eastern India, 24°14/N and 93°1.3/E approximately. The Tipaimukh Dam site has been chosen at the highest risk seismically hazardous zone [10].
Figure 1a. Geotectonic location of the Tipaimukh Dam of north-eastern India [7]
Figure 1b. Location of dam across the Barak riverbed, Tipaimukh, Manipur, India
Figure 2b. Focal mechanism data of the past earthquakes in and around the Tipaimukh area
3. Regional Geotectonic Setting,
Seismicity, Geology and Rock
Characteristics
3.1. Regional Geotectonic Setting
The northeast Indian region presents a complex tectonic province associated with juxtaposition of two mobile belts, like- (i) the E–W trending Himalaya, and (ii) the N–S trending Arakan-Yoma Mountains belt developed as a consequence of collision between the Indian and the Eurasian plates (Fig. 1a), and the underthrusting of the Indian plate below the Myanmar plate, respectively [11]. The major tectonic setup can be divided into (i) the Himalaya structures, (ii) the Mishmi massif, (iii) the Indo-Myanmar arc, (iv) the Brahmaputra valley, and (v) the Shillong plateau [12]. The Tipaimukh area is an integral part of the Indo-Myanmar range that lies in the boundary region of the Indian, Eurasian and Myanmar plates having typical interaction nature. The Tipaimukh area was particular evolved due to the interaction between the Indian and Myanmar plates rather than Indian and Eurasian (China) plates under a simple shear deformation mechanism [10].
3.2. Seismicity
Literatures review reveals that there are six major seismically active zones of the world that includes California, North-East India, Japan, Mexico, Taiwan and Turkey. Seismicity of northeast India is one of the highest earthquake potential area in the world due to its tectonic setting i.e. subduction as well as collision plate convergence. Analysis and location of earthquake epicenters (Fig. 2a), focal mechanism data (Fig.2b) and magnitudes of 5M and above within 100-200km radii of Tipaimukh dam site reveals hundreds of earthquakes in the last 100-200 years. It is found
that within 100 km radius of Tipaimukh, 2 earthquakes of +7M magnitude have taken placed in the last 150 years and the last one being occurred in the year 1957 at an aerial distance of about 75 km from the dam site in the ENE direction. Majority of the earthquakes that takes place on the western side of Manipur are shallow (50km focal depth or less) which is due to the tectonic setting of the Indo-Myanmar Range. It is reasonable to mention that the seismic activity associated with shallow depth earthquakes are far more disastrous than the deeper ones even if magnitude is relatively low since destructive surface waves can be quickly and easily propagated from the focus/epicenter [10].
According to the seismic zonation map of India, the northeast Indian region including Tipaimukh area has been placed in zone V, which is the highest level of seismic hazard potential [13, 14] area not only for India but also for northeast region of Bangladesh. Historical records of two great destructive earthquakes that made tremendous effect in the northeast region of Bangladesh are- (i) 1897 Shillong Earthquake, and (ii) 1950 Assam Earthquake in the region. The Global Seismic Hazard Assessment Program (GSHAP) also classifies the region in the zone of high seismic risk with peak ground acceleration rising to the tune of 0.35–0.4g [14, 15].
3.3. Geological structures, Stratigraphy and Rock Characteristics
The entire Manipur region has compression tectonic characteristics in the WNW-ESE direction while extension lies in the NNE-SSW direction. As a result, geological structures such as folds, reverse and thrust faults oriented parallel to NNE-SSW direction suffers maximum compression and shortening. In contrast, geological structures such as normal faults, tension fractures and joints running parallel to the WNW-ESE direction undergo maximum extension. Geological structures lying in the NW-SE and NE-SW quadrants will have strike-slip movement. Therefore, the faults and fractures around Tipaimukh Dam axis belong to the category that may undergo strike-slip and extensional movements [10].
A generalized stratigraphic succession of north-eastern India (from the Recent to Eocene age) is as follows
[16]-• Lower Level Alluvium of the Recent age that consists of sand, silt and clay
• Older Alluvium of Middle to Upper Pleistocene age which is composed of sand, clay, pebble, gravel and boulder deposit.
• Dihing Formation (900m) of Dihing Group of Pliocene age that comprising of pebble beds, soft sandy clay, clay, conglomerate, grit and sandstone.
• Namsang Formation (Upper Assam: 800 m) of Mio-Pliocene age. The formation consists of coarse, gritty, poorly consolidated sandstone and conglomerate with coal pebbles.
• Girujan Clay Formation of Tipam Group of Miocene age. The maximum thickness of the formation is about 1800m. The formation is represented by mottled clay, sandy shale and subordinate mottled, coarse to gritty sandstone.
• Tipam Sandstone Formation (2300m) of Surma Group of Miocene age. The comprising mainly bluish grey to greenish, coarse to gritty, false bedded, ferruginous sandstone, clay, shale and conglomerate.
• Bokabil Formation (900 to 1800m) of SurmGroup of Miocene age. Lithology mainly shale, sandy shale, siltstone, mudstone and lenticular, coarse ferruginous sandstone.
• Bhuban Formation (1400 to 2400m) of Surma Group of Miocene age. Lithology mostly alternations of sandstone and sandy shales and thin conglomerate, argillaceous in middle part.
• Renji Formation (600 to 1000m) of Barail Group of Oligocene age. Lithology mainly massive bedded sandstone.
• Jenam Formation (1000 to 3300m) of Barail Group of Oligocene age. Lithology mainly shale, sandy shale, and carbonaceous shale with inter-bedded hard sandstone.
• Laisong Formation (2000 to 2500m) of Barail Group of Oligocene age. Lithology mainly well-bedded compact flaggy sandstone and subordinate shale.
• Upper Disang Formation of Disang Group of Middle to Upper Eocene comprising mainly of Shale, siltstone, gray-wacke with rhythmite olitrostome with fossils and slices of ophiolitic rocks.
• Lower Disang Formation of Disang Group of Upper to Lower Eocene comprising mainly of shale, graywacke with rhythmites and minor sandstone bands.
A generalized stratigraphic succession of rocks in Manipur State shows that Tipam Sandstone Formation, Bokabil Formation, and Bhuban Formation are the dominant rock type in the Tipaimukh dam site [17]. Tipaimukh and its adjoining areas are basically made up of Surma Group of rocks. The rocks of Surma Group are mainly light grey to brownish grey generally medium to coarse-grained sandstones having occasional shale and silt/sand intervening bands between massive to thickly bedded sandstones (Figs. 3abc). Conglomeratic (loosely cemented pebbles and gravel)) horizon at the base of Bhuban Formation, can be observed in the field easily due to its wide areal extent. Like Barails, Surma Group of rocks is also marked by primary structures such as cross bedding, ripplemarks, etc. All these geologic features, lithocharacters as well as primary structures suggest a different depositional environment from that of the Disangs and Barails. The rocks of Surma Group are well characterized by folds and faults having regional strike similar to that of
the Barails i.e. NNE-SSW. Fractures (Figs. 3ab) are also well developed which have close relationship with the topographic features and drainage patterns [10]. As shown in Fig.3c, the geological discontinuities within rock strata of the Tipaimukh Dam area indicate caustic earthquakes events associated with intensive magnitudes that occurred in the past. Literatures review reveals that earthquakes do not occur on a single surface, but rather on a fractal structure of many closely correlated faults through rock strata [18]. Earthquakes generally occur along the fault/fracture zones or material heterogeneities present in the crust. The distribution of faults or fractures in the crust possesses a fractal structure [19]. The seismically active crust of the Earth is dissected by arrays of faults which exhibit fractal statistics both in the distribution of surface roughness and in their length distributions [20].
4. An Overview of Slope Stability
Analysis
Slope stability is the resistance of inclined surface to failure by sliding or collapsing. Conventional methods for rock slope stability analysis can be divided into three groups: (i) kinematic analysis, (ii) limit equilibrium, and (ii) rock fall simulators. Limit equilibrium analysis has traditionally been used to assess the stability of slopes. Computer-based programs for most of the slope stability analysis are established on the limit equilibrium concept for a two-dimensional or three-dimensional model [4].
Figure 3b. Medium to coarse-grained sandstones having occasional shale and siltstone
Figure 3c. Massive failure of rock due to strong earthquakes
4.1. Limit Equilibrium Methods
The limit equilibrium method is the most popular approach in slope stability analysis. This method is well known to be a statically indeterminate problem, and assumptions on the inter-slice shear forces are required to render the problem statically determinate. The limit equilibrium methods investigate the equilibrium of the soil mass tending to slide down under the influence of gravity. Transitional or rotational movement is considered on assumed or known potential slip surface below soil or rock mass. All methods are based on comparison of forces (moments or stresses) resisting instability of the mass and those that causing instability (disturbing forces). Two-dimensional sections are analyzed assuming plain strain conditions. These methods assume that the shear strengths of the materials along the potential failure surface are governed by linear or non-linear relationships between shear strength and the normal stress on the failure surface. Analysis provides a factor of safety. If the value of factor of safety is less than 1.0, slope is unstable [4]. The limit equilibrium method can be broadly classified into two main categories: (i) ‘simplified’ methods, and (ii) ‘rigorous’ methods. For the simplified methods, either force or moment
equilibrium can be satisfied but not both at the same time. For the rigorous methods, both force and moment equilibrium can be satisfied, but usually the analysis is more tedious and may sometimes experience non-convergence problems.
4.2. Dam Slope Stability Associated with Earthquakes
The earthquake is one of the main triggers that can easily induce collapse of dam slope, which could result in serious damage to life and property. Possible damaging effects of earthquakes on earth and rock-fill dams include: (i) slope failure, (ii) fault displacement or reactivation, (iii) crest settlement, and (iv) permanent deformation of foundation soils or dam body etc. Earthquake damage to dam can be due to actual ground rupture beneath the dam seismic shaking. Failure of a dam due to ground rupture is possible only when the dam is built over an active fault zone [3], like Tipaimukh area of north-eastern India.
It is well-known to the geoscientists and geotechnical engineers that slope movement or failure is secondary effect of earthquake. There can be several types of earthquake-induced slope movement. For rock slopes, earthquake-induced slope movement is divided into falls and slides. Falls have relatively free falling nature of rocks due to earthquake. In slides, there is shear displacement along a distinct failure surface due to earthquake. Slope can be subjected to flow slide or lateral spreading during earthquake [21]. According to an expected mode of failure, slope may be classified into two categories: (i) translational slope failure, and (ii) rotational slope failure. High-strength rock slope failures initially are rigid-body, like translational or lateral motions, while low-strength soil or rock slopes, like rock-fill dams, often begin to fail in rigid-body like rotational or circular motions [22].
There are at least four different formulations of the seismic slope stability analysis problem. These are in terms of (i) the factor of safety F, (ii) the critical seismic coefficient kc, (iii) the permanent displacement D, and (iv) the shape of slip surface. In order to solve these problems, several methods can be used in evaluating the stability of slopes subject to earthquake loading. These methods can fall into three generalized categories, like- (i) pseudo-static method, (ii) permanent displacement method, and (iii) stress-strain method. Each of these types of analysis has strengths and weaknesses, and each can be appropriately applied in different situations [23].
examples where material experience sufficient shear strength reduction during earthquake. Weakening slope stability analyses is preferred for them. There are two common methods in slope stability analysis, like- (i) Pseudo-static and (ii) Newmark [21].
4.3. Pseudo-Static Method
The method is easy to understand and is applicable for both total and effective stress slope stability analyses. The method ignores cyclic nature of earthquake. It assumes that additional static force is applied on the slope due to earthquake. In actual analysis, a lateral force acting through centroid of sliding mass is applied which acts in out of slope direction. Earthquake subjects sliding mass in general to vertical as well as horizontal pseudo-static forces. Since vertical pseudo-static force on sliding mass has very little effect on its stability, it is ignored.
4.3.1. Method of Slices
The method of slices is a method for analyzing the stability of a slope in two dimensions. In this method, failure is assumed to occur by sliding a ‘rigid mass’ on a non-circular or circular slip surface. The sliding mass above the failure surface is subdivided into a number of vertical slices and factor of safety is determined based on force equilibrium equations. The resisting and the driving forces are calculated for each slice and then summed to obtain factor of safety of the slope. Bishop simplified is the most popular method. However, Janbu simplified, Janbu generalized, Spencer method and Morgenstern-Price method are other methods of slices. Because of the tedious nature of calculations, computer programs are routinely used to perform the pseudo-static slope stability analysis using the method of slices [21].
4.3.2. Bishop's Simplified Method
The Bishop method is one of the most popular slope stability analysis methods and is used worldwide. This method satisfies only the moment equilibrium, but not the horizontal force equilibrium, and it applies only for a circular failure surface. The centre of the circle is taken as the moment point in the moment equilibrium. The use of the Bishop method to the non-circular failure surface is generally not recommended because of the unbalanced horizontal force problem. This method can be important for problems with loads from earthquake. It is an extension of the method of slices. By making some simplifying assumptions, the problem becomes statically determinate and suitable for hand calculations. In Bishop's simplified method, although failure is also assumed to occur along a circular slip surface, however, the inter-slice forces in horizontal direction are considered, i.e. forces on the sides of each slice are horizontal. It considers the overall moment equilibrium. The present simulation regarding slope stability of the Tipaimukh Dam uses Bishop simplified method of slices. The purpose of slope stability analysis is estimation of a factor of safety for the considered slope and slide mass. A
limit equilibrium factor of safety of 1.0 is usually considered acceptable in the pseudo-static seismic slope stability assessment.
5. Construction of Earth and Rock-Fill
Dams
5.1. Earth Dams
An earth dam is composed of suitable soils obtained from borrow areas or required excavation and compacted in layers by mechanical means. Following preparations of a foundation, earth from borrow areas and from required excavations is transported to the site, dumped, and spread in layers of required depth. The soil layers are then compacted by tamping rollers, sheepsfoot rollers, heavy pneumatictired rollers, vibratory rollers, tractors, or earth-hauling equipment [4].
5.2. Rock-Fill Dams
Figure 4. Schematic view of an earth and rock-fill dam through a hilly region [24]
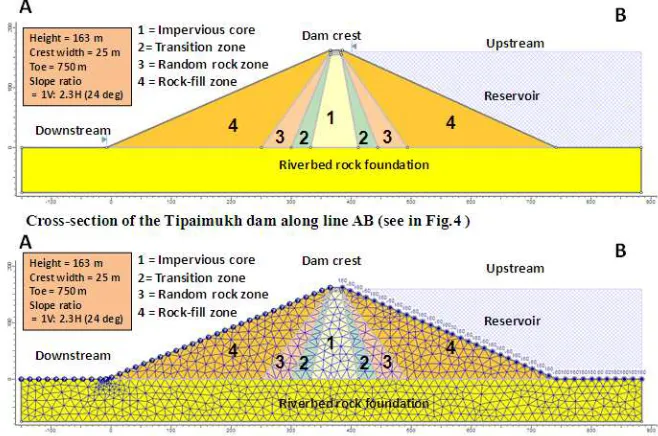
Figure 5. (a) upper: Schematic view of the dam section with different zones, (b) lower: model mesh and boundary conditions.
Figure 6b. Safety factor of the Tipaimukh Dam without earthquake effects (model B)
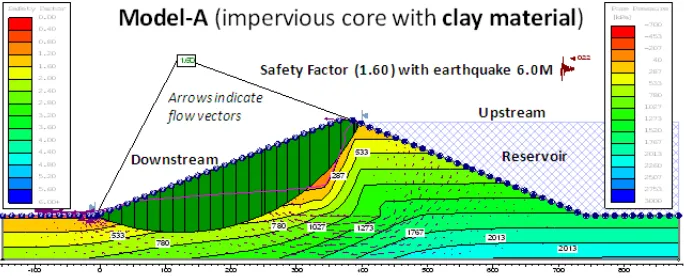
Figure 7a. Safety factor of the Tipaimukh Dam with earthquake magnitude 6.0 (model A)
Figure 7b. Safety factor of the Tipaimukh Dam with earthquake magnitude 6.0 (model B)
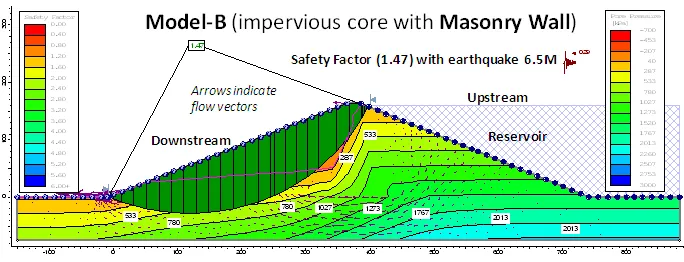
Figure 8b. Safety factor of the Tipaimukh Dam with earthquake magnitude 6.5 (model B)
Figure 9a. Safety factor of the Tipaimukh Dam with earthquake magnitude 7.0 (model A)
Figure 9b. Safety factor of the Tipaimukh Dam with earthquake magnitude 7.0 (model B)
Figure 10b. Safety factor of the Tipaimukh Dam with earthquake magnitude 7.5 (model B)
Figure 11a. Safety factor of the Tipaimukh Dam with earthquake magnitude 8.0 (model A)
Figure 11b. Safety factor of the Tipaimukh Dam with earthquake magnitude 8.0 (model B)
Figure 12b. Safety factor of the Tipaimukh Dam with earthquake magnitude 8.5 (model B)
6. Numerical Modeling
The finite element method (FEM) model was constructed based on a cross-section along AB (please see in Fig. 4) of the dam. The width of the dam crest is 25 m with a length 363 m. The toe of the simplified model is extended up to 750 m (Fig.5a). It is a huge earth dam (rock-fill with central impervious core) with a height of about 163 m. Therefore, the calculated slope ratio of the Tipaimukh Dam is 1V:2.3H (24o). The model consists of five zones associated with different rock mechanical characteristics. The zones are: (i) impervious core, (ii) transition zone, (iii) random rock zone, (iv) rock-fill zone, and (v) riverbed rock foundation. Two models (A and B) have been presented here. The basic difference between the two models is only in rock mechanical parameter associated with impervious core. Usually, clay-dominant material is used as impervious core in earth and rock-fill dam. However, in some dams of India, masonry wall has been used as impervious core in the past. In the present modeling, a 160 m height water column has been considered at the upstream of the model as a reservoir. Therefore, combinations of three loads consisting of water pressure of the reservoir, self-weight of the structure and seismic action were considered at the time of calculation.
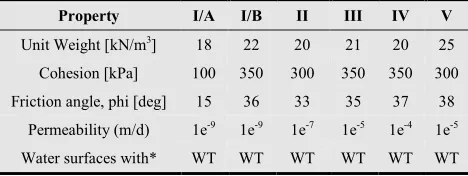
Analysis type of the two-dimensional model was plane strain conditions considering the Gaussian Elimination. Upper surface of the model is almost free in all directions. Other three boundaries, the bottom, left and right hand sides of the model are fixed by both axes (Fig.5b). We have applied a computer-based program Slide2 software package (www.rocscience.com), where Bishop’s simplified Method, as discussed in section 4.3.2, has been integrated to determine the safety factor of the dam slope. Applied rock mechanical parameters are shown in Table 1. The three rock-mechanical parameters for individual zones are – unit weight, cohesion, and friction angle. Permeability and pore fluid unit weight are also shown in Table 1.
Table 1. Rock mechanical parameters used in model A and B
Property I/A I/B II III IV V
Unit Weight [kN/m3] 18 22 20 21 20 25
Cohesion [kPa] 100 350 300 350 350 300
Friction angle, phi [deg] 15 36 33 35 37 38
Permeability (m/d) 1e-9 1e-9 1e-7 1e-5 1e-4 1e-5
Water surfaces with* WT WT WT WT WT WT
Abbreviations: I/A = Impervious core of model A, I/B = Impervious core of model B, II = Transition zone, III = Random rock zone, IV = Rock-fill zone, V = Riverbed, WT = Water Table, *pore fluid unit weight 9.81 kN/m3
7. Model Results
Results of the numerical modeling are illustrated in Figs. 6 to 12. The modeling results are presented in terms of safety factor associated with static and dynamic loading condition. Fig.6 represents safety factor of dam slope without considering the seismic effect. In contrast, Figs.7 to 12 represent safety factor of dam slope taking into account the seismic effect with variable Richter magnitudes. The seismic loading in the both models (Fig.7ab-12ab) were applied with respect to the Richter magnitudes of M6.0, M6.5, M7.0, M7.5, M8.0, and M8.5, which correspond to the horizontal peak ground acceleration (PGA) values of 0.22, 0.29, 0.37, 0.45, 0.50, and 0.56, respectively (Table 2).
Table 2. Seismic intensity scales vs Peak Ground Acceleration (PGA) (website: http://mercallixii.com/information/15-the-richter-scale.html [as per March 31, 2012]
Richter magnitude (M) PGA (g) Duration (seconds)
5.0 0.09 2
5.5 0.15 6
6.0 0.22 12
6.5 0.29 18
7.0 0.37 24
7.5 0.45 30
8.0 0.50 34
The maximum earthquake event in the past around the Tipaimukh area was 8.7 magnitudes [27]. We started our modeling calculation considering the static (without earthquake effect) conditions of the dam slope, where the safety factor were 2.56 (Fig.6a) and 2.69 (Fig. 6b) for model A and model B, respectively. Subsequent to applying the seismic loading on the both models, the safety factor was reduced to 1.60 (Fig.7a) and 1.66 (Fig.7b); 1.42 (Fig.8a) and 1.47 (Fig.8b); 1.26 (Fig.9a) and 1.30 (Fig.9b); 1.12 (Fig.10a) and 1.16 (Fig.10b); 1.05 (Fig.11a) and 1.09 (Fig.11b); and 0.98 (Fig.12a) and 0.98 (Fig.12b) associated with earthquake Richter magnitudes of M6.0, M6.5, M7.0, M7.5, M8.0, and M8.5, respectively. A summary of the entire calculation results has been presented in Table 3.
Table 3. Outline of the calculated safety factor of the Tipaimukh Dam
Model A Model B Commentary
Figures serial Safety factor Figures serial Safety
factor With respect to table 2 Fig. 6a 2.56 Fig. 6b 2.69 Without earthquake effects
Fig. 7a 1.60 Fig. 7b 1.66 Earthquake with 6.0 magnitude
Fig. 8a 1.42 Fig. 8b 1.47 Earthquake with 6.5 magnitude
Fig. 9a 1.26 Fig. 9b 1.30 Earthquake with 7.0 magnitude
Fig. 10a 1.12 Fig. 10b 1.16 Earthquake with 7.5 magnitude
Fig. 11a 1.05 Fig. 11b 1.09 Earthquake with 8.0 magnitude
Fig. 12a 0.98 Fig. 12b 0.98 Earthquake with 8.5 magnitude
8. Discussion and Conclusions
8.1. Factor of Safety of Earth and Rock-Fill Dams
According to the US Army Corps of Engineers, for the case of dam safety analysis associated earthquake loading, the minimum required factor of safety for new earth and rock-fill dams with a height over 16 m should be 1.3 at the end of construction and the safety factor value should be applied for both the upstream and downstream slopes. For the long-term (steady state seepage, maximum storage pool, spillway crest or top of gates) the minimum required factor of safety should be 1.5 to the downstream slope [28].
The present numerical modeling results reveal that the safety factor of the downstream slope of the Tipaimukh Dam ranges from 1.60 to 1.66 with an earthquake magnitude 6.0 (Fig.7ab and Table 3). However, the calculated values are gradually reducing with increasing earthquake magnitudes (see in Figs. 8-12 and Table 1). Calculation results imply that the Tipaimukh Dam would be vulnerable with an earthquake magnitude of 6.5. The dam would experience a very critical situation with an earthquake magnitude of 7.0. The dam would be partially collapsed over earthquakes magnitude of 7.0 and full collapse would be happened with earthquake magnitude from 7.5 to 8.5 or over.
Now it is necessary to review the records of historical earthquakes of the area. As mentioned before, the two most
devastating seismic events in the north-eastern Indian region are- (i) the great Shillong earthquake with M 8.7 that occurred in 12 June 1897 [29], and (ii) the great Assam earthquake with M 8.7 that occurred in 15 August 1950. The Shillong earthquake, or the great Indian earthquake, occurred beneath the Shillong plateau (Fig.1). Isoseismal map of the 1897 Shillong earthquake [27] reveal that the earthquake was widely felt and the present Tipaimukh area was highly affected by the Shillong earthquake in 1897. The 1897 earthquake having magnitude 8.7 had shaken Assam, India, Bhutan, Bangladesh and western Myanmar. An area of more than 300,000 km2 was severely affected. The Brahmaputra and lower Ganges river valleys of eastern India and Bangladesh were devastated [29, 30].
The great Assam earthquake was instrumentally a well recorded earthquake, the assigned magnitude M 8.7 and the focal depth 20 km was well determined [31]. The 1950 great Assam earthquake occurred at the strike-slip fault system [32]. The Indo-Myanmar arc has been associated with 1988 Manipur earthquake of M7.2 [33]. Based on the records of frequency of occurrence of earthquakes up to 1900, it is observed that the earthquake M8 and higher may occur 1 per year, 7 to 7.9 magnitudes may occur 15 times per year, and 6 to 6.9 magnitudes earthquake may occur 134 times per year [34]. The review reveals that the 1950 great Assam earthquake occurred after 53 years of the 1897 Shillong earthquake and the 1988 Manipur earthquake occurred after 38 years of the great Assam earthquake. It is well-known to the geoscientists, seismologists and geotechnical engineers that the operational life of earth and rock-fill dam is usually 50 to 100 years. So, the recurrence period of intensive magnitude earthquakes in north-eastern India associated with the calculated safety factor of the
Tipaimukh Dam slope imply that the dam would be destroyed entirely during its operational life, if it is felt seismic shaking like Assam and Shillong earthquake with magnitude 8.7.
8.2. Dam Failure Associated with Earthquakes
The failure of earth and rock-fill dams associated with earthquake events can be categorized as follows: (i) failure due to regional strong earthquake effects, (ii) earthquake-induced reactivation of unknown faults that are located beneath the dam structures, and (iii) reservoir-induced seismicity that may cause reactivation of faults beneath the reservoir.
they were concentrated predominantly at the level of the change in the slope of the downstream face [35]. The Shih-Kang weir is located at the Da-Jia River in Taiwan. On September 21, 1999, the concrete weir was severely damaged during the magnitude 7.3 of Chi-Chi earthquake. The Shih-Kang weir was destroyed by fault movements due to earthquake. The Bhuj Earthquake with a magnitude 7.7 occurred on January 26, 2001. The epicenter was located about 65 km East of Bhuj town in Kachchh district, Gujarat State, India. 245 earthen dams, most of them with a height of less than 15 m and built on soil, were damaged. The main features of the damage were deformations and cracks due to liquefaction and slope movements. Most of the dams in the region were constructed in the 1950s and 1960s without considering seismic effects in the design [36].
It is well established that large dams can trigger earthquakes through what is called reservoir-induced seismicity (RIS). Reservoirs can increase the frequency of earthquakes in areas of high seismic activity, and can cause earthquakes to happen in areas that were thought to be seismically inactive. Reservoir-Induced Seismicity (RIS) is thought to occur in two ways: (i) by the added weight of a reservoir and (ii) by the water that seeps into cracks underground or along a fault. In the first case, the filling of a reservoir with millions, even billions, of tons of water can add stress to faults, causing them to rupture. In this case, the load effect is immediate. This can cause some reservoirs to begin triggering earthquakes years after the first impounding. In the second case, water seeps into the rock and changes the fluid pressure in micro-cracks and fissures in the ground under and near a reservoir [37].
Some examples of reservoir-induced seismicity (RIS) of dams are as follows. The Sichuan earthquake that occurred in May 2008, ruptured almost 300 kilometers of fault, and damaged as many as 2380 dams in China, including the156-meter-high Zipingpu Dam. The Zipingpu Dam was induced by a 7.9 magnitude earthquake because the epicenter was very to the dam. The 128 m high Kariba Dam is one of Africa’s biggest dams. The Kariba Dam was damaged with an earthquake M6.2 during the year that the reservoir was filled. The earthquakes at Oroville Dam may be the best studied RIS sequence in the world. Oroville dam with a height of 236 m, the tallest earthen dam in the US, was built on an active fault line in the 1950s. In the 1970s, the area experienced an unusual series of earthquakes, including the biggest one (M5.7) in 1975, which occurred 12 kilometers south of the reservoir. The dam was built on a fault previously thought inactive. Prior to the earthquake, the reservoir level was drawn down to its lowest level since filling. Koyna dam, with a height 126m, of India experienced earthquake M6.3 in 1967. Nurek dam, with a height of 317 m, in Tajikistan had been experienced earthquake with a M4.6 in 1972, which was the year of largest earthquake. The Nurek dam experienced reservoir-induced seismicity [37].
It is well-known that the seismic damages in earth and rock fill dams were observed when a seismic event reaches a degree greater than VI in a modified Mercalli intensity scale [38]. It is also familiar to the researchers that no concrete-faced rock-fill (CFR) dam has been tested under strong seismic shaking to prove the adequacy of its various design features. In fact most concrete CFR dams have been built in areas of very low seismicity, such as Australia and Brazil [39].
It has been mentioned in the previous section that major geological discontinuities, like- faults and fractures around Tipaimukh Dam axis belong to the category that may undergo strike-slip and extensional movements. These types of geological structures can be easily reactivated causing small to considerable displacement along them by any tectonic phenomena e.g. moderate and large earthquakes. By such a process, if the dam axis is displaced by a few centimeters, a serious damage may occur causing a dam disaster leading to huge loss of lives and property [10]. The felt area of the great Indian earthquake in 1897 covered 150N to 340N latitude and 720E to 1040E longitude with an area of about 300,000 km2 [30]. The approximate location of the Tipaimukh Dam area is 24°14/N and 93°1.3/E.
It is scientifically documented that two major causes: (i) regional high seismicity, (ii) strike-slip and/or extensional movement of regional faults are very common features in and around Tipaimukh area. Strike-slip or extensional behaviors of faults associated with the Barak riverbed and the added weight of reservoir water at the upstream of the dam could generate a reservoir-induced seismicity after construction of the dam, as experienced in Shih-Kang weir in Taiwan and Zipingpu Dam in China. Therefore, the government of India must be stopped the construction of the Tipaimukh dam considering the public and environmental safety in and around the Barak River basin and north-eastern region of Bangladesh.
Acknowledgements
The authors wish to thank the Editor in Chief of Earth
Science journal and two anonymous reviewers are thanked
for their helpful comments.
Important Note
This scholarly article is the first-time scientific achievement on the Tipaimukh Dam issue amongst the Bangladeshi and Indian Scientists [Dr. M.R. Islam]. For details about Dr. Islam, please visit his website, which is available at: http://publicationslist.org/m.r.islam
References
impounding of major artificial reservoirs in Japan. Physics of the Earth and Planetary Interiors, vol. 44, pp.87-98. 1986.
[2] F. Jafarzadeh, Dynamic response of Masjed-Soleyman rockfill dam. 13th World Conference on Earthquake Engineering, Vancouver, B.C., Canada, paper No. 987, 2004.
[3] IITK-GSDMA Guidelines for Seismic Design of Earth Dams and Embankments. Provisions with Commentary and Explanatory Examples. Indian Institute of Technology Kanpur. Gujarat State Disaster Management Authority. August 2005; Revised May 2007.
[4] US Army Corps of Engineers. General Design and Construction Considerations for Earth and Rock-fill Dams. Engineer Manual. EM 1110-2-2300, 30 July, 2004.
[5] D.S. Kim, G.C. Cho, N.R. Kim, Development of KOCED geotechnical centrifuge facility at KAIST, Proceedings of International Conference on Physical Modelling in Geotechnics, pp.147-150. 2006.
[6] G. Gazetas, Seismic response of earth dams: some recent developments. Soil Dynamics and Earthquake Engineering, vol. 6, pp.2-47, 1987.
[7] https://wiki.carleton.edu/display/tec2011/Indian+Plate+3, June 20, 2012.
[8] M. D. Zoback, S. M. Gorelick, Earthquake triggering and large-scale geologic storage of carbon dioxide. PNAS, vol.109, p.10164-10168, 2012.
[9] https://wiki.carleton.edu/display/tec2011/Indian+Plate+3, June 20, 2012.
[10] S. Ibotombi, Tipaimukh Dam is A Geo-tectonic Blunder of International Dimensions,
website:http://classic.kanglaonline.com/index.php?template =kshow&kid=691&Idoc_Session=ff25e4df9f7ba5f16dd38f0 cd2c0b0b7, as per May 20, 2013.
[11] S. Dasgupta, P. Pande, D. Ganguly, Z. Iqbal, K. Sanyal, N.V.
Venaktraman, S. Dasgupta, B. Sural, L. Harendranath, K. Mazumadar, S. Sanyal, A. Roy, L.K. Das, P.S. Misra, H. Gupta, Seismotectonic Atlas of India and its Environs. Geological Survey of India, Calcutta, India, 2000.
[12] D.R. Nandy, Geodynamics of north eastern India and the adjoining region, 1st edn. ACB publications, Kolkata, 2001.
[13] BIS, IS-1893–2002 (Part 1): Indian standard criteria for earthquake resistant design of structures, part 1–general provisions and buildings. Bureau of Indian Standards, New Delhi, 2002.
[14] S.C. Bhatia, K.M. Ravi, H.K. Gupta, A probabilistic seismic
hazard map of India and adjoining regions. Ann di Geofis, vol. 42, pp. 1153–1166, 1999.
[15] K.K.S. Thingbaijam, S.K. Nath, A. Yadav, A. Raj, M.Y. Walling, W.K. Mohanty, Recent seismicity in Northeast India and its adjoining region. J Seismol, vol. 12, pp. 107–123, 2008.
[16] North Eastern Region Base Document of CGPB Committee VIII. Geology and Mineral Resources of North Eastern Region. Geological Survey of India. Government of India Ministry of Mines. 2010.
[17] Geology and mineral resources of Manipur, Mizoram, Nagaland and Tripura. Geological Survey of India. Miscelleaneous Publication No. 30 Part IV, Vol 1(Part-2). Published by the order of the Government of India, 2011.
[18] Y. Kagan, Statistics of Characteristic Earthquakes, Bull. Seismol, Soc. Am. Vol. 83, pp. 7-24, 1993.
[19] B.B. Mandelbrot, The Fractal Geometry of Nature (W. H. Freeman, New York) 468 pp. 1982.
[20] P.G. Okubo, K. Aki, Fractal Geometry in the San Andreas Fault System, J. Geophys. Res. Vol. 92, pp. 345–355, 1987.
[21] K. Kumar, Basic Geotechnical Earthquake Engineering.
New Age International (P) Limited, Publishers. 4835/24, Ansari Road, Daryaganj, New Delhi – 110002, 2008.
[22] W.G. Pariseau, Design Analysis in Rock Mechanics. Taylor & Francis/Balkema P.O. Box 447, 2300 AK Leiden,The Netherlands. 2006.
[23] Y. Zhang, G. Chen, J. Wu, L. Zheng, X. Zhuang, Numerical Simulation of Seismic Slope Stability Analysis Based on Tension-Shear Failure Mechanism. Geotechnical Engineering Journal of the SEAGS & AGSSEA, vol. 43, pp. 18-28, 2012.
[24] V.B. Glagovsky, N.A. Kassirova, E.V. Kurneva and M.A. Drujinin, Computation analysis of concrete face rockfill dam under static and seismic loading. 13th World Conference on Earthquake Engineering, Vancouver, B.C., Canada, paper No. 2169, 2004.
[25] J.L. Sherard, Earthquake Considerations in Earth Dam Design,” Journal of the Geotechnical Engineering Division, American Society of Civil Engineers, vol. 93, pp. 377-401. 1967.
[26] K. Arulanandan, and E.B. Perry, “Erosion in Relation to Filter Design Criteria for Earth Dams,”Journal of the Geotechnical Engineering Division, American Society of Civil Engineers, vol. 109, pp. 682-698, 1983.
[27] J.R. Kayal. Himalayan tectonic model and the great earthquakes: an appraisal. Geomatics, Natural Hazards and Risk, vol.1, pp. 51–67, 2010.
[28] US Army Corps of Engineers. Engineering and Design. Slope Stability. EM 1110-2-1902 31. 2003.
[29] R.D. Oldham, Report on the great earthquake of 12th June, 1897. Geological Survey of India Publishing, Memoir, 29, 379 pp. 1899.
[30] A.A. Khan, Earthquake, Tsunami and Geology of Bangladesh, University Grand Commission of Bangladesh, 29/1 Agargaon, Dhaka, Bangladesh. UGC Publication No 127, 331 pp. 2010.
[31] A.N. Tandon, A study of Assam earthquake of August 1950 and its aftershocks. Indian Journal of Meteorology and Geophysics, vol.5, pp. 95–137, 1954.
[32] R. Armijo, P. Tapponnier, T. Han, Late Cenozoic right-lateral strike-slip faulting in Southern Tibet. Journal of Geophysical Research, vol. 94, pp. 2787–2838, 1989.
hazard in Northeast India – A seismic microzonation approach with typical case studies from Sikkim Himalaya and Guwahati city. J. Earth S yst. Sci . vol. 117, pp. 809–831, 2008.
[34] http://earthquake.usgs.gov/earthquakes/eqarchives/year/eqst ats.php
[35] M. Wieland, R.P. Brenner, P. Sommer, Earthquake resiliency of large concrete dams: damage, repair, and strengthening concepts. Proceedings of the 21st International Congress on Large Dams, ICOLD, Montreal, Canada. 2003.
[36] M. Wieland, and B. H. Fan, The Activities of The International Commission on Large Dams (Icold) in the
Earthquake Safety of Large Dams. 13th World Conference on Earthquake Engineering Vancouver, B.C., Canada, Paper No. 5051, August 1-6, 2004.
[37] Exposing the hidden dangers of dam-induced earthquakes. International Rivers. March 2009.
[38] U. M. Hernández, O. E. Nava-Tristán, X. L. Liu, E. M. Sandoval, G. F. Hach, Seismic guidelines for earth and rock fill dams. The 14th World Conference on Earthquake Engineering, Beijing, China, 2008.
![Figure 1a. Geotectonic location of the Tipaimukh Dam of north-eastern India [7]](https://thumb-us.123doks.com/thumbv2/123dok_us/8489070.1716023/2.595.318.545.517.706/figure-geotectonic-location-tipaimukh-dam-north-eastern-india.webp)