Eigenbased Multispectral Palmprint Recognition
Abubakar Sadiq Muhammad, Fahad Abdu Jibrin, Abubakar Sani Muhammad
Kano State Polytechnic, School of Technology,
Department of Computer Engineering, Nigeria, PH-+234 7069259611
Faculty of Engineering, Ahmadu Bello University Zaria, Department of Electrical Engineering, Nigeria, PH-+234 8060288816
Kano State Polytechnic, School of Technology,
Department of Electrical Engineering, Nigeria, PH-+234 9031338779
Abstract: This paper presents a simple method for verification of palm images. Fusion of palmprint instances is performed image level. To capture the palm characteristics, the fused image were concatenated to form longer feature vector whose dimension is reduced by Principal Component Analysis (PCA). Finally, the reduced set of features is trained with distance metric classifiers (Manhattan, Euclidean and Cosine Distance) to accomplish recognition task. For evaluation, PolyU Multispectral Palmprint database is used. The experimental results reveal that three bands R, B, NIR contain most of the salient and discriminative features for building an accurate biometric system and in which a recognition rate of 99.99% can be achieved.
Keywords: Palmprint Verification, Multispectral Image Fusion, Eigenpalm, Distance metric Classifiers.
1.
Introduction
Palmprint verification and identification systems are increasingly employed for use because of its merits such as low resolution, low cost, low intrusiveness and stable feature structures. Biometric fusion is a concept employed to combine multiple biometric sources from different or identical sensors to improve system accuracy and robustness [1]. Multispectral imaging involves capturing of data at specific frequencies of electromagnetic spectrum using devices that separate the wavelength and extends beyond the visible spectrum since infrared light is considered. It has the advantage of extraction of additional information the human eyes fail to capture with its receptors (red, green, and blue) possible. Image fusion method provides a solution to problem of combining several images taken from the same object to obtain a new fused image which is spatially enhanced and contains more discriminative features. With palmprint images captured under different light illuminations and combining the information obtained from images captured at different spectrum. It is possible to collect more information that would improve accuracy, reliability and antispoofing capability for designing a palmprint authentication system with optimal efficiency.
1.1.Problem Statement
Previous works done on the palmprint recognition systems involve the use of palm images captured under a single illumination (white light). This often suppresses features that are vital for the discriminative purposes and also make the recognition system to suffer from compromise due to spoof attacks. A solution to the problem is to design the system using images captured under different light illuminations. A number of research showed that an image capture under light illumination or using different sensors contains more distinctive features which on combination of the different information enhances the performance of the system. Biometric image fusion refers to a process that fuses multispectral biometric images captured by identical or
different biometric sensors; this fusion produces an image in spatially enhanced form which contains more intrinsic and discriminative information thereby increasing the reliability and accuracy of biometric systems. The information presented by multiple biometric measures can be fused at four levels namely image level, feature level, matching score level and decision level. Wang and Ruan [2] proposed a palmprint and palmvein fusion system that uses one color camera and NIR camera with a registration procedure of 9s, this system suffers from cost. Hao et al [3] developed a contact-free multispectral palm sensor whose image quality happens to be limited; hence low recognition accuracy was obtained. Z. Guo et al [4] proposed a feature band selection based multispectral palmprint recognition where statistical features are extracted to compare each band. Score level fusion was performed to determine the best combination from all candidates and concluded that most discriminative features can be found in two special bands (600,700,880nm). Cui J. proposed an algorithm for solving the problem of band selection using extended General Colour Image Discriminant (GCID) model to generate three new color components for improvement of recognition performance.[5][6] proposed approaches for improving recognition performance in which a recognition rate of 98.83% and (99.4%,99.2%) were obtained respectively. This work presents the fusion of the palm images taken under different wavelength at image level followed by performance evaluation using a number of classifiers. The overall framework is as follows: Section 2 present preprocessing steps conducted to achieve a normalized region of palmprint images and a brief introduction to eigenpalms. Experimental results and conclusions are given in sections 3 and 4.
2.
Preprocessing
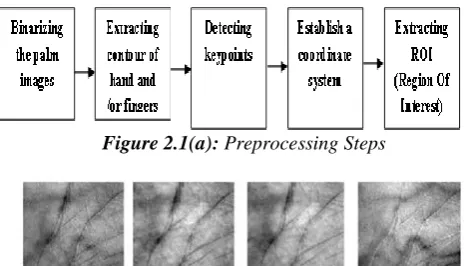
the palmprint requires defining a coordinate system based on which different palm images are aligned for matching and verification. Most of the preprocessing algorithms employ identification of the key points between fingers to set up a coordinate system. The following algorithm is followed to extract the central part of the palmprint image as ROI and further this ROI is used for multispectral fusion of palm images:
Step 1: Convert the multispectral image to a binary image. A smoothening filter can be used to enhance the image.
Step 2: Apply boundary-tracking algorithm to obtain the boundaries of the gaps between the fingers.
Step 3: Determine palmprint coordinate system by computing the tangent of the two gaps with any two points on these gaps. The y-axis is considered as the line which joined these two points. To determine the origin of the coordinate system the midpoint of these two points are taken through which is a line passing and perpendicular to the y-axis.
Step 4: finally, extract the ROI which is the central part of the palmprint for feature extraction.
Figure 2.1(a): Preprocessing Steps
Figure 2.1(b): ROI under four illuminations (R,G,B,NIR)
2.1. Multispectral Image fusion
The multispectral ROI palm images obtained under different illumination conditions as Red, Green, Blue and NIR bands are fused together to form a single feature vector. The fusion extracts information from each source image and obtains the effective representation in the final fused image. The objective of the fusion technique is to process the detailed information that is found from both the source ROI images. A typical image can be described by a two dimensional array (NxN). The eigenspace method defines a palmprint image as a vector of length N2x1 called a “palm vector”. A sub palmprint image obtained after preprocessing of fixed size 128x128 gives a vector which represents a single point in the 16,384 dimensional space. The fact that Palmprints have similar structures usually three main lines and creases and all “palm vectors” are located in a narrow image space bounded by the number of images employing the Principal Component Analysis (PCA) allows for representation of the principle components of the distribution or the eigenvectors of the covariance matrix of the set of palmprint images. These eigenvectors define the space of the palmprints which are called “eigenpalms” and each palmprint image can be represented in terms of linear combination of the eigenpalms. The fusion at image level is done by concatenation of the extracted ROIs from each individual illuminations IR, IB, IG, I NIR to form the training
set which is then processed by the PCA as explained below: Suppose the training samples of the palmprint images are
1, 2... m
x x x where M is the number of images in the training set. The average palmprint image of the training set is defined by 1 1 M i i x M
(1)The difference between each palmprint image and the average image is given by i xi , the covariance matrix of xi is as follows:
1 1 M i T T i i M X XC x x
M
(2)Where the matrix X
1 2...m
is the concatenated palm image vectors. The covariance matrix C is of dimension 2 2N N . The PCA transform has been found to be
the best approximation of an original process in the sense that it reduces the total mean-square error provided the eigenvalues are arranged in decreasing order thereby allowing the eigenvectors of C to span an algebraic eigenspace and provide an optimal approximation for those training samples in terms of the mean square error [10]. The determination of the eigenvalues and eigenvectors of the matrix C of typical image size ( 2 2
N N ) is cumbersome and
time- consuming. Thus an efficient method is needed to calculate the eigenvalues and eigenvectors. It is well known that every matrix satisfies the following theorem
k
k k
A u u (3)
Where
k
u and k refer to the eigenvalues and eigenvectors
of A. Hence the matrix C can bewritten as:
k k
C u u (4)
with
k
u and k refer to the eigenvalues and eigenvectors
of C. However, in practice the number of training samples is relatively small as such it is easier to calculate the eigenvectors (vk ) and eigenvalues (ak ) of the matrix say
T
L X X whose size is bounded by the number of training samples. Thus
X TX vk a vk k (5)
Multiplying both side of equation (5) by X we have
X XT
X vk
ak
X vk
(6) Comparing eqn.(4) with eqn.(6) above the eigenvectors of matrix C is obtained, since we have
k k
u X v (7)
U
uk,K 1 ...M
(8)This method actually reduces the number of calculations to be carried out with U denoting the basis vectors that correspond to the original palmprint images. Resizing each of the eigenvectors into the original image size (N N ), it is
to the number of samples in the training set. However, it is not necessary to choose all the eigenvectors as the base vectors but just those eigenvectors that have associated with them largest eigenvalues as they give required representation of the training set [13]. The number of significant eigenvectors (u’k) with the largest associated eigenvalues are
selected to be the components of the eigenpalms which can extend to an M’ dimensional subspace of all possible palmprint images. A new palmprint image is then transformed into its corresponding eigenpalm by the following operation:
fi U '
xi
i1 ...M
(9)'
'
, 1 ...
k
U u K M (10)
Where fi represents the standard feature vector of each person and M 'is the feature length.
Figure 2.2: Eigenpalm for four illuminations (R, G, B, NIR)
2.2.Proposed Approach
The proposed approach will be implemented as follows: Step 1: investigate the recognition performance of single palmprint spectra.
Step 2: Fusion of spectral with best recognition performance Step 3: Comparison between single spectral and fused spectral.
Figure 2.3: Flowchart of the proposed approach
The palmprint database used is the PolyU Multispectral palmprint database. It is made up of palmprint images from 250 persons with each providing images from two palms for capture. A number of literature have shown that palmprint of a person are not the same even for identical twins. Thus it is evident to consider the palm images as belonging to 500 different persons. Experiments were carried out in two sessions in which the recognition rates were obtained and a comparison made between the performances of single spectra and combined (triple) spectra. The experiment uses 200 persons in which training and test subject were chosen randomly with recognition rate evaluated using a set of three classifiers namely: Euclidean, Manhattan and Cosine Distance.
3. Simulations and Result Discussion
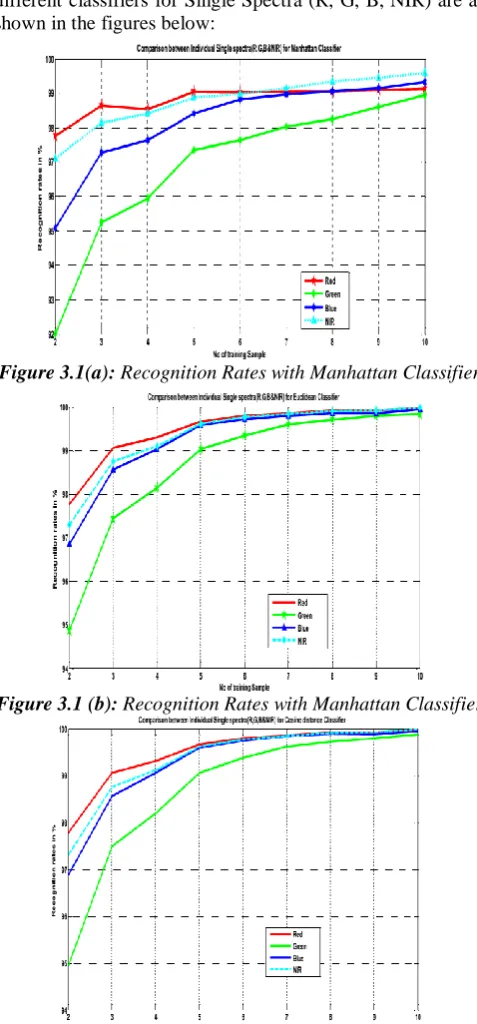
The simulation for this work was implemented using Matlab v7.14 (R2012a). The experiments used images of 200 persons which is equivalent to 200 classes since each palm image differs from the other. Each person has a total of twelve (12) images which are chosen randomly beginning with 2, 3, 4 to 10 training and others for authentication. The process was repeated ten (10) times with the average recognition obtained. The recognition rates obtained from the different classifiers for Single Spectra (R, G, B, NIR) are as shown in the figures below:
Figure 3.1(a): Recognition Rates with Manhattan Classifier
Figure 3.1 (b): Recognition Rates with Manhattan Classifier
Figure 3.1(c): Recognition Rates with Manhattan Classifier
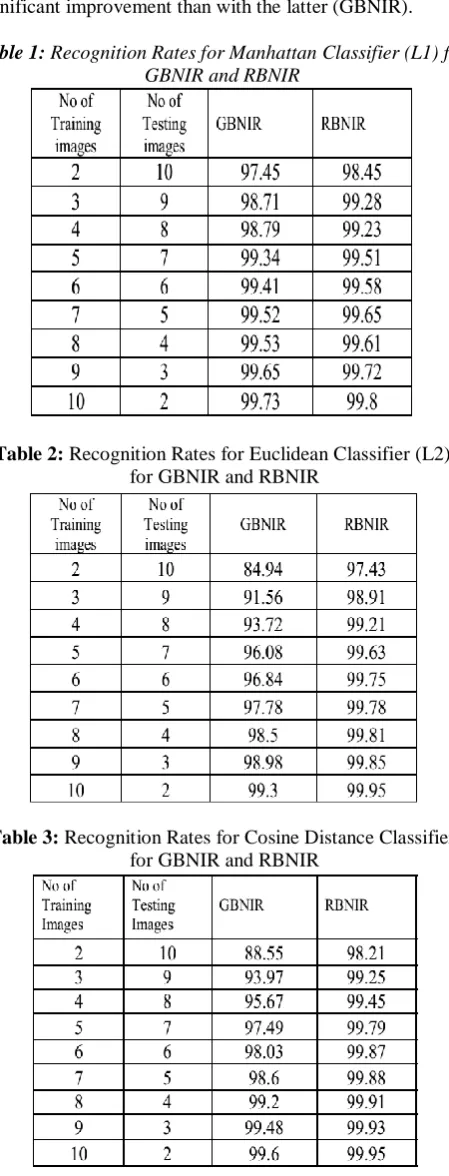
and lastly Green. Table 1-3 show the comparison of recognition rates obtained on fusion among three spectra (R, B, NIR) and (G,B,NIR) the former is found to yield good results with the three classifier and the fusion is seen to have significant improvement than with the latter (GBNIR). Table 1: Recognition Rates for Manhattan Classifier (L1) for
GBNIR and RBNIR
Table 2: Recognition Rates for Euclidean Classifier (L2) for GBNIR and RBNIR
Table 3: Recognition Rates for Cosine Distance Classifier for GBNIR and RBNIR
This could have result from the availability of less correlation between such spectra that in turns amounts for a better performance. The fusion of the three best bands is also seen to have demonstrated an improvement when compared with some of previous work reviewed as in [5] [6]. A comparison of the fused spectra to single spectra are seen in Table (4-7) , it is also seen to demonstrate a significant improvement in the recognition rates obtained with reference
to the single spectra with each of the classifier though the performance with Euclidean is seen to be below those of the fused spectra. This might have to do with its dependency on the smallest distance to the query point thus in high dimensional data (concatenated feature vectors) the ratio between nearest and farthest points will approach unity making points to be uniformly distant from each other. This makes clear distinction difficult.
Table 4: Recognition Rates for Manhattan Classifier (L1) Single Spectra(R, G, B, NIR) Vs Combined Spectra
(GBNIR/RBNIR)
Table 5: Recognition Rates for Cosine Distance Classifier Single Spectra(R, G, B, NIR) Vs Combined Spectra
(GBNIR/RBNIR)
Table 6: Recognition Rates for Euclidean Classifier (L2) Single Spectra(R, G, B, NIR) Vs Combined Spectra
Such effect is common to metric distance classifiers but is more pronounced with Euclidean.
4. Conclusion
In this work, Biometric fusion was carried out at image level for four set of multispectral palm images (R, G , B, NIR), the fusion demonstrated a significant increase in recognition rates (99.95%) with a number of classifiers when compared with reviewed works. The Principal Component Analysis (PCA) was employed for feature extraction. It is seen to demonstrate increase in recognition with more increase in the number of the training sets; this is quite typical with the method employed for feature extraction (Eigenface) which demonstrates better performance with increase in the number of available feature vectors. It is also evident that most discriminative information is captured under three bands Red, Blue and NIR.
References
[1] A. Kong, D. Zhang and M. Kamel, “A Survey of Palmprint Recognition”, Pattern Recognition, No. 42, pp. 1408-1418, 2009.
[2] Y. Hao, Z. Sun, T. Tan and C. Ren, “Multispectral Palm Image Fusion for Accurate Contact-Free Palmprint Recognition”, 15th
IEEE International Conference on Instrumentation and Measurement, pp. 281-284, October , 2008.
[3] Z. Guo, L. Zhang and D. Zhang, “Feature Band Selection for Multispectral Palmprint Recognition”, 20th International Conference on Pattern Recognition, pp. 1136-1139, August, 2010.
[4] D. Zhang, Z. Guo, G. Lu, L. Zhang and W. Zuo, “An Online System of Multispectral Palmprint Verification”, IEEE Transaction on Instrumentation and Measurements, Vol. 59, No. 2, February, 2010.
[5] X. Xu , Z. Guo , C. Song and Y. Li, “Multispectral Palmprint Recognition Using a Quaternion Matrix”,
Sensors, Open Access Journals Vol. 12, No. 4, pp.
4633-4647, 2012.
[6] N. Mittal, M. Hanmandlu, J. Grover, R. Vijay, ”Rank-level Fusion of Multispectral Palmprints”, International Journal of Computer Applications, Vol. 38, No. 2, January, 2012
[7] Y.Wang and Q. Ruan, “A New Preprocessing Method of Palmprint”, Journal of Image and Graphics, Vol. 13, No. 6, pp. 1115-1122, 2008.
[8] R. K. Rowe, U. Uludag, M. Demirkus, S. Parthasaradhi and A. K. Jain, “A Multispectral Whole-Hand Biometric Authentication System”, in Proc. Biometric Symposium, Biometric Consortium Conference, Baltimore, MD, pp. 1-6, September, 2007.
[9] W. Linqyu, G. Leedham, “Near and Far-Infrared Imaging for Vein Pattern Biometrics”, IEEE International Conference on Video and Signal Based surveillance, pp. 52, November, 2006
[10] S. Ribaric and I. Fratric, “ A Biometric Identification System Based on Eigenpalm and Eigenfinger Features”, IEEE Transaction on Pattern Analysis and Machine Intelligence, Vol. 27, No. 11, pp. 1698-1709, November, 2005.
[11] G. Lu, D. Zhang and K. Wang, “ Palmprint Recognition Using Eigenpalms Features “, Pattern Recognition Letters, Vol. 24, pp. 1463-1467, 2003.
[12] A. Ross, A. K. Jain, “Information Fusion In Biometrics”, Pattern Recognition Letters, Vol. 24, pp. 2115-2125, 2003.
[13] M. Turk and A. Pentland, “Eigenfaces for Recognition”, Journal of Cognitive Neuroscience, Vol. 3, No. 1, pp. 71-86, 1991.
[14] R Raghavendra, C Busch ,” Novel Image Fusion Scheme Based On Dependency Measure For Robust Multispectral Palmprint Recognition”,Pattern
recognition, Elsevier, 2014.
[15] D Zhang, W Zuo, F Yue,” A comparative study of palmprint recognition algorithms“ , ACM Computing Surveys (CSUR), 2012.
[16] Z Liu, J Pu, T Huang, Y Qiu, “A novel classification method for palmprint recognition based on reconstruction error and normalized distance”, Applied intelligence - Springer, 2013.
[17] H. C. Chuan, HL. Cheng, CL. Lin and KC. Fan, “ Personal Authentication Using Palmprint Features”, Pattern Recognition, Vol. 36, No. 2, pp. 371-381, 2003 [18] X. Shuang and J. Ding, “ Palmprint Image Processing And Linear Discriminant Analysis Method”, Journal of Multimedia, Vol. 7, No. 3, 2012.
[19] T. Connie, A.T.B. Jin and M.G.K. Ong, “ An Automated Palmprint Recognition System”, Image Vision in Computer, Vol. 23, o. 5, pp. 501-505, May 2005.
[20] S. A.C. Schuckers , “ Spoofing and Anti-Spoofing Measures“, Information Security Technical Report, Vol. 7, No. 4, pp. 56-62, December, 2002.
Author Profile