November-December 2016 755
Research
Paper
Simultaneous Quantification of Novel Antiretroviral
Drug Combination by Stability-indicating High
Performance Liquid Chromatography Method
N. MALLIKARJUNA RAO* AND D. GOWRI SANKAR1Department of Pharmaceutical Sciences, Jawaharlal Nehru Technological University, Kakinada-533 003, 1Department of Pharmaceutical Analysis and Quality Assurance, University College of Pharmaceutical Sciences, Andhra University, Visakhapatnam-530 003, India
Mallikarjuna and Gowri: Simultaneous Estimation of Novel Antiretroviral Drug Combination by HPLC
Research in the many areas of human immunodeficiency virus treatment, eradication and prevention has necessitated measurement of antiretroviral concentrations in nontraditional specimen types. For HIV infection, drug combinations are typically used as highly active antiretroviral therapy, intended to maximize viral suppression. A novel four drugs combination was used, which contains two nucleoside analog reverse transcriptase inhibitors (lamivudine and tenofovir) and two protease inhibitors (darunavir and ritonavir). A new simple, efficient, and sensitive reverse phase high performance liquid chromatographic method has been developed for simultaneous extraction and determination of the concentrations of lamivudine, tenofovir, darunavir and ritonavir in bulk and in their tablets. Four compounds were separated on a reversed-phase C18 column at 30±2.0° using a gradient mobile phase combination containing potassium dihydrogen phosphate, acetonitrile and methanol. The pH was adjusted to 3.5±0.05 by the addition of orthophosphoric acid. The samples were detected using a UV detector, 260 nm for lamivudine, tenofovir and darunavir and 240 nm for ritonavir. The procedure separated analytes and its potential degradation products such as lamivudine, tenofovir, darunavir and ritonavir eluting at about 2.385, 4.055, 11.353 and 14.010 mins, respectively. The linear range of lamivudine, tenofovir, darunavir and ritonavir was 58.32-174.96 μg/ml, 58.32-58.32-174.96 μg/ml, 72.00-216.00 μg/ml and 112.50-337.5 μg/ml, respectively. The relative standard deviation for precision was less than 2.0%. The drug was subjected to acid, alkaline peroxide and photolytic stress conditions and the performance of the method was validated according to the International Conference on Harmonization guidelines for specificity, linearity, accuracy, precision and robustness.
Key words: Stability indicating, RP-HPLC, lamivudine, tenofovir, darunavir and ritonavir
Viruses have been producing an enormous health hazards continuously for the mankind since ages. These challenges were constantly met by the mankind by producing the effective drugs. There are number of new drug molecules that have been developed for the
effective treatment of human immunodeficiency virus
(HIV) infection or other viral infections. One of the deadliest and unmanageable chronic health catastrophes is HIV/AIDS. It requires lifelong treatment with combination of potent life-saving essential drugs which include, nucleoside reverse transcriptase inhibitors (NRTI), non-nucleoside reverse-transcriptase inhibitors (NNRTI) and protease inhibitors[1,2]. Amongst these two
nucleoside analog NRTI lamivudine (2′,3′-dideoxy-3′-thiacytidine, commonly called 3TC), tenofovir
(({[(2R)-1-(6-amino-9H-purin-9-yl)propan-2-yl]oxy}
methyl)phosphonic acid), two protease inhibitors (PI)
like darunavir ([(1R, 5S, 6R)-2,8-dioxabicyclo[3.3.0] oct-6-yl] N-[(2S,3R)-4-[(4-aminophenyl)sulfonyl-(2-methylpropyl) amino]-3-hydroxy-1-phenyl-butan-2-yl]carbamate) and ritonavir (1,3-thiazol-5-ylmethyl N-[(2S,3S,5S)-3-hydroxy-5-[(2S)-3-methyl-2-{[methyl({[2-(propan-2-yl)-1,3-thiazol-4-yl] methyl}) carbamoyl] amino} butanamido]-1,
6-diphenylhexan-*Address for correspondence E-mail: [email protected]
This is an open access article distributed under the terms of the Creative Commons Attribution-NonCommercial-ShareAlike 3.0 License, which allows others to remix, tweak, and build upon the work non-commercially, as long as the author is credited and the new creations are licensed under the identical terms
756
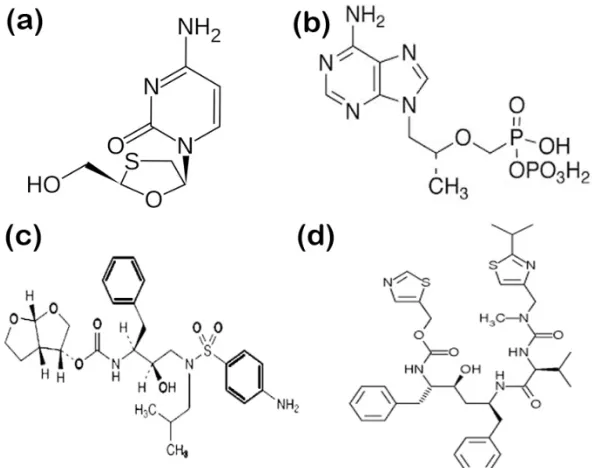
2-yl]carbamate) constitute first-line therapy[3]. Fig. 1a-d shows the chemical structures of the drugs. Since, the introduction of highly active antiretroviral
combination therapy (HAART) in the late 1990s, the life expectancy and quality of life of HIV-infected patients
have improved due to plasma virus load reductions to below detectable levels[4]. Combination of these four
drugs into fixed dose combinations (FDCs) has been an
essential constituent of the HAART.
Few reports have described bioanalytical methods for simultaneous detection of lopinavir and ritonavir, alone or in combination with additional PI and NNRTI, from plasma and/or cell samples[3,5-9]. Some methods detect tenofovir alone or in combination with other drugs, such as lamivudine[10-12]. Two different analytical assays were employed to determine time course plasma drug concentrations in lopinavir-ritonavir and tenofovir drug interaction studies[13-15]. Liquid
chromatography-mass spectrometry (LC-MS) method was reported for
the simultaneous detection of lopinavir, ritonavir and tenofovir in plasma[16]. No high performance liquid
chromatography (HPLC) method has been reported for the quantification of these four drugs in any of the
matrices. Hence, a reproducible stability-indicating
RP-HPLC method was developed for the quantitative
determination of four drugs. This method was successfully validated according to the International
Conference on Harmonization (ICH) guidelines[17,18]. One of the challenges in developing a single assay
for these four drugs is the significant differences in
hydrophobicity of the nucleoside reverse transcriptase inhibitors (NRTI, lamivudine and tenofovir) and the PIs (darunavir and ritonavir). While darunavir and ritonavir are hydrophobic, and hence insoluble in water, lamivudine and tenofovir is hydrophilic.
This difference makes it challenging to extract these
drugs effectively and simultaneously from tablets and also to identify a suitable chromatographic column
matrix for the separation. Thus, a creative solution is
needed. We systematically addressed these issues and developed a single chromatographic assay to detect all four compounds, lamivudine, tenofovir, darunavir and
ritonavir, simultaneously by using LC coupled with
PDA detector. The optimized method is capable of
extracting and quantifying three drugs simultaneously with high efficiency, selectivity, and sensitivity.
MATERIALS AND METHODS
Original standards of lamivudine, tenofovir, darunavir and ritonavir were provided by the Bio-leo laboratories, Hyderabad. Potassium di hydrogen phosphate,
orthophosphoric acid, HPLC grade acetonitrile and HPLC grade methanol was purchased from Merck, Mumbai, India. HPLC grade water was prepared in-house by Milli-Q water purifying system. Fixed dosage combination tablets containing 150 mg of lamivudine, 150 mg of tenofovir, 400 mg of darunavir and 50 mg of
ritonavir was used for analysis.
Fig. 1: Chemical structures of analytes.
November-December 2016 757 Chromatographic conditions:
Waters e 2695 series HPLC consisting pump, auto
sampler, auto injector, VWD and photo diode array detector, thermostatic column compartment connected with Empower 2 software connected with an Inertsil
ODS-3V, 250×4.6 mm, 5 µ column. Lamivudine, tenofovir and darunavir were determined at 260 nm and ritonavir at 240 nm.
Mobile phase:
Accurately weighed 1.36 g of potassium dihydrogen phosphate in 1000 ml of water, adjusted the pH 3.5±0.05
with orthophosphoric acid. Filtered the solution
through 0.22 µ nylon filter and sonicated to degas
it. The buffer was used as mobile phase preparation
A and acetonitrile:methanol (450:150 v/v) used as
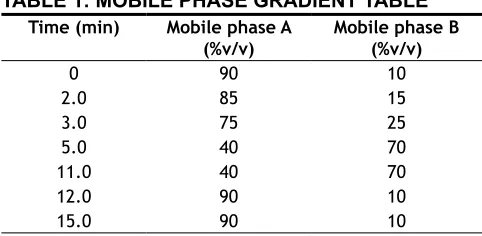
mobile phase preparation B. Lamivudine, tenofovir, darunavir and ritonavir were separated and eluted in
a gradient program represented in Table 1. The flow rate of the mobile phase was maintained at 1.0 ml/min. The column temperature was maintained at 30° with
the injection volume of 10 µl. Methanol was used as
diluent-1 and a mixture of 750 ml of water and 250 ml
of methanol was used as diluent-2.
Preparation of standard solution:
Weighed accurately and transferred 108 mg of lamivudine, 108 mg of tenofovir, 120 mg of darunavir and 150 mg of ritonavir working standard into 100 ml volumetric flask. Added about 75 ml of diluent-1,
sonicated to dissolve and diluted the volume with
diluent-1 and mixed well. Pipetted 5 ml of the above solution and transferred into a 50 ml volumetric flask and diluted to volume with diluent-2. Mixed well and filtered the solution through 0.45 μm syringe filter. Preparation of test stock solution:
Weighed 20 tablets and determined the average weight. Crushed into a fine powder in mortar using pestle and mixed homogeneously. Weighed accurately and transferred tablet powder equivalent to about 450
mg of lamivudine or 450 mg of tenofovir or 1200 mg of darunavir or 150 mg of ritonavir into a 500 ml volumetric flask. About 400 ml of diluent-1 was
added and sonicated to disperse the sample completely.
The sonication was continued for about 60 min with
intermittent shaking. Then, diluted to volume with
diluent-1 and mixed well. Centrifuged a portion of
the above solution in a centrifuge tube with cap, at
5000 rpm, for about 10 min and transferred the clear
supernatant liquid into another centrifuge tube.
Test solution for lamivudine and tenofovir:
Pipetted 6.0 ml of the clear solution into a 50 ml volumetric flask and dilute to volume with diluent-2 and mixed well and filtered a portion of above solution through 0.22 µ syringe filter.
Test solution for darunavir:
Pipetted 5.0 ml of the clear solution into a 100 ml volumetric flask and diluted to volume with diluent-2 and mixed well and filtered a portion of above solution through 0.22 µ syringe filter.
Test solution for ritonavir:
Pipetted 10.0 ml of the clear solution into a 20 ml volumetric flask and diluted to volume with diluent-2 and mixed well and filtered a portion of above solution through 0.22 µ syringe filter.
Elution pattern:
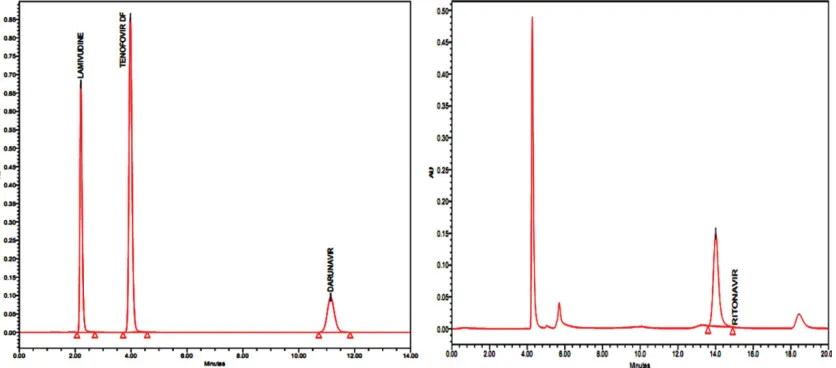
Fumaric acid peak eluted first at about 2.10 min retention time (Rt), next lamivudine peak eluted at about 2.385 min, next eluted tenofovir at about 4.055 min, next darunavir eluted at about 11.353 min and finally eluted ritonavir peak at 14.010 min. Disregarded the peaks due to fumaric acid (from tenofovir disoproxil
fumarate) from test chromatograms.
Force degradation study:
Forced degradation study was performed to evaluate the stability of the developed method using the stress
conditions like exposure of sample solution to acid (0.1 N HCl), base (0.1 N NaOH), peroxide (H2O2) and heat. Investigation was done for the degradation
products. For acid treatment, 10 ml of 1 N HCl was added to the 10 ml stock solution and kept aside at 80° for 12 h. This solution was cooled and neutralized with 10 ml of 1 N NaOH and diluted suitably to a final volume of 100 ml with mobile phase and filtered through 0.22 µ membrane filter. For alkali, 10 ml of 0.5 N NaOH was added to the 10 ml stock solution and
TABLE 1: MOBILE PHASE GRADIENT TABLE
Time (min) Mobile phase A
(%v/v) Mobile phase B (%v/v)
0 90 10
2.0 85 15
3.0 75 25
5.0 40 70
11.0 40 70
12.0 90 10
758
kept aside at 80° for 48 h. This solution was cooled and neutralized with 10 ml of 1 N HCl and diluted suitably to a final volume of 100 ml with mobile phase and filtered through 0.22 µ membrane filter. For Peroxide degradation studies, to the 10 ml stock solution, 5 ml of 3% H2O2 was added and kept aside at 80° for 24 h. This solution was cooled and diluted suitably to a final volume of 100 ml with mobile phase and filtered through 0.22 µ membrane filter. To study heat degradation, 10 ml stock solution, kept at 70° for 10
days. This solution was cooled and diluted suitably to a
final volume of 100 ml with mobile phase and filtered through 0.22 µ membrane filter.
RESULTS AND DISCUSSION
In order to achieve good separation between all the four components different buffer pH conditions were
maintained and different proportions of solvents like methanol, acetonitrile and water tested binary and tertiary eluents were added. However, in potassium
dihydrogen phosphate buffer pH 3.5±0.05 adjusted
with orthophosphoric acid achieved good satisfactory
results at a flow rate of 1.0 ml/min and was measured at a detection of 260 nm for lamivudine, tenofovir and darunavir and 240 nm for ritonavir. Blank, standard and sample chromatograms were shown in figs. 2-4.
System suitability is an integral part of the method validation to evaluate the parameters like tailing factor, theoretical plates, resolution and percent relative
standard deviation (%RSD) for replicate injections.
The results were within the limits and were presented in Table 2.
In the blank chromatograms there were no peaks observed at the retention times of lamivudine, tenofovir,
Fig. 2: Blank chromatogram.
Fig. 3: Chromatogram of standard solution.
November-December 2016 759
darunavir and ritonavir, and also the degradation studies showed that there was no interference with
degradants that shows the method is specific (figs. 2-4).
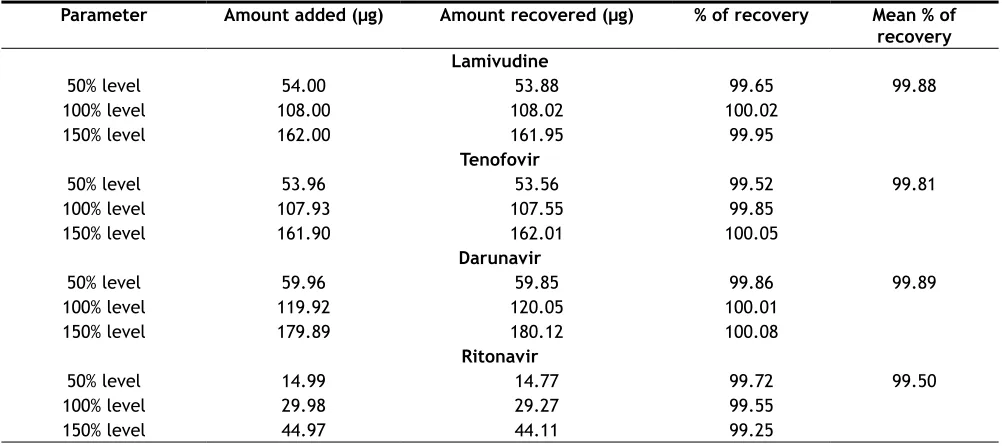
To determine the accuracy of the proposed method, recovery studies were conducted; known amount of pure drug concentrations were at three different levels,
i.e., 50%, 100% and 150% was calculated. Accuracy
was calculated as the percentage of recovery. The
results were tabulated in Table 3.
The precision was evaluated at three levels, repeatability, reproducibility and intermediate precision each level
of precision was investigated by six replicate injections of 100% concentrations of lamivudine, tenofovir,
darunavir and ritonavir. The result of precision was
expressed as %RSD and was tabulated in Table 4.
The linearity was evaluated by measuring different
concentrations (50 to 150%) of the standard solutions
to lamivudine, tenofovir, darunavir and ritonavir. The calibration curve was constructed by plotting concentration of standard solutions against mean peak areas and the regression equation was computed. The summary of the parameters were shown in Table 5. The robustness of the method was unaffected when
small, deliberate changes like, flow change, mobile
phase composition, column temperature were
performed at 100% test concentration. The ruggedness
of the proposed method studied under different columns, analyst, instrument, laboratories analysis of the same sample.
The stability of the standard solution was tested at the
intervals of 24 and 48 h at room temperature. There were no significant changes observed in the system suitable
parameters like theoretical plates, tailing factors, retention time and resolution. Hence, the standard
solution is stable up to 48 h of room temperature.
The proposed method was applied for the analysis of lamivudine, tenofovir, darunavir and ritonavir in tablet dosage forms, the results were found to be between
99.0 and 100.0% and the results were summarized in
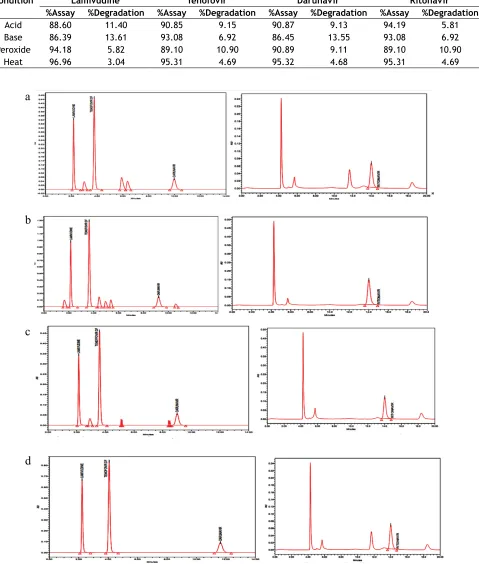
Table 6. Results of forced degradation were shown in
Table 7 and fig. 5 shows the chromatograms of forced
degradation studies.
While a number of antiHIV drug assays have been developed to detect multiple HIV PIs or reverse transcriptase inhibitors in one assay, it is more challenging to detect both classes of drugs at the same time. NRTI such as lamivudine and tenofovir are generally more hydrophilic and PIs, such as darunavir Fig. 4: Chromatogram of sample solution.
Market formulation chromatogram of lamivudine, tenofovir, darunavir (at 260 nm) and ritonavir (at 240 nm).
TABLE 2: SYSTEM SUITABILITY RESULTS
Parameter Results Required limits
Lamivudine Tenofovir Darunavir Ritonavir
RSD of peak area 0.10 1.01 1.24 0.51 <2.0 for n≥6
RSD of retention time 0.25 0.14 0.52 0.85 <1.0 for n≥6
USP Tailing factor (T) 0.25 1.08 0.65 0.84 T<2
USP Plate Count (N) 4500 5235 5874 6850 >2000
USP Resolution (R) - 2.04 5.71 45.08 R>2
760
and ritonavir, are generally more hydrophobic at
physiologic pH. With the ability of a column matrix and
PDA technique to separate the two PIs as well as the two NRTIs, we developed and optimized a single-step
assay with a simplified extraction procedure. The final
assay was validated to be effective and sensitive. Also, the one-step assay method is reliable and reproducible, with a high accuracy, precision and recovery. In our assay, we focused on detecting two NRTIs, lamivudine and tenofovir and two PIs, darunavir and ritonavir
Parameter Amount added (µg) Amount recovered (µg) % of recovery Mean % of
recovery Lamivudine
50% level 54.00 53.88 99.65 99.88
100% level 108.00 108.02 100.02
150% level 162.00 161.95 99.95
Tenofovir
50% level 53.96 53.56 99.52 99.81
100% level 107.93 107.55 99.85
150% level 161.90 162.01 100.05
Darunavir
50% level 59.96 59.85 99.86 99.89
100% level 119.92 120.05 100.01
150% level 179.89 180.12 100.08
Ritonavir
50% level 14.99 14.77 99.72 99.50
100% level 29.98 29.27 99.55
150% level 44.97 44.11 99.25
TABLE 3: ACCURACY DATA
Values are mean of triplicate preparation
TABLE 4: PRECISION STUDIES
Parameter Results
Lamivudine Tenofovir Darunavir Ritonavir
Repeatability
Mean %RSD of retention time 0.25 0.58 0.69 1.24
Mean %RSD of peak area 1.02 1.52 1.68 0.57
Mean % Assay 99.85 99.25 100.01 99.41
Reproducibility/intraday precision
Mean %RSD of retention time 0.20 1.02 1.85 0.81
Mean %RSD of peak area 0.33 0.38 0.21 0.35
Mean % assay 100.00 100.00 100.00 100.00
Intermediate precision
Mean %RSD of retention time 0.28 1.57 1.62 1.42
Mean %RSD of peak area 0.31 0.18 0.28 0.06
Mean % assay 100.00 100.00 99.98 99.68
TABLE 5: REGRESSION EQUATION PARAMETERS
Parameter Lamivudine Tenofovir Darunavir Ritonavir
Linearity range (µg/ml) 58.32-174.96 58.32-174.96 72.0-216.00 112.5-337.50
Correlation co-efficient 0.9995 0.9986 1 1
Slope 140604 174897 15660 80167
Y-intercept 5E+06 7E+06 0.2 24435
TABLE 6: ASSAY RESULTS OF MARKETED TABLETS
Drug Labeled amount (mg/tab) Amount found (mg/tab) % of assay
Lamivudine 150 149.95 99.97
Tenofovir 150 149.82 99.88
Darunavir 400 399.99 99.99
November-December 2016 761
because these four drugs are recommended as a key HAART combination in the most recent HIV/AIDS
treatment guidelines. With some modifications, a
one-step clinical assay such as that described here, but for other PI and NRTI drug combinations, such as lopinavir
or atazanavir with emtricitabine plus tenofovir, could be developed. However, such studies are also beyond the scope of this report.
In summary, using a single column and a combination
gradient mobile phase mixture of potassium dihydrogen
TABLE 7: FORCED DEGRADATION STUDY
Condition Lamivudine Tenofovir Darunavir Ritonavir
%Assay %Degradation %Assay %Degradation %Assay %Degradation %Assay %Degradation
Acid 88.60 11.40 90.85 9.15 90.87 9.13 94.19 5.81 Base 86.39 13.61 93.08 6.92 86.45 13.55 93.08 6.92
Peroxide 94.18 5.82 89.10 10.90 90.89 9.11 89.10 10.90
Heat 96.96 3.04 95.31 4.69 95.32 4.68 95.31 4.69
Fig. 5: Force degradation chromatograms.
(a) Acid degradation, (b) alkali degradation, (c) peroxide degradation and (d) heat degradation.
a
b
c
762
phosphate, acetonitrile and methanol, we successfully
developed a one-step HPLC-PDA assay to detect
four analytes, lamivudine, tenofovir, darunavir and ritonavir. The method can indicate stability and can be used for the routine analysis of production samples and to check the shelf life of the dosage forms.
A simple, specific and reliable gradient
HPLC-PAD method was developed for the estimation of lamivudine, tenofovir darunavir and ritonavir in their pharmaceutical formulation. The four compounds were subjected to forced degradation applying several stress conditions. The proposed method was successfully separated all the four compounds with degradants, estimate the active contents. The Proposed method
is specific and stability indicating power. Hence, the
developed method can be adapted to regular quality control analysis.
Acknowledgements:
The authors are thankful to Department of Pharmaceutical Analysis, J.N.T. University, Kakinada, India for encouragement.
Financial support and sponsorship:
Nil.REFERENCES
1. Palella FJ, Delaney KM, Moorman AC, Loveless MO, Fuhrer J, Satten GA, et al. Declining morbidity and mortality among patients with advanced human immunodeficiency virus infection. The HIV Outpatient Study Investigators. N Engl J Med 1998;338:853-60.
2. Yeni P. Update on HAART in HIV. J Hepatol 2006;44:100-3. 3. Wang PG, Wei JS, Kim G, Chang M, El-Shourbagy T.
Validation and application of a high-performance liquid chromatography-tandem mass spectrometric method for simultaneous quantification of lopinavir and ritonavir in human plasma using semi-automated 96-well liquid-liquid extraction. J Chromatogr A 2006;1130:302-7.
4. Delahunty T, Bushman L, Fletcher CV. Sensitive assay for determining plasma tenofovir concentrations by LC-MS/MS. J Chromatogr B 2006;830:6-12.
5. Holmstock N, Annaert P, Augustijns P. Boosting of HIV protease inhibitors by ritonavir in the intestine: the relative role of cytochrome P450 and P-glycoprotein inhibition based on Caco-2 monolayers versus in situ intestinal perfusion in mice. Drug Metab Dispos 2012;40:1473-7.
6. Rouzes A, Berthoin K, Xuereb F, Djabarouti S, Pellegrin I,
Pellergrin JL, et al. Simultaneous determination of the antiretroviral agents: amprenavir, lopinavir, ritonavir, saquinavir and efavirenz in human peripheral blood mononuclear cells by high-performance liquid chromatography-mass spectrometry. J Chromatogr B 2004;813:209-16.
7. Temghare GA, Shetye SS, Joshi SS. Rapid and sensitive method for quantitative determination of lopinavir and ritonavir in human plasma by liquid chromatography-tandem mass spectrometry. E J Chem 2009;6:223-30.
8. Ehrhardt M, Möck M, Haefeli WE, Mikus G, Burhenne J. Monitoring of lopinavir and ritonavir in peripheral blood mononuclear cells, plasma and ultra-filtrate using a selective and highly sensitive LC-MS/MS assay. J Chromatogr B 2007;850:249-58.
9. Colombo S, Beguin A, Telenti A, Biollaz J, Buclin T, Rochat B, et al. Intracellular measurements of antiHIV drugs indinavir, amprenavir, saquinavir, ritonavir, nelfinavir, lopinavir, atazanavir, efavirenz and nevirapine in peripheral blood mononuclear cells by liquid chromatography coupled to tandem mass spectrometry. J Chromatogr B 2005;819:259-76. 10. Delahunty T, Bushman L, Fletcher CV. Sensitive assay for determining plasma tenofovir concentrations by LC-MS/MS. J Chromatogr B 2006;830:6-12.
11. Matta MK, Burugula L, Pilli NR, Inamadugu JK, Jvln SR. A novel LC-MS/MS method for simultaneous quantification of tenofovir and lamivudine in human plasma and its application to a pharmacokinetic study. Biomed Chromatogr 2012;26:1202-9.
12. Durand-Gasselin L, Van Rompay KK, Vela JE, Henne IN, Lee WA, Rhodes GR, et al. Nucleotide analogue prodrug tenofovir disoproxil enhances lymphoid cell loading following oral administration in monkeys. Mol Pharm 2009;6:1145-51. 13. Kearney BP, Mathias A, Mittan A, Sayre J, Ebrahimi R, Cheng
AK. Pharmacokinetics and safety of tenofovir disoproxil fumarate on co administration with lopinavir or ritonavir. J Acquir Immune Defic Syndr 2006;43:278-83.
14. Kiser JJ, Carten ML, Aquilante CL, Anderson PL, Wolfe P, King TM, et al. The effect of lopinavir or ritonavir on the renal clearance of tenofovir in HIV-infected patients. Clin Pharmacol Ther 2008;83:265-72.
15. Pruvost A, Negredo E, Théodoro F, Puig J, Levi M, Ayen R, et al. Pilot pharmacokinetic study of human immunodeficiency virus-infected patients receiving tenofovir disoproxil fumarate (TDF): investigation of systemic and intracellular interactions between TDF and abacavir, lamivudine, or lopinavir-ritonavir. Antimicrob Agents Chemother 2009;53:1937-43.
16. Koehn J, Ho RJY. Novel liquid chromatography-tandem mass spectrometry method for simultaneous detection of antiHIV drugs lopinavir, ritonavir, and tenofovir in plasma. Antimicrob Agents Chemother 2014;58:2675-80.
17. ICH. Stability Testing of New Drug Substances and Products, Q1A (R2); 2003.