Volume 2009, Article ID 968323,11pages doi:10.1155/2009/968323
Research Article
Modeling Energy Consumption of Dual-Hop Relay Based MAC
Protocols in Ad Hoc Networks
Rizwan Ahmad,
1Fu-Chun Zheng,
2and Micheal Drieberg
11Centre for Telecommunications and Micro-Electronics, School of Engineering and Science, Victoria University, Melbourne,
Victoria 8001, Australia
2School of Systems Engineering, University of Reading, Whiteknights Reading, RG6 6AY, UK
Correspondence should be addressed to Rizwan Ahmad,[email protected]
Received 16 April 2009; Revised 21 September 2009; Accepted 25 November 2009
Recommended by Naveen Chilamkurti
Given that the next and current generation networks will coexist for a considerable period of time, it is important to improve the performance of existing networks. One such improvement recently proposed is to enhance the throughput of ad hoc networks by using dual-hop relay-based transmission schemes. Since in ad hoc networks throughput is normally related to their energy consumption, it is important to examine the impact of using relay-based transmissions on energy consumption. In this paper, we present an analytical energy consumption model for dual-hop relay-based medium access control (MAC) protocols. Based on the recently reported relay-enabled Distributed Coordination Function (rDCF), we have shown the efficacy of the proposed analytical model. This is a generalized model and can be used to predict energy consumption in saturated relay-based ad hoc networks. This model can predict energy consumption in ideal environment and with transmission errors. It is shown that using a relay results in not only better throughput but also better energy efficiency.
Copyright © 2009 Rizwan Ahmad et al. This is an open access article distributed under the Creative Commons Attribution License, which permits unrestricted use, distribution, and reproduction in any medium, provided the original work is properly cited.
1. Introduction
Next generation networks (NGN) (or 4G, as they are better known) are to provide voice, data and multimedia access to users on an “anytime” and “anywhere” basis. This vision of 4G forms the requirement to achieve high throughput,
high energy efficiency and low latency to provide quality
of service (QoS) and efficient utilization of the scarce
bandwidth. Therefore 4G networks are expected to result in a better quality of life and environment. Another important requirement for next generation networks is backward compatibility with existing networks. In today’s world, due to reasons such as cost and lack of infrastructure, it may not be possible for all to adapt new networks at once and make the existing ones obsolete. This may happen eventually with time; however, we expect to have a hybrid of the new and existing networks for quite some time. It is of high importance to have smooth interaction between existing networks and next generation networks. This intermediate period where both networks will coexist is an important step towards complete transition to next generation networks
which ensures a better quality of life and environment. For developed and developing countries which have made much investment on existing networks and due to high number of users, it may take longer to completely migrate to next generation networks. However for underdeveloped countries who still lacks infrastructure the adaptation may be easy but there are cost constraints for them as well.
Existing networks have many issues which when inte-grated into the new networks will greatly influence the overall performance. Therefore, much research currently is focused on improving performance of existing networks. This can
be achieved in numerous ways such as efficient algorithms,
protocol modification, new protocols, and so forth. One such example of issues is from the existing 802.11 networks where the performance of the whole system degrades greatly once low data rate nodes become dominant. A solution to address this issue comes from the advent of cooperative
communication [1, 2] in the form of relay based MAC
Source Destination (a)
Source
Relay
Destination (b)
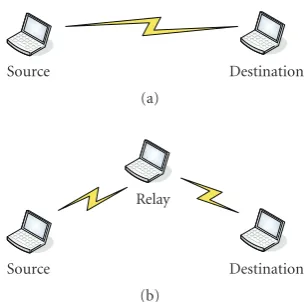
Figure1: (a) Slow Single hop direct transmission, (b) Fast Dual-hop transmission via relay.
incorporated by replacing slow single-hop transmission by fast dual-hop transmissions. This means that the source, after acquiring the medium, transmits to a relay first at a higher rate and the relay will then transmit to destination as shown in Figure 1(b). This solution, although appropriate for the throughput, has emerged in an era when the awareness to “go green” is widely discussed. This has triggered a debate on the energy consumption which has now gained importance in the minds of the MAC protocol developers. It is important to reiterate the fact that before the ultimate phase of complete convergence to 4G networks, a hybrid phase will dominate. Relay based MAC protocols are in its infancy and most of the current literature deals with the throughput improvement gained by using these. There is only limited reporting in the literature dealing with the energy issues in relation to relay based MAC protocols.
Carvalho et al. [3] model node’s energy consumption
in a single-hop IEEE 802.11 ad hoc network as shown in
Figure 1(a). Carvalho calculated the average service time of a packet transmitted in a saturated ad hoc network. Results show that passive modes (idle, overhear, receive) dominate the energy consumption and transmission of large payloads is more advantageous. However, this model treats receiving and idle state in the same way and gives
no consideration for channel condition. Wang et al. [4]
proposed a model for energy efficiency in IEEE 802.11 DCF
and tried to maximize energy efficiency based on packet
size and contention window. They have considered channel errors on the data packet only, which is not reflective of the real situation. Ergen and Varaiya presented a model
in [5] for decomposition of energy consumption in IEEE
802.11. They derived the formula for the amount of energy consumed by a node in order to transmit 1 MB of data in
a network with n nodes in ideal channel conditions. This
model can differentiate receiving and idle states. However
none of the above models are suitable for the relay based MAC protocols and they require significant modifications for the later situation.
In this paper, we propose a generalized model for energy consumption and address the energy concerns of using relay based MAC protocols, as it is important to examine the impact of using a relay on energy consumptions compared
to IEEE 802.11 DCF. Use of relay requires justification both from throughput and from energy perspectives. In addition to this, another concern of importance is the impact of relay
nodes on the energy efficiency as relay nodes will utilize their
own energy reserve to help other nodes.
The main contribution of this paper is the generalized analytical energy model for relay based MAC protocols in ideal channel, channel with transmission errors and the decomposition of energy. In this paper we have used
relay-enabled Distributed Coordination Function (rDCF) [6] as
a case study to show the efficacy of the proposed energy
model. Therefore it is a matter of high importance for MAC protocol developers to have an idea on the energy consumption while still in design phase. We have shown
results of energy consumption with different number of
nodes and rate combinations for relay links. Furthermore we have shown the impact of variable packet length (expected payload) on energy consumption. Decomposition of energy for various operations is also shown and will help in the
design of energy efficient MAC protocols. This is particularly
useful for devising energy saving mechanisms and policies for existing and new protocols. The energy model will benefit the application of relay based MAC protocols (e.g., rDCF) in energy critical areas such as sensor networks and integration with next generation networks.
2. Energy Model
In [7] authors have used Markov chain model of [8]
to show the energy consumption of relay based ad hoc networks. In this paper, we have proposed an energy model to accommodate relay based transmissions by using an
improved model proposed by Wu et al. [9]. This is a more
accurate model for saturation throughput, which requires
the throughput model of [8] to incorporate a finite retry
limit. We further improve it by considering transmission errors. The following challenges have been addressed in the paper: (1) how to incorporate relay nodes, (2) treatment of
relay node, (3) how relay nodes differ from other nodes in
energy consumption behavior, and (4) impact on energy in the presence of transmission errors.
2.1. System Model. We consider a wireless network of n nodes based on IEEE 802.11 MAC that can support multiple transmission rates and supports relay based transmissions.
source node acquires the medium the transmission is done
via the relay. These assumptions lead to the following [7–9]
equations:
Here, (1) shows the probability τ that a node transmits
in a randomly chosen slot depends on the conditional
probability of packet failurep, whereCWminis the minimum
contention windows,mis the maximum backoffstage and
m is the retry limit. Equation (2) gives the packet failure
probability in terms of collision (i.e., (1− τ )n−1) and packet
errors (Pe), where n is the total number of nodes. This
equation differs from [7–9] where probability of failure is
only due to collisions. From this equation we can see that the packet failure is due to collision, transmission errors or both. Here the probability of having failure due to both is almost
negligible. Equations (1) and (2) are a nonlinear system
which can be solved numerically to findpandτ. Equation
(3) givesPtrwhich is the probability that there is at least one
transmission in the considered slot time. In expression (4),
Ps is the probability of a successful transmission. The total
energy in joules consumed by Nodelto successfully transmit
and receive 1 MB of data can then be defined as
J(n)= E
Energy consumed in one slot
E[Data transmitted and received in one slot], (5)
EMB transmitted bylin one slot=PsPtr(1−Pe)
n E[P ].
(6)
In (5)J(n) is the energy consumed in Joules/MB. This
is the ratio of expected energy (in Joules) consumed by
Nodelin one slot to the expected data (in MB) successfully
transmitted and received by nodelin one slot. Equation (6)
gives the expression for expected data (in MB) transmitted
and received by a node l in one slot, where E[P] is the
packet size in MB. In (5) slot refers to a transmission slot
and successful transmission includes transmission by source, forwarding by relay and reception by destination.
Nodes in the network are classified as active (source, relay and destination) and non active (all other nodes listening) nodes. Energy consumed in each kind of slot is the product of slot duration and power consumption in that slot. As
Transmit
Receive Listen
Figure2: Physical States.
we consider a saturated environment for this analysis, we
only consider three physical states: transmit, receive and
listen(idle/overhearing) as shown inFigure 2. Active nodes transmit, receive and listen during a transmission whereas non active nodes only listen to transmission. Next, we use this system model to derive the energy analysis in ideal channel and in channel with transmission errors. Based on the physical states we define operations for active and non active nodes involved.
2.2. Energy Analysis for Ideal Channels. For energy con-sumption in ideal channel, we know that the packet failure is only due to collision and there are no transmission
errors. For the case of ideal channel Pe is zero. Based
on the above concept of active and non active nodes we
have three available states, that is, transmit, receive and
listen(idle/overhearing). We further define operations within the three states: (a) successful transmission; (b) successful reception; (c) overhearing (reception of packets intended for other stations); (d) idle listening (when the channel is idle); (e) unsuccessful (colliding) transmissions; and (f) reception
of collisions. The probabilities of different operations in an
ideal channel are classified as follows:
Eenergy consumed bylin one slot
s (l) is the probability of successful reception of packet
destined for Node l, and is equal to τ(1− τ)(n−1)(1 −
Pe); Jsrx(∼ l) is the probability of successful reception of
packet not destined for Node l, and is equal to (n −
3)τ(1− τ)(n−1)(1−Pe);Jsrx(r) is the probability of successful
reception of packet destined for relay r, and is equal to
τ(1− τ)(n−1)(1−Pe); Jstx is the probability of successful
transmission of a packet by Node l, and is equal toτ(1−
p);Jrx
c is the probability of reception of a collided packet,
and is equal to (1 − τ). [1 − (1−τ)(n−1)(1 − Pe) −
(n−1)τ(1−τ)(n−2)]; Jtx
c is the probability of collision on
transmission of a packet by Nodel, and is equal toτ p(1−Pe);
Jσis the probability of idle slots, and is equal to (1−Ptr).
Jrx
s (l) is successful reception of packets destined for node
lprovided that there is a transmission free from collision and
error. SimilarlyJrx
s (r) is the successful reception by relay with
the same conditions. It is true as the relay is not involved in
the contention process.Jrx
s (∼l) is the successful reception by
all non active overhearing nodes. The term (n−3) ensures
that only non active nodes are considered.Jtx
s is the successful
transmission of a packet provided there is a transmission
without any failure. Jtx
c is the transmission where there is
no error and failure is due to collision. Jrx
c is the reception
of collided packet. Jσ is the probability that there is no
transmission.
The numerator in (5) is defined in expression (14). As
evident from the nature of relay based MAC protocols, we use control packets to coordinate relays which are followed by the data and Acknowledgement (ACK) packets. As from the operations defined earlier in this section we know that in a transmission slot we have active nodes and non active nodes. In order to model this behaviour of transmitting and receiving (active nodes) or receiving only (non active
nodes) control and data packets, we formulate (7) to (11)
to show the working of the protocol. To calculate the energy
consumed by nodes (active and non active) (7) to (11) shown
above are used in (14). For ideal scenario where we have
no transmission errors, it is possible to simplify (14) by
substituting Pe = 0. These equations are independent of
the protocol. Also,ρtx,ρrx andρσ are the power consumed
(in Watts) to transmit, receive and listen (idle/overhearing),
respectively.TSIFS,TDIFSandTEIFSare the short, distributed
and extended inter-frame times.δ is the propagation delay
and σ is the slot time. In (7) and (8), reception and
transmission of multiple packets is shown. Equation (7) gives
a generalized equation for determining Jxr
s (r) and Jsxr(l),
which are probabilities of successful reception of packets by relay and destination (which are active nodes). Equation
(7) consists of the sum of energy consumed in receiving,
transmitting and listening. Energy consumed in each of these states is the product of slot duration and respective power. Here the slot duration in transmitting and receiving of the
control and data packets is the sum of their times. Wherer
andsare total number of control and data packets received.
Similarlytanduare total number of control and data packets
transmitted. The sum ofr,s,tanduis the total number of
control and data packets in a protocol. The same expression
is used to determine Jrx
s (∼ l), where no transmission of
packets is involved. In (8) successful transmission of a packet
by an active node (source) is given. In (9) and (10),Tcontrol∗
is the time for collision of control packet (initiated from
source to relay or destination) andJtx
c areJcrxthe probabilities
of transmission and reception of collided packets. Equation
(11) shows the listening (idle) state as a product of idle slot
and idle power. Equations (7)–(11) are for the ideal case
where there are no errors and are the same as in [7]. This set
of equations represent a generic model and is used to show performance of relay based MAC protocols and can easily be adapted to cater for 802.11 a/b/g physical layers, with the parameters changed appropriately.
2.3. Energy Analysis for Channels with Transmission Errors. In this section we take into consideration the impact of trans-mission errors on the energy consumption. Unlike collision which occurs at the first control packet, transmission errors can occur at any packet. Therefore it is important to take into consideration that even with successful reception of one or more packets involved in the transmission a failure can still take place due to one of the following packets being in error. For energy analysis of channel with transmission errors we add more operations to those defined earlier in
Section 2.2. The additional operations due to errors are: (g) unsuccessful (error) transmissions and (h) reception of errors. The probabilities of additional operations are as follows.
Jtx
e is the probability of transmission of a packet in error
by Node l, and is equal to τ(1−τ)(n−1)Pe; Jerx(l) is the
probability of reception of a packet in error by destined Node
l, and is equal toτ(1−τ)(n−1)Pe;Jerx(r) is the probability of
reception of a packet in error by destined relayr, and is equal
toτ(1−τ)(n−1)Pe;Jerx(∼l) is the probability of reception of
a packet in error not destined for Node l, and is equal to
(n−3)τ(1−τ)(n−1)Pe.
These expressions together with those defined earlier will give the energy consumption in the case of transmission
errors.Jtx
e is the transmission of a packet in error provided
there is no collision. Jrx
e (l),Jerx(r), andJerx(∼ l) are
proba-bilities of reception of a packet destined for Nodel, relayr
and reception of packet not destined for Nodelrespectively.
free from collision. The term (n−3) inJrx
e (∼l) ensures that
only non active nodes are considered. In (12) and (13),Teis
the average time for a particular packet in error. In this case it is showing the first packet in error. For energy consumption
in channel experiencing transmission errors, we define Jtx
e
andJrx
e as the probabilities of transmission and reception of
packets in error. In (12)Jtx
e is the probability of transmitting
a packet in error. Equation (13) is for determining Jrx
e (r),
Jrx
e (l) and Jerx(∼ l), which are probabilities of reception
of packet (first packet) in error by relay, destination and
overhearing nodes. For simplicity we have only shown (12)
and (13) for the case if the first control packet is in error. The
equations become more complex for following packets being in error and are shown in the appendix. Finally the energy
(J/MB) is calculated by using (6), (14) and (5). Equation
(14) is the sum of the products of operations/states and their
probabilities.
To this point, we have shown generalized equations for the energy analysis in ideal channel and channel with transmission errors. In the following section we will apply the above energy analysis to a relay based MAC protocol.
3. Relay-Enabled Distributed
Coordination Function
This section briefly describes the relay-enabled distributed coordination function. The rDCF was originally proposed in
[6], where relay is used to improve the system throughput
and reduce packet delay. In rDCF a high data rate dual hop path is used instead of a low data rate direct path between
the source and destination as shown inFigure 1. The rDCF
is based on the IEEE 802.11 DCF, but has introduced the following modifications.
(i) Backward compatibility to 802.11 DCF (nonrelay mode) and requires only a firmware upgrade.
(ii) Control packets transmitted at the base rate of 2 Mbps.
(iii) Modified carrier sensing scheme (shown inFigure 3).
(iv) Introduction of Reservation Sub Header (RSH) (transmitted at 2 Mbps and used to broadcast dura-tion informadura-tion for the rest of packet) in DATA packets transmitted at higher rates from source to relay.
(v) Frequent broadcasting of willing lists (potential relay entries) between nodes.
(vi) Relay selection based on a credit system.
Considering the fact that rDCF is backward compatible
to 802.11 DCF and have the same backoffscheme, we can
observe that the process of channel contention and time spent in contention for each node in rDCF is the same as in 802.11 DCF.
The modified carrier sensing scheme (shown inFigure 3)
used in rDCF achieves better bandwidth utilization. A major advantage of this scheme compared to 802.11 DCF is that the nodes are blocked exactly for the data transmission duration.
In 802.11 DCF, if the CTS is not received at the source due to collision or channel error, the neighbour nodes of the source are blocked for the whole duration of transmission which reduces the bandwidth utilization. Unlike the standard DCF, in rDCF if CTS/RCTS is not received, the neighbor nodes are not blocked for the whole duration of transmis-sion. In the 802.11 DCF the source estimates the possible transmission rate and the duration, whereas in modified carrier sensing scheme of rDCF, the source first calculates (as all control packets are transmitted at base rate of 2 Mbps) the duration of the RRTS and RCTS/CTS transmissions only. The destination based on the received RRTS1 and RRTS2, decides in favour of the relay or to revert to the direct transmission. If the destination confirms to the source for a direct transmission it transmits a CTS packet or else a RCTS packet for the relay based transmission. The source extracts the agreed transmission rates from RCTS and calculates the duration of data packet and ACK. This information is made available to all overhearing nodes via the RSH attached to the data packet. This prevents the unnecessary blocking of nodes for the entire duration of transmission.
The rDCF uses the same physical characteristics such as transmission power and Receiver Signal Strength Indication (RSSI) as in IEEE 802.11 DCF. There is no power control and both control and data packets are transmitted at maximum power. Relay transmission is intended to provide higher throughput and reduced blocking time.
All the nodes maintain a willing list based on the channel quality between them and neighbouring nodes. The length of the willing list is limited to 10 entries to reduce overheads. Nodes keep updating their willing lists with better links and frequently broadcast their willing list to their neighbours. The willing list contains an entry for the credit rating of each potential relay node. This rating improves with successful relaying and degrades with inability to relay.
3.1. Throughput Analysis of rDCF. To analytically model
rDCF, the authors in [6] have used Bianchi’s model [8]. For
the throughput calculation, saturated condition (i.e., every node always has data to transmit) is assumed. It further assumes that the channel is ideal (i.e., there are no hidden
nodes and capture effect), and calculates the saturated
throughput for Relay-Request-To-Send (RRTS)/Relay-Clear-To-Send (RCTS) access. For rDCF, the equations for the average times of channel sensed busy for collision and successful transmission, respectively, are
TcrDCF=TRRTS1+TDIFS+δ,
TrDCF
s =TRRTS1+TRRTS2+TRCTS+TACK+TDATA(L,R1) +TDATA(L,R2)+ 5TSIFS+ 6δ+TDIFS,
(15)
whereTcandTsare the average times channel is sensed busy
during collision and successful transmission. Here RRTS and RCTS are control packets for coordinating relay-enabled
transmission as shown inFigure 3. In (15), TRRTS1,TRRTS2,
TRCTSandTACKare the transmission times for RRTS1 (source to relay), RRTS2 (relay to destination), RCTS and ACK,
SIFS SIFS SIFS SIFS SIFS NAV(RRTS1/RRTS2) Busy medium (DATA) NAV(DATA)
NAV(RCTS)
Figure3: Carrier sensing scheme of rDCF.
propagation delay.TDATA(L,R1) andTDATA(L,R2) are the times
for data packets of lengthLbytes at ratesR1andR2.
3.2. Analysis of rDCF with Transmission Errors. Due to the nature of rDCF, we must consider all the links: the link
between source and relay (with probability of bit errorsPb1
and distance dsr), the link between relay and destination
(with probability of bit errorsPb2and distancedrd), and the
link between source and destination (with probabilityPband
distancedsd). As a result, the probability of packet errors for
the rDCF protocol and overhead caused by packet errors can
be derived as (16) and (17).
In (16),Pe is the probability of packet errors, which is
based on transmission of individual packets (control and data) involved in rDCF. Note that for packets following RRTS1 their probability of error is conditioned on successful
reception of previous packets. For RRTS2 in (16), probability
of error is based on the successful reception of RRTS1. In the same way total probability of error is based on the successful reception of all control and data packets.
Probability of packet error is calculated based on the bit error probability of a particular link and length of that
packet. In (17) we work out the average time spent in all the
packets in error, respectively:
PRRTS1
Expressions (18) to (27) are derived and simplified based
Jetx(l)=ρtxTeRRTS1+ρσ(δ+TEIFS), (24)
Jrx
e (l)=ρrxTeRRTS1+ρσ(δ+TEIFS), (25)
Jrx
e (r)=ρrxTeRRTS1+ρσ(δ+TEIFS), (26)
Jerx(∼l)=ρrxTeRRTS1+ρσ(δ+TEIFS), (27)
whereTACKtimeout=TACK+TSIFSandTRCTStimeout =TRCTS+
TSIFS. It is evident that for RRTS1 in error the time spent is shortest and for ACK in error the time spent is the highest.
From (18) to (27) we have derived further parameters
for rDCF. In rDCF, the total number of control and data
packets is six, which is the sum of r, s, t and u. This
information is substituted in (7) and (8) to derive (18) to
(21) for rDCF. We make use of (7) to derive (18)–(20)
for rDCF. In (18) and (19), the probability of successful
reception by relay and destination in rDCF is shown. In
(20), the probability of successful reception by overhearing
nodes in rDCF is shown. In the same way, (8) is used for
the derivation of (21), showing the probability of successful
transmission by the source in rDCF. Now to address collision
in rDCF we make use of (9) and (10), to derive (22) and
(23). Expressions (22) and (23) show the probability of
reception and transmission of collided packets by destination
and source nodes, respectively. Similarly, (24) to (27) shows
the probability of transmission (by source) and reception (by relay, destination and overhearing nodes) of packets in error.
Further we have shown the calculation for the Te for the
RRTS1.
InSection 4, we perform rigorous performance analysis to show energy consumption, impact of change in packet length, performance under transmission errors and decom-position of energy.
4. Performance Analysis
For performance evaluation, we assume that (1) each node always has data to transmit and (2) a relay is available. The results in this section are for combinations of 11
and 5.5 Mbps, denoted by rDCF (R1, R2). A typical set of
parameters used for the evaluation are given inTable 1.
4.1. Energy Consumption. In this section we will show the
energy consumption of rDCF to analyze the effectiveness
of proposed model. We will use it to calculate the energy
consumption (J/MB) of rDCF. Equations (7) to (13) are
modified according to the protocol and are shown for
respective operations in (18) to (27). Expression (11) is used
in existing form. Hereρtx,ρrxandρσare assigned 1.34 watts,
0.90 watts and 0.73 watts, respectively [10]. Here for the ideal
casePe=0.
Figure 4plots expression (14) and shows average energy consumed by each node in one slot of IEEE 802.11 and rDCF
for different rate combinations. Data rates used for IEEE
802.11 is 2 Mbps and for rDCF combinations of 5.5 and
11 Mbps. Packet length of 1000 Bytes,CWmin =32,m =5
andm=6 are used. Energy consumption per slot of 802.11
and rDCF increases with the number of nodes.
Table1: rDCF parameters [6,11]. Physical characteristic IEEE 802.11 b DSSS
CWmin 32
m 5
m 6
DIFS 50μs
SIFS 10μs
EIFS DIFS + SIFS + ACK
Slot 20μs
MAC header 272 bits
PHY header 192μs
RTS 160 bits/control rate + PHY
header
CTS 112 bits/control rate + PHY
header
ACK 112 bits/control rate + PHYheader
RRTS1 256 bits/control rate + PHY
header
RRTS2 260 bits/control rate + PHY
header
RCTS 120 bits/control rate + PHYheader
Data Rates 1, 2, 5.5, 11 Mbps
Control Rate 2 Mbps
Propagation Delay 1μs Antenna height 1.5 meters
Transmit Power 15 dBm
Loss 0 dB
Shadowing deviation 10 dB
Data Rates and Modulations
BPSK @ 1 Mpbs, QPSK @ 2 Mbps, CCK5.5 @ 5.5 Mbps, CCK11 @ 11 Mbps
Receiver Sensitivity −94 dBm,−91 dBm,
−87 dBm,−82 dBm
Figure 5plots (6) and shows average payload per node transmitted and received in one slot and is the same for
802.11 DCF and rDCF rate combinations.Figure 6plots (5)
and shows the average energy consumed in transmitting and receiving 1 MB of data at packet length of 1000 Bytes in ideal channel. Energy grows linearly with the increasing number of nodes. As seen all rate combinations of rDCF perform in a similar fashion but rDCF (11, 11) achieves slightly higher savings.
As observed in this section, energy consumption grows linearly with node density. Therefore, it is important to analyze the performance of relay based schemes, to see the impact on energy with change in packet length and
effectiveness of the proposed method. It is also important
to observe the decomposition of energy to make efficient
utilization of energy.
0.5 Figure4: Average energy (J) consumed in one slot.
0.5
Figure5: Average payload (MB) transmitted and received in one slot.
from the following results that this model helps in predicting the energy consumption and it is encouraging to observe that using a relay not only results in higher throughput
but is energy efficient as well. As a consequence of these
results we conclude: (1) relay based transmissions are energy
efficient and (2) relaying for others saves energy for the
whole network.
4.2. Impact of Change in Packet Length. Since rDCF (11, 11)
is the most energy efficient under ideal channel conditions,
we use it for the performance analysis. We analyze the per-formance of rDCF (11, 11) with varying packet sizes of 100, 500 and 1000 bytes in ideal channel conditions. The rest of
the parameters used are the same as inSection 4.1.Figure 7
0
Figure6: Energy consumed (J/MB) for 802.11 DCF and rDCF in ideal channel.
plots the average energy (J/MB) consumed in transmitting and receiving 1 MB of data. The energy consumption grows linearly with number of nodes while the slope depends on the packet size. It is interesting to see that the results are in agreement with the findings of single hop 802.11 DCF, that is, it is still advantageous to transmit large payloads. This is true even with the doubled overhead used due to relay based transmission.
4.3. Performance under Transmission Errors. For the perfor-mance of rDCF (R1, R2) under transmission errors we
con-sider bit error probabilities of different modulation schemes
used in IEEE 802.11b under Additive White Gaussian Noise (AWGN). The bit error probabilities for BPSK, QPSK, CCK
5.5 and CCK 11 can be easily obtained from [12] to calculate
the corresponding packet error rate. In this paper we use the two-ray ground reflection model and card specifications
of ORINOCO11b in NS-2 [13]. The two-ray ground model
consists of two parts: (1) Free space path loss for distances
less than the Friss cutoffdistance,dfrissand (2) The two-ray
propagation loss for distances greater thandfriss. The bit error
rates below were obtained using the two-ray ground model
wheredfriss=230 meters and antenna heighthtandhr=1.5
meters.
We consider two scenarios: (a) for the symmetric (i.e.,
Pb1 equal to Pb2) and (b) the asymmetric link (i.e., Pb1
not equal toPb2) are shown inFigure 8. For the symmetric
scenario we have placed relay exactly between source and
destination (i.e., dsd =400 m @ 2 Mbps with Pb = 10−5,
dsr =drd =200 m @ 5.5 Mpbs withPb1=Pb2 =3×10⁻⁹).
The probability of errors for the direct link is 10−5(which is
equivalent to a packet error rate of 8% at a packet length of 1000 bytes). Error probabilities for relay links are worked out
relatively based on [13].
For the asymmetric scenario, we have placed relay closer
0 20 40 60 80 100 120 140 160
Energ
y
consump
ti
on
(J
oules/MB)
0 5 10 15 20 25 30 35 40 45 50
Number of nodes 100
500 1000
Figure 7: Energy consumed (J/MB) for rDCF (11, 11) in ideal channel at different packet sizes.
0 5 10 15 20 25 30 35
Energ
y
co
nsumption
(J
o
ules/MB)
0 5 10 15 20 25 30 35 40 45 50
Number of nodes Symmetric
Asymmetric Ideal
Figure8: Energy consumed (J/MB) for rDCF in channel errors.
dsr = 160 m @ 11 Mpbs withPb1 =10−7anddrd =270 m
@ 5.5 Mpbs withPb2=7×10⁻⁶).
We can observe much higher energy consumption for the rDCF (symmetric and asymmetric) in transmission errors as compared to rDCF (ideal). The energy consumption almost doubles for both the symmetric and asymmetric cases, whereas the symmetric and asymmetric scenarios results in
similar energy consumption. The difference between the two
scenarios is very small and is mainly due to the average time
calculation for errors (shown in the Appendix) with different
rate combinations.
0 2 4 6 8 10 12 14 16
(J
oules/MB)
0 10 20 30 40 50 60
Number of nodes Idle
Reception by intended node Reception by intended relay Reception by overhearing nodes Reception of collided packet Successful transmission Transmission of collided packet
Figure9: Decomposition of energy (J/MB) for rDCF (11, 11) in ideal channel.
5. Decomposition of Energy Consumed
To show the decomposition of energy, rDCF (11, 11) in the ideal case, a packet length 1000 bytes is used. From the
decomposition of energy in Figure 9, we can observe the
energy consumed in various operations. The operations can be mainly classified as useful and overheads.
The useful operations are successful transmission (by source) and successful reception of packets (by relay and destination).
The overhead operations which waste energy are success-ful reception of packets (overhearing nodes), reception of collided packet, transmission of collided packet and staying idle. It is observed that the energy consumed in successful transmission and reception of data by destination and relay is almost constant. Here it is interesting to see that most of the energy is consumed in listening/overhearing by other nodes. This increases with respect to the number of nodes. In addition to this the energy consumed in receiving collided packet and staying idle also increases with the increase in number of nodes.
Further to this we can see from theFigure 10
Table2: Energy consumption of rDCF.
Energy consumption (J/MB) 5 nodes 50 nodes
rDCF (11, 5.5) Ideal 1.75 16.89
rDCF (11, 5.5) Errors 1.98 29.52
0 5 10 15 20 25 30 35
(J
oules/MB)
0 10 20 30 40 50 60
Number of nodes Idle
Reception by intended node Reception by intended relay Reception by overhearing nodes Reception of collided packet Successful transmission Transmission of collided packet Transmission of packet in error
Reception of errored packet by intended node Reception of errored packet by intended relay Reception of errored packet by overhearing nodes
Figure10: Decomposition of energy (J/MB) for rDCF (11, 5.5) in channel with errors.
of this protocol by devising a policy which can reduce the energy consumption by overhearing nodes.
Energy consumption of rDCF is shown in Table 2. In
error rDCF consumes 11.6 % and 42.7% extra energy at 5 and 50 nodes, respectively. This analysis allows us to
design energy efficient protocols by predicting the energy
consumption. Finally, it can be used for the prediction of energy consumption and will benefit the design of MAC protocols for energy critical environments.
6. Conclusions
We have presented a general analytical energy model for relay based MAC protocols. This model assumes saturated environment and collision of first control packet only. This model is applicable to both ideal channel and transmission errors. This model can be used to illustrate energy consump-tion of any relay based MAC protocol with modificaconsump-tion in accordance to the protocol flow and to cater for any physical layer with change in parameters. Further this model will
help in devising energy saving mechanisms/policies based on the energy consumption behavior and decomposition of
energy. We have used rDCF as a case to show the efficacy
of our proposed analytical model. This model also shows the decomposition of energy for relay based MAC which is of interest to protocol designers. Extensive performance analysis for the relay based MAC has also been provided. We have analyzed energy consumption under the impact of varying packet sizes and rate combinations. We have shown that transmission errors can greatly escalate the energy consumption as it will give rise to overhearing again. Possible future work includes the extension of the above model to the unsaturated case and to obtain experimental results from real life scenario.
Appendix
Equation for Packet in Error
Here we have shown the extended equations (by replacing
(24) to (27) by (A.1) to (A.4)) for the error averaged over all
packets and used in Figures8and10:
Jetx=ρtxTRRTS1+ρσ(TEIFS+δ) +ρtxTRRTS1+ρrxTRRTS2
+ρσ(TEIFS+TSIFS+ 2δ) +ρtxTRRTS1
+ρrxTRRTS2+ρσ(TRCTStimeout+TDIFS+TSIFS+ 3δ)
+ρtx
TRRTS1+TDATA(L,R1)
+ρrx(TRRTS2+TRCTS)
+ρσ(TEIFS+ 4δ+ 3TSIFS)
+ρtx
TRRTS1+TDATA(L,R1)
+ρrx
TRRTS2+TRCTS+TDATA(L,R2)
+ρσ(TEIFS+ 4TSIFS+ 5δ)
+ρtx
TRRTS1+TDATA(L,R1)
+ρrx
TRRTS2+TRCTS+TDATA(L,R2)
+ρσ(TACKtimeout+TDIFS+ 4TSIFS+ 6δ),
(A.1)
Jrx
e (l)=ρrxTRRTS1+ρσ(TEIFS+δ) +ρrx(TRRTS1+TRRTS2)
+ρσ(TEIFS+TSIFS+ 2δ) +ρrx(TRRTS1+TRRTS2)
+ρσ(TRCTStimeout+TDIFS+TSIFS+ 3δ)
+ρrx
TRRTS1+TDATA(L,R1)+TRRTS2+TDATA(L,R2)
+ρtxTRCTS+ρσ(TEIFS+ 5δ+ 4TSIFS)
+ρrx
TRRTS1+TRRTS2+TDATA(L,R1)+TDATA(L,R2)
+ρtxTRCTS+ρσ(TACKtimeout+TDIFS+ 4TSIFS+ 6δ),
Jerx(r)=ρrxTRRTS1+ρσ(TEIFS+δ) +ρrxTRRTS1+ρtxTRRTS2
+ρσ(TEIFS+TSIFS+ 2δ) +ρrxTRRTS1+ρtxTRRTS2
+ρσ(TRCTStimeout+TDIFS+TSIFS+ 3δ)
+ρrx
TRRTS1+TDATA(L,R1)+TRCTS
+ρtx
TRRTS2+TDATA(L,R2)
+ρσ(TEIFS+ 5δ+ 4TSIFS)
+ρrx
TRRTS1+TDATA(L,R1)+TRCTS
+ρtx
TRRTS2+TDATA(L,R2)
+ρσ(TACKtimeout+TDIFS+ 4TSIFS+ 6δ),
(A.3)
Jrx
e (∼l)=ρrxTRRTS1+ρσ(TEIFS+δ) +ρrx(TRRTS1+TRRTS2)
+ρσ(TEIFS+TSIFS+ 2δ) +ρrxTRRTS1+ρrxTRRTS2
+ρσ(TRCTStimeout+TDIFS+TSIFS+ 3δ)
+ρrx
TRRTS1+TDATA(L,R1)+TRRTS2+TDATA(L,R2)
+ρrxTRCTS+ρσ(TEIFS+ 5δ+ 4TSIFS)
+ρrx
TRRTS1+TRRTS2+TDATA(L,R1)+TDATA(L,R2)
+ρrxTRCTS+ρσ(TACKtimeout+TDIFS+4TSIFS+6δ).
(A.4)
References
[1] A. Nosratinia, T. E. Hunter, and A. Hedayat, “Cooperative communication in wireless networks,”IEEE Communications Magazine, vol. 42, no. 10, pp. 74–80, 2004.
[2] H. Zheng, Y. Zhu, C. Shen, and X. Wang, “On the effectiveness of cooperative diversity in ad hoc networks: a MAC layer study,” inProceedings of the IEEE International Conference on Acoustics, Speech, and Signal Processing (ICASSP ’05), vol. 3, pp. 509–512, March 2005.
[3] M. M. Carvalho, C. B. Margi, K. Obraczka, and J. J. Garcia-Luna-Aceves, “Modeling energy consumption in single-hop IEEE 802.11 ad hoc networks,” inProceedings of the Interna-tional Conference on Computer Communications and Networks (ICCCN ’04), pp. 367–372, 2004.
[4] X. Wang, J. Yin, and D. P. Agarwal, “Analysis and optimization of the energy efficiency in the 82.11DCF,”Mobile Networks and Applications, vol. 11, pp. 279–286, 2006.
[5] M. Ergen and P. Varaiya, “Decomposition of energy consump-tion in IEEE 802.11,” inProceedings of the IEEE International Conference on Communications (ICC ’07), pp. 403–408, June 2007.
[6] H. Zhu and G. Cao, “rDCF: a relay-enabled medium access control protocol for wireless ad hoc networks,”IEEE Transac-tions on Mobile Computing, vol. 5, no. 9, pp. 1201–1214, 2006. [7] R. Ahmad, F.-C. Zheng, M. Drieberg, S. Olafsson, and M. Fitch, “Modelling energy consumption of relay-enabled MAC protocols in ad hoc networks,” in Proceedings of the 4th
International Symposium on Wireless and Pervasive Computing (ISWPC ’09), Melbourne, Australia, February 2009.
[8] G. Bianchi, “Performance analysis of the IEEE 802.11 dis-tributed coordination function,” IEEE Journal on Selected Areas in Communications, vol. 18, pp. 535–547, 2000. [9] H. Wu, Y. Peng, K. Long, S. Cheng, and J. Ma, “Performance
of reliable transport protocol over IEEE 802.11 wireless LAN: analysis and enhancement,” in Proceedings of the Annual Joint Conference of the IEEE Computer and Communications Societies (INFOCOM ’02), vol. 2, pp. 599–607, 2002.
[10] L. M. Feeney and M. Nilsson, “Investigating the energy consumption of a wireless network interface in an ad hoc networking environment,” inProceedings of the Annual Joint Conference of the IEEE Computer and Communications Soci-eties (INFOCOM ’01), vol. 3, pp. 1548–1557, April 2001. [11] IEEE 802.11b, Part II, “Wireless LAN Medium Access Control
(MAC) and Physical Layer (PHY) Spec: High Speed Physical layer Extension in the 2.4 GHz Band,” supplement to IEEE 802.11 Standard, 1999.
[12] J. del Prado Pavon and S. Choi, “Link adaptation strategy for IEEE 802.11 WLAN via received signal strength measure-ment,” inProceedings of the IEEE International Conference on Communications (ICC ’03), vol. 2, pp. 1108–1113, Anchorage, Alaska, USA, May 2003.
![Table 1: rDCF parameters [6, 11].](https://thumb-us.123doks.com/thumbv2/123dok_us/934878.1113689/7.600.309.544.87.507/table-rdcf-parameters.webp)
