P R O C E E D I N G S
Open Access
Population structure at different minor allele
frequency levels
Omar De la Cruz
*, Paola Raska
From
Genetic Analysis Workshop 18
Stevenson, WA, USA. 13-17 October 2012
Abstract
Inferring population genetic structure from large-scale genotyping of single-nucleotide polymorphisms or variants is an important technique for studying the history and distribution of extant human populations, but it is also a very important tool for adjusting tests of association. However, the structures inferred depend on the minor allele frequency of the variants; this is very important when considering the phenotypic association of rare variants. Using the Genetic Analysis Workshop 18 data set for 142 unrelated individuals, which includes genotypes for many rare variants, we study the following hypothesis: the difference in detected structure is the result of a“scale” effect; that is, rare variants are likely to be shared only locally (smaller scale), while common variants can be spread over longer distances. The result is similar to that of using kernel principal component analysis, as the bandwidth of the kernel is changed. We show how different structures become evident as we consider rare or common variants.
Background
Inferring population genetic structure from large-scale genotyping of single-nucleotide polymorphisms (SNPs) or variants (SNVs), often performed using principal compo-nent analysis (PCA) [1] or model-based clustering [2], is an important technique for studying the history and distri-bution of extant human populations [3], but it is also a very important tool for adjusting tests of association [1,4].
Thanks to the increasing availability of sequencing technology, it is possible now to identify very rare var-iants and to type them on large samples of individuals, extending the reach of the genome-wide association study design. However, methods for detecting population structure and for adjusting association tests accordingly, should take into account the fact that the population structures inferred depend on the minor allele frequency (MAF) of the SNVs; this is very important when consid-ering the phenotypic association of rare variants [5].
In this article we show evidence of different structures at different MAF levels. We propose that the difference is a result of a“scale” effect: rare variants are likely to be shared only locally (smaller scale), whereas common
variants can be spread over longer distances. The result is similar to that of using kernel principal component analysis (KPCA) [6] because the bandwidth (ie, scale) of the kernel is changed (De la Cruz and Susan Holmes, work in preparation). This similarity between the beha-vior of PCA at different MAF levels and KPCA at differ-ent scales is further evidence, albeit circumstantial, of the connection between MAF levels and scale.
Using the Genetic Analysis Workshop 18 (GAW18) data set for 142 unrelated individuals, which includes genotypes for many rare variants, we show how different structures become evident as we consider rare or common variants and how these structures transform smoothly as we change the window of allowed MAF values. We suggest that such a procedure provides a more complete picture of the structure of the population.
Methods
We selected at random a set of 82,594 SNVs from the odd-numbered autosomal chromosomes. The set is thin enough that linkage disequilibrium caused solely by proximity along the chromosome does not affect the results substantially. We dropped 133 SNVs that are monomorphic for the set of unrelated individuals, leaving 82,461 SNVs. We did not filter out those variants that
* Correspondence: [email protected]
Department of Epidemiology and Biostatistics, Case Western Reserve University School of Medicine, 10900 Euclid Ave, Cleveland, OH 44106, USA
appear in only 1 individual, even though they are less informative about the relationships between different individuals. It is important, though, to consider the num-ber of such private variants for each individual, as that might add a linear dimension related to the total number of private variants. (Privatehere refers to a variant that appears only once in the sample of 142 individuals. More of these variants can only make an individual more differ-ent from the others, whereas a shared variant can make 2 individuals more alike.)
We sorted the variants by MAF and selected a sliding window of 900 SNVs, going from the rarest variants to the most common. We used a total of 533 such win-dows, which is considered a dense enough concentration to make the continuity of the eigenvalues evident. Because these windows overlapped substantially, the principal component analyses performed on consecutive windows are closely related.
The computation of the principal components was performed via the singular value decomposition, after centering and scaling [7].
Coloring of eigenvalue paths in Figure 1 was done manually, and the color was extended only as far as it seemed clearly defined. In Figure 2, some manual rotations (changing signs, which are arbitrary for eigenvectors, or switching principal component [PC]1 and PC2) were used to make the relationship between panels clearer.
The theoretical argument for the persistence of the eigenvalue-eigenvector relationships as the window slides is given by perturbation theory [8]: Because 2 contiguous
windows share a large number of markers, the corre-sponding variance-covariance matrices are close to each other; consequently, small perturbations of the matrix lead to a small change in the eigenvalues and eigenvec-tors. The behavior is potentially more complicated when eigenvalues cross, because at the crossing point, by defi-nition, there are repeated eigenvalues. However, our experiments suggest that the matching persists even after such crossings in many cases.
Results
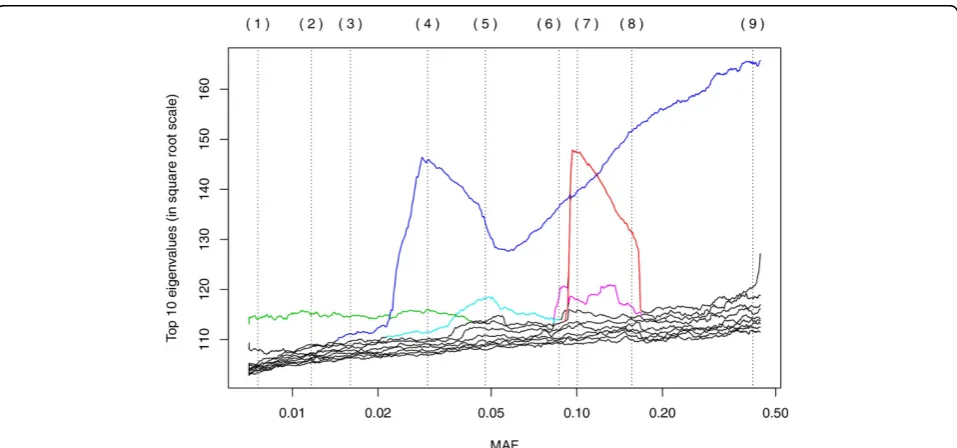
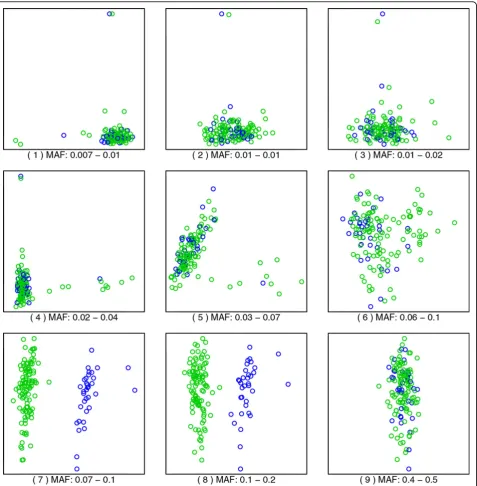
Figure 1 shows how different eigenvalues increase and decrease in value as the MAF changes. In reality, the eigendecompositions are computed independently, and it is difficult to track automatically how each eigenvalue/ eigenvector evolves as MAF changes, but from the plot it is clear that different features become more important at different values of MAF. This is similar to what is observed when the bandwidth (scale) of a kernel is chan-ged in KPCA. Figure 2 contains 9 scatterplots of the top 2 principal components; these panels are labeled (1) to (9), and the corresponding location in the MAF scale is marked by vertical lines in Figure 1. Each panel corre-sponds to the best 2-dimensional representation of the genetic relationships between the unrelated individuals. As we show here, these relationships are different depending on whether we use rare variants (small MAF) or more common variants. The MAF increases from panel to panel, by rows. (The reversions in the plots cor-respond to the arbitrary signs for the eigenvectors in an
Figure 1Eigenvalues for different values of the MAF. Each curve shows the evolution of an eigenvalue as we slide the window of SNVs used in PCA. The colors were selected manually to show likely continuation whenever there is a crossing of eigenvalues. For clarity, the plot shows only 10 eigenvalues. The vertical dotted lines correspond to the locations that were selected for the scatterplot panels in Figure 2.
De la Cruz and RaskaBMC Proceedings2014,8(Suppl 1):S55 http://www.biomedcentral.com/1753-6561/8/S1/S55
eigendecomposition.) Notice how the structure in the first panel is transformed into something different as we progress through the panels.
For MAF values below 0.02, the dominant PCA fea-tures are pairs of points that are set out from the rest (see the Discussion for an explanation). One pairs is picked out by a component that corresponds to the eigenvalue path colored in green in Figure 1; that pair
can be easily located at the top of panels (1) through (4) in Figure 2.
For MAF values above 0.02, the dominant feature cor-responds to the eigenvalue path labeled in blue, except for an eigenvalue path that suddenly rises to promi-nence at MAF 0.09, even surpassing the blue curve briefly, and disappears equally suddenly at MAF 0.15 (colored in red). The“blue”eigenvalues correspond to a
continuous axis, represented vertically in panels (6) through (9), while the“red” eigenvalues capture a clus-tering in the population into 2 clusters (plus 2 outliers). The colors in Figure 2 reflect this clustering; see the Discussion for further details on this phenomenon.
Discussion
Panel (1) in Figure 2, corresponding to a MAF of 0.7% to 1% (rare variants), shows a structure that is com-monly seen in PCA plots of genotype data:“flares”that extend from a central position. There are 3 clusters, with 1 staying at the center and the other 2 radiating away, with some individuals in the middle. As argued in the previously mentioned work in progress by De la Cruz and Holmes, this is likely related to the diversity in each of the clusters. As one considers more common SNVs, that is, higher values of MAF, a different struc-ture arises in panels (6) through (8), a strucstruc-ture that corresponds to the rise of the“red” eigenvalue in Figure 1, showing 2 clusters. Finally, a dominating linear dimension, together with an orthogonal but smaller dimension, appears toward the values of MAF of 40% to 50% (common variants). Notice that we use only 2 com-ponents to facilitate visualization; other comcom-ponents can contain important information, too, and the common practice is to use the top 10 PCs when adjusting for population structure.
The flares in panels (1) through (4) are dominated by a pair of individuals at the tip. These are set out from the rest of the group not because their genotype is dif-ferent, but because they are more closely related to each other than to the rest. In other words, each of these “groups of 2”have reduced diversity, compared with the overall group. Each of these pairs form a feature that becomes more important when observed at a smaller scale. This corresponds to the appropriate eigenvalues rising to the top, and this pattern is evident in Figure 1.
As argued by Mathieson and McVean [5], it can be problematic to perform a PCA-based adjustment for an association test on rare alleles when the structure is computed using common alleles. It is also likely that a population structure estimated using a mix of common and rare alleles will just mix the signals, diluting both types of structures. Our analysis also shows that relying on rare alleles tends to pick up the more closely related pairs of individuals, which is unlikely to be useful in adjusting for population structure.
The most intriguing feature to come out of our analy-sis is the separation in clusters that happens for values of MAF between 0.09 and 0.15. This feature is still pre-sent at other nearby frequencies, but the corresponding eigenvalue drops fast below the others. This clustering is not an artifact of the SNVs selected: When using a
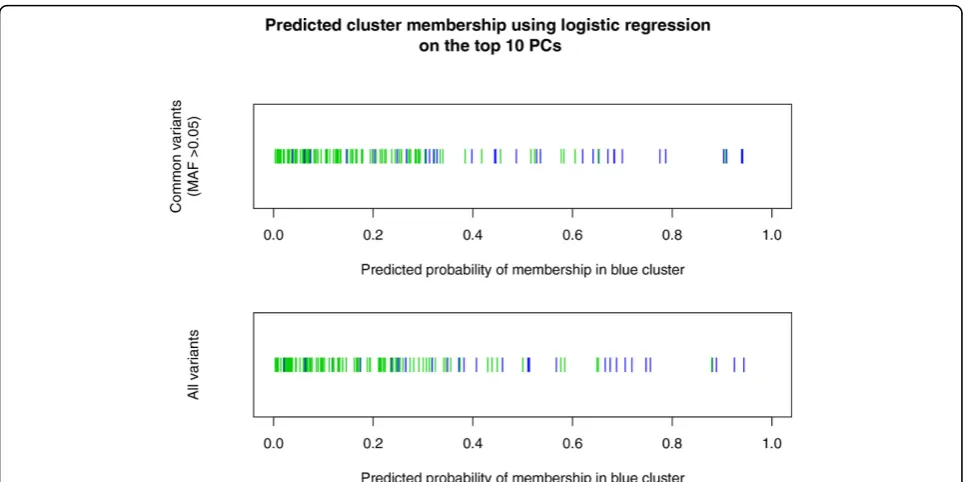
denser panel extracted from chromosome 11, the same feature arises, in the same furtive way (data not shown). It should be noted that this clustering does not become apparent when performing PCA using a panel of SNVs of all MAFs, or when restricted to common variants (MAF >0.05). Indeed, even logistic regression using the top 10 PCs does a poor job of replicating the separation of the clusters (Figure 3). In other words, our multifre-quency analysis (which can be considered multiscale) uncovers important features that a single mixed-fre-quency analysis misses.
We tried to match the cluster to the available pheno-typic data, but none of the following factors matched: sex, status as sequenced versus genotyped-by-chip-plus-imputation, or pedigree membership. (Because this sam-ple was obtained from an admixed population, it is pos-sible that this phenomenon is a consequence of admixture; however, we do not have data on the ances-try proportions of the individuals.) Thus, the true nature of the clustering remains a mystery and should be taken into account when analyzing the data for disease asso-ciations, possibly by including a component in the adjustment that separates the clusters, or by checking any potential discoveries a posteriorifor unequal distri-bution between the 2 clusters.
This is an interesting question: If two individuals share a very rare variant, not only are they likely to be from the same locality, but they are also likely to be some-what related. If this is the case, they will tend to share a higher proportion of common variants than other pairs of individuals. Why then would an analysis based on common variants not give the same information as one based on rare variants? A set of top PCs derived from common markers and the whole sample would pick up only large, continent-wide trends. A PC might pick up local correlation, but it would have a small eigenvalue.
There is an important consequence of the local nature of the components obtained from rare variants: many components might be needed to fully describe the popu-lation structure at the given scale. As an illustration, con-sider the following situation: Two components, derived from common markers, can be enough to capture the main genetic geographical structure on a continent (say, a north-south component and an east-west component). However, if we use components derived from rare alleles, being able to discriminate between neighboring villages, we would need a large number of components to distin-guish all the villages. Thus, the following recommenda-tion can be made: Instead of incorporating a large number of PCs derived from rare variants into the regres-sion tests of association, one should check any discov-eries a posteriori for the possibility of spurious association with one or more of those PCs.
De la Cruz and RaskaBMC Proceedings2014,8(Suppl 1):S55 http://www.biomedcentral.com/1753-6561/8/S1/S55
Conclusions
We believe that a considerable amount of information can be gained by exploring the population structure at differ-ent values of MAF. Using rarer variants corresponds to looking at structures that arise at smaller scales, because rare variants are likely to be shared between individuals located near each other, whereas common variants can be shared at longer distances. We posit that population genetic structure is a multiscale phenomenon, and that to elucidate behaviors at different scales, it is useful to con-sider sets of variants grouped by MAF.
Competing interests
The authors declare that they have no competing interests.
Authors’contributions
ODC and PR designed the overall study, ODC conducted statistical analyses and drafted the manuscript. All authors read and approved the final manuscript.
Acknowledgements
We would like to thank the editor and 2 anonymous reviewers for their valuable comments and suggestions.
Research reported in this publication was supported by the National Cancer Institute of the National Institutes of Health under Award Number R25CA094186. The content is solely the responsibility of the authors and does not necessarily represent the official views of the National Institutes of Health.
The GAW18 whole genome sequence data were provided by the T2D-GENES Consortium, which is supported by NIH grants U01 DK085524, U01 DK085584, U01 DK085501, U01 DK085526, and U01 DK085545. The other
genetic and phenotypic data for GAW18 were provided by the San Antonio Family Heart Study and San Antonio Family Diabetes/Gallbladder Study, which are supported by NIH grants P01 HL045222, R01 DK047482, and R01 DK053889. The Genetic Analysis Workshop is supported by NIH grant R01 GM031575.
This article has been published as part ofBMC ProceedingsVolume 8 Supplement 1, 2014: Genetic Analysis Workshop 18. The full contents of the supplement are available online at http://www.biomedcentral.com/bmcproc/ supplements/8/S1. Publication charges for this supplement were funded by the Texas Biomedical Research Institute.
Published: 17 June 2014
References
1. Patterson N, Price AL, Reich D:Population structure and eigenanalysis. PLoS Genet2006,2:e190.
2. Pritchard J, Stephens M, Donnelly P:Inference of population structure using multilocus genotype data.Genetics2000,155:945-959. 3. Cavalli-Sforza LL, Menozzi P, Piazza A:The History and Geography of
Human Genes.Princeton, NJ, Princeton University Press; 1994.
4. Pritchard J, Stephens M, Rosenberg N, Donnelly P:Association mapping in structured populations.Am J Hum Genet2000,67:170-181.
5. Mathieson I, McVean G:Differential confounding of rare and common variants in spatially structured populations.Nat Genet2012,44:243-246. 6. Schölkopf B, Smola AJ, Müller KR:Kernel principal component analysis.
Advances in Kernel Methods–Support Vector Learning (Edited by Schölkopf B, Burges CJC, Smola AJ) CambridgeMIT Press; 1999, 327-352.
7. Jolliffe IT:Principal Component Analysis.New York, Springer; 2004. 8. Kato T:Perturbation Theory for Linear Operators (Classics in
Mathematics).Berlin, Springer-Verlag,1995.
doi:10.1186/1753-6561-8-S1-S55
Cite this article as:De la Cruz and Raska:Population structure at different minor allele frequency levels.BMC Proceedings20148(Suppl 1): S55.