ABSTRACT
MACHADO, PATRICIA VEIGA SILVA. Traffic Sign Replacement Strategy. (Under the direction of William Rasdorf.).
Traffic signs play a major role in the national highway system because they provide users with important information such as warnings, regulations, and directions. However, signs are subjected to different kinds of damage and deterioration as they age. Therefore, transportation agencies are responsible for replacing unsatisfactory signs and ensuring their visibility and legibility both during the day and at night. The Manual on Uniform Traffic Control Devices (MUTCD) recommends five sign retroreflectivity maintenance methods to ensure that signs perform above minimum retroreflectivity levels required by the manual.
The focus of this dissertation is on sign replacement strategies to maintain signs at satisfactory conditions. A focus was given to mid and large size transportation agencies that do not have sign inventories, which represent a major portion of state DOTs. The objectives of this research were (1) to determine a reasonable sign service life based on previous studies, (2) determine a sign maintenance method suitable for the target agencies, (3) develop a new sign replacement model, (4) identify a field practice that reduces sign material waste and quantify its benefits and costs, and (5) identify a set of optimal sign replacement strategies.
A sign service life between 15 and 20 years was recommended for ASTM microprismatic Type III sign sheeting. After analyzing the five sign maintenance methods recommended by the MUTCD, the research team selected the Blanket Replacement method considering mid and large size agencies because it is simple and straightforward to implement and does not require a sign inventory database.
A microscopic simulation model was developed to study systematic and cost-efficient sign replacement strategies and analyze the trade-off between sign cost and condition. This is the first model to successfully represent blanket replacement being conducted at a rate of one area per year, which results in a balanced workload and cost over time. In addition, benefits of grace period and daytime inspections were quantified for the first time.
blanket replacement cycles (10, 15, 18, and 20 years), three levels of grace period (0, 3, and 5 years), and two levels of daytime sign inspection (presence and absence). The main output measures collected from the simulation include: (1) number of unsatisfactory signs, and (2) strategy cost.
The simulation results indicated that, strategy policies without a grace period and daytime inspections, a shorter replacement cycle (10 years) led to higher costs but also to a lower percentage of unsatisfactory signs than longer replacement cycles (e.g., 20 years). However, the same did not hold true for sign replacement strategies that utilized a grace period and daytime inspections.
Daytime inspections were found to be very efficient in reducing up to 35% the percentage of unsatisfactory signs while only slightly increasing strategy cost (up to 4.7% cost increase). Grace period had a major positive impact on strategy costs, reducing them by up to 12% without having any negative impact on the percentage of unsatisfactory signs.
Traffic Sign Replacement Strategy
by
Patricia Veiga Silva Machado
A dissertation submitted to the Graduate Faculty of North Carolina State University
in partial fulfillment of the requirements for the degree of
Doctor of Philosophy
Civil Engineering
Raleigh, North Carolina 2019
APPROVED BY:
_______________________________ _______________________________ Dr. William Rasdorf Dr. Joseph Hummer
Committee Chair
_______________________________ _______________________________ Dr. Edward Jaselskis Dr. Anderson Queiroz
ii
DEDICATION
iii
BIOGRAPHY
iv
ACKNOWLEDGMENTS
v
TABLE OF CONTENTS
LIST OF TABLES………..……..ix
LIST OF FIGURES……….….xi
1. INTRODUCTION... 1
1.1 Importance of Maintaining Signs... 2
1.1.1 National Crashes Related to Signs ... 3
1.1.2 North Carolina Crashes Related by Signs ... 4
1.2 Sign Retroreflectivity ... 4
1.3 Sign Damage ... 8
1.4 Problem Statement ... 12
1.5 Research Objectives ... 14
1.6 Research Methods Overview ... 15
1.7 Contributions... 16
1.8 Structure of Dissertation ... 17
2. LITERATURE REVIEW ... 19
2.1 Sign Retroreflectivity Deterioration and Compliance ... 19
2.1.1 In-Service Sign Field Survey Studies ... 19
2.1.2 Out-of-Service Sign Studies ... 25
2.1.3 Summary ... 26
2.2 Sign Service Life... 28
2.3 Sign Damage ... 33
2.4 Sign Maintenance Methods... 37
2.4.1 Overview ... 39
2.4.2 Nighttime Visual Inspections ... 41
2.4.3 Measured Retroreflectivity... 43
2.4.4 Expected Sign Life... 44
2.4.5 Blanket Replacement ... 46
2.4.6 Control Signs ... 46
2.4.7 Summary ... 47
vi
2.6 Transportation Management Models ... 52
2.6.1 Maintenance Optimization Models ... 52
2.6.2 Simulation Models ... 55
2.6.3 Summary ... 59
2.7 Summary and Research Gaps ... 60
3. SIMULATION MODEL DEVELOPMENT ... 62
3.1 Methodology ... 62
3.1.1 Types of Models ... 63
3.1.2 Simulation Classification ... 65
3.1.3 Software ... 67
3.2 Simulation Model Overview ... 68
3.3 Input Parameters ... 68
3.3.1 Sign Population by Color and Road Class Percent ... 68
3.3.2 Annual Sign Damage Rate ... 69
3.3.3 Spot Replacement Rate ... 69
3.3.4 Blanket Replacement Cycle... 70
3.3.5 Daytime Inspections ... 71
3.3.6 Sign Retroreflectivity Deterioration Models ... 73
3.3.7 Sign Installation Unit Cost... 74
3.3.8 Daytime Sign Inspection Unit Cost ... 74
3.3.9 Summary ... 75
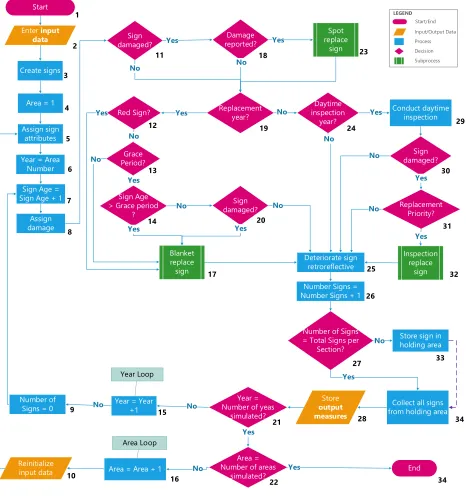
3.4 Simulation Logic ... 76
3.4.1 Sign Damage Sub-Model ... 80
3.4.2 Spot Replacement Sub-Model ... 81
3.4.3 Blanket Replacement Sub-Model ... 82
3.4.4 Daytime Inspection Sub-Model ... 84
3.4.5 Retroreflectivity Deterioration Sub-Model ... 86
3.4.6 Output Measure Sub-Model ... 86
3.5 Output Measures ... 87
3.5.1 Number of Damaged, Noncompliant, and Unsatisfactory Signs ... 88
vii
3.5.3 Number of Replaced Signs ... 89
3.5.4 Daytime Inspection Cost ... 89
3.5.5 Replacement Cost... 90
3.5.6 Strategy Cost ... 90
3.5.7 Number of Years Damaged Signs Remain in the Field... 91
3.5.8 Signs Prematurely Replaced ... 91
3.6 Confidence Interval ... 92
3.7 Number of Replications ... 93
3.8 Simulation Verification and Validation ... 94
3.9 Limitations ... 95
4. CASE STUDY METHODOLOGY ... 97
4.1 Simulation Model... 98
4.2 Sign Maintenance Method Analysis ... 99
4.3 Fixed NC Input Parameters ... 103
4.3.1 Sign Population by Color and Road Class ... 104
4.3.2 Sign Damage Rate... 104
4.3.3 Spot Replacement ... 108
4.3.4 Sign Retroreflectivity Deterioration Models ... 109
4.3.5 Sign Cost ... 110
4.4 Independent Variables ... 112
4.4.1 Blanket Replacement Cycle... 112
4.4.2 Grace Period ... 113
4.4.3 Daytime Inspection ... 114
4.5 Experiment Design: Sign Replacement Strategies ... 115
4.6 Dependent Variables ... 116
4.6.1 Strategy Performance ... 117
4.6.2 Damaged Signs ... 117
4.6.3 Premature Sign Replacement ... 117
4.7 Data Analysis ... 117
4.7.1 Strategy Performance ... 118
viii
4.7.3 Premature Sign Replacement ... 119
5. CASE STUDY RESULTS AND ANALYSES ... 120
5.1 Strategy Performance ... 121
5.1.1 Overall Analysis ... 124
5.1.2 ANOVA ... 129
5.1.3 Multicriteria Analysis ... 136
5.2 Damaged Signs ... 149
5.3 Premature Sign Replacement ... 152
5.3.1 Overall Analysis ... 152
5.3.2 Effective Strategy Cost ... 154
6. CONCLUSIONS AND FUTURE WORK ... 157
6.1 Future Work ... 160
7. REFERENCES ... 162
APPENDICES ... 174
Appendix A. Definitions ... 175
Appendix B. Traffic Sign Retroreflectivity Sheeting Identification Guide ... 180
Appendix C. Manufacturing and Replacement Processes ... 183
Appendix D. Dots’ Sign Management Programs ... 197
Appendix E. NCDOT Standard Practice For Sign Sheeting ... 211
Appendix F. Sign Deterioration And Service Life ... 215
Appendix G. Analysis of The MUTCD Sign Maintenance Methods ... 234
Appendix H. Verification of The Simulation Logic ... 248
Appendix I. Pilot Simulation Study ... 276
Appendix J. Transient Interval Removal Analysis Data Tables ... 295
ix
LIST OF TABLES
Table 1.1. MUTCD (FHWA, 2009) Minimum Maintained Retroreflectivity Levels ...7
Table 1.2. Types, Causes, and Examples of Sign Damage ...10
Table 2.1. Summary of Papers by Sign Noncompliance Rate ...27
Table 2.2. Summary of Papers by State and Sign Service Life ...31
Table 2.3. Summary of Papers by Damage Rate ...36
Table 2.4. Sign Retroreflectivity Maintenance Methods Description, Advantages, and ...40
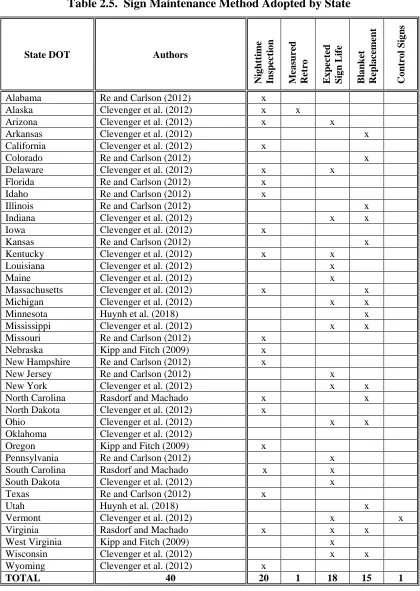
Table 2.5. Sign Maintenance Method Adopted by State ...48
Table 2.6. Summary of Papers by Simulation Features, Inputs Parameters, and Output ... Measures ...59
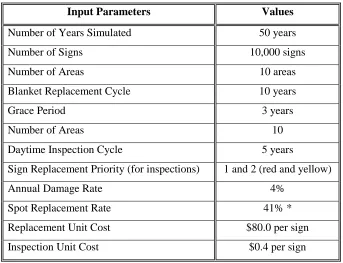
Table 3.1. Input Parameters Summary ...75
Table 3.2. Input Parameters of Simulation Logic Scenario ...78
Table 3.3. Sign Damage ID...81
Table 4.1. Input Parameters Summary ...103
Table 4.2. Sign Count by Color on Primary and Secondary Roads ...104
Table 4.3. Sign Percentage by Color on Primary and Secondary Roads ...104
Table 4.4. Number of Signs Replaced Due to Nighttime Visual Inspections ...105
Table 4.5. Number of Signs Replaced per Year in NC ...106
Table 4.6. Sign Replacement Rate per Year in NC (Low Retroreflectivity and ... Environmental Damage Combined) ...107
Table 4.7. Total Sign Replacement Rate by Reason per Year in NC ...107
Table 4.8. Annual Sign Damage Rate in NC ...108
Table 4.9. Converted Spot Replacement Rate Due Damage in NC ...109
Table 4.10. Sign Retroreflectivity Deterioration Models for Simulation ...110
Table 4.11. Division 9 Sign Installation Labor Productivity in Fiscal Year 2017-2018 ...111
Table 4.12. Maximum Sign Age Considering Replacement Cycle and Grace Period Adopted 114 Table 4.13. Strategies that Consider Daytime Inspections: Daytime Inspection Cycles ... and frequency in Function of Replacement Cycles ...115
Table 4.14. Sign Replacement Strategies and Independent Variables Crossing Levels ...116
Table 5.1. Sign Replacement Strategies and Mean Average Annual Results ...123
x
Table 5.3. Grace Period Impact on Annual Average Strategy Unit Cost (AASUC) ...127
Table 5.4. Natural Scale Range of AASUC ($) and AAPUS (%) ...137
Table 5.5. AAPUS and AASUC in the Common Value Scale (Range from 0 to 100) ...140
Table 5.6. Weight Combinations Interpretation for AAPUS and AASUC ...141
Table 5.7. Weighted Evaluation (WE) Score of Sign Replacement Strategies by ... Weight Combination ...145
Table 5.8. Maximum and Average Number of Years Damaged Signs Remain in the Field ...150
Table 5.9. Number of Signs Prematurely Replaced, Average Remaining Life, and Average ... Annual Premature Replacement Cost ...153
Table 5.10. Effective Strategy Cost Considering Loss Cost for Replacing Good Signs ... Prematurely ...155
xi
LIST OF FIGURES
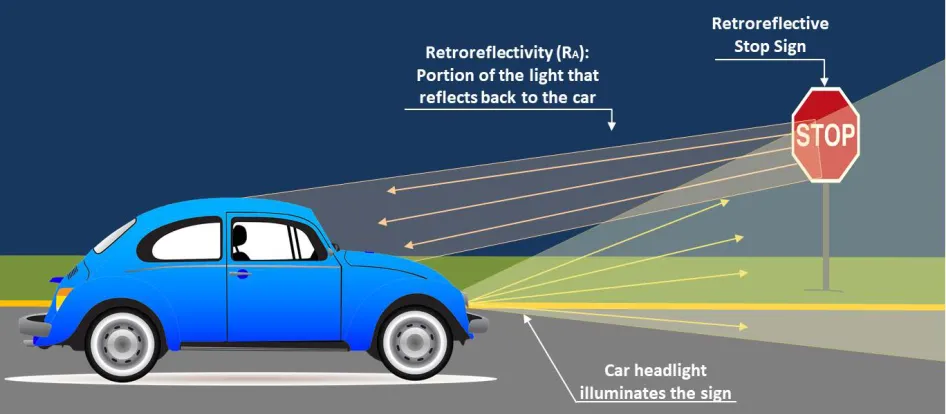
Figure 1.1 Scheme of How Sign Retroreflectivity Works ... 6
Figure 1.2 Scheme of How Retroreflectivity Deterioration Affects Sign Visibility at Night ... 6
Figure 1.3 Example of Deteriorated and Damaged Signs: Faded and Tree Sap Content ... 10
Figure 1.4 Example of damaged Signs: Non-aligned and Spray Painted ... 11
Figure 1.5 Example of damaged Signs: Scratched and Gun Shot ... 11
Figure 1.6 Example of damaged Signs: Dirty, Faded, Cracked, and Bent ... 12
Figure 1.7 Research Methodology Overview ... 15
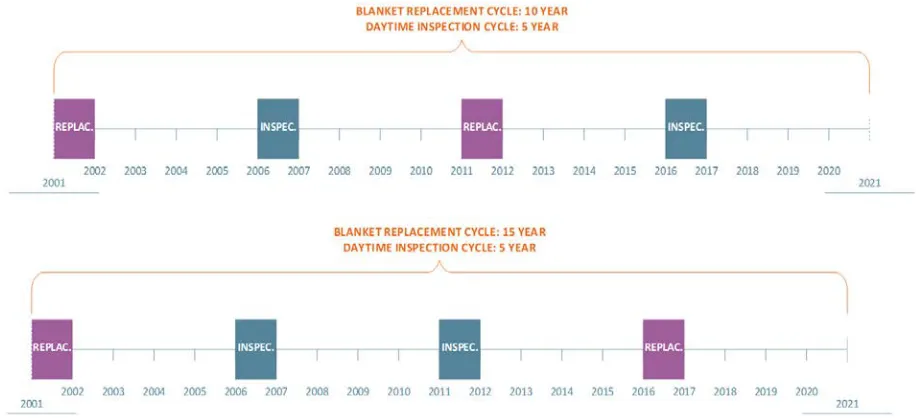
Figure 3.1 Interaction of Daytime Inspection and Blanket Replacement Cycles ... 73
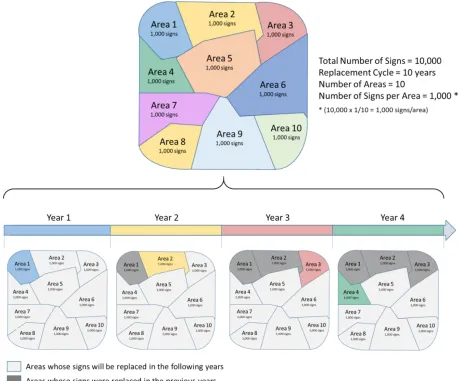
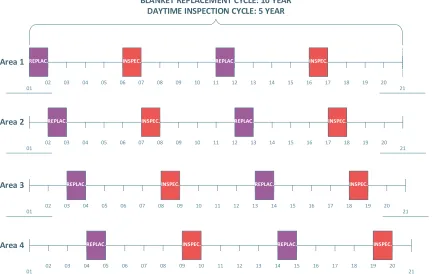
Figure 3.2 Blanket Replacement Strategy Using an Area-Based Approach ... 76
Figure 3.3 Sign Replacement Strategy Simulation Logic ... 79
Figure 3.4 Sign Replacement Years and Daytime Inspection Years for Different Areas ... 85
Figure 5.1 Mean Strategy Cost Versus Blanket Replacement Cycle... 130
Figure 5.2 Mean Strategy Cost Versus Grace Period ... 130
Figure 5.3 Mean Strategy Cost Versus Daytime Inspection ... 131
Figure 5.4 Mean Strategy Cost Versus Interaction of Daytime Inspection and ... Blanket Replacement Cycle ... 131
Figure 5.5 Mean Strategy Cost Versus Interaction of Daytime Inspection and Grace Period .. 132
Figure 5.6 Mean Strategy Cost Versus Interaction of Grace Period and Blanket Replacement ... Cycle ... 133
Figure 5.7 Mean Number of Unsatisfactory Signs Versus Blanket Replacement Cycle ... 134
Figure 5.8 Mean Number of Unsatisfactory Signs Versus Daytime Inspection ... 134
Figure 5.9 Mean Number of Unsatisfactory Signs Versus Interaction of Daytime Inspection ... and Blanket Replacement Cycle ... 135
Figure 5.10 Translation of AASUC Natural Scale to Common Value Scale ... 139
Figure 5.11 Translation of AAPUS Natural Scale to Common Value Scale... 139
1
1. INTRODUCTION
Traffic signs play an important role in transportation systems because they provide drivers with valuable roadway safety information (WTIC, 2013). The Manual on Uniform Traffic Control Devices (MUTCD) (FHWA, 2009) classifies signs as regulatory (e.g., speed limit and stop), warning (e.g., right curve and road closed), and guide signs (e.g., distance guide sign and interstate route). In a study conducted in 2009, Rasdorf et al. (2009) pointed out the importance of traffic signs as being critical part of the transportation system and having a major impact on road safety. A survey conducted by Markow (2007) with 39 transportation agencies also showed that, from the agencies’ perspective, the number one objective of signs is to improve public safety by reducing the number and risk of accidents. Given their importance, it is extremely relevant to ensure that signs are visible and legible to drivers both during the day and at night.
While during the day sunlight makes signs visible (even on a cloudy day), transportation agencies have to find alternative ways to ensure that signs are visible at night. Schertz (2005) reported that although only one-fourth of all travel occurs at night, almost 50% of all traffic fatalities happen at night. To address the nighttime visibility issue, the MUTCD (FHWA, 2009) requires transportation agencies to adopt one of two options: artificial illumination of the sign or signs manufactured with retroreflective sheeting. In the United States, most agencies opted for using retroreflective sheeting instead of artificial illumination of signs (Carlson and Picha, 2009). That is explained by the low maintenance cost of retroreflective signs when compared with the cost of artificial lightning. Nevertheless, there are some transportation agencies that use artificial illumination in special cases such as overhead guide signs in urban areas.
2 and Measured Retroreflectivity methods) and management (Blanket Replacement, Expected Sign Life, and Control Signs).
By improving the nighttime visibility through retroreflectivity compliance, the FHWA expects that drivers will “better navigate the roads at night and thus promote safety and mobility” (FHWA, 2007). In addition, maintaining signs at or above minimum retroreflectivity levels is also part of “FHWA’s efforts to be responsive to the needs of older drivers whose visual capabilities are declining” (FHWA, 2007). Another reason to meet the minimum retroreflectivity requirements of the MUTCD is to reduce liability risk (McCarthy et al, 2013).
Transportation agencies are required to have a sign management program, which includes both a sign maintenance method and a sign replacement strategy. This research focuses on sign replacement strategies and answers the question “is there an implementable lower cost sign replacement strategy that meets or exceeds current sign performance levels?” To answer this question requires a well-founded sign replacement model that accurately links sign replacement, number of unsatisfactory signs, and strategy cost. In case the reader is not familiar with the topic of this dissertation Appendix A presents definitions for a set of technical terms.
1.1Importance of Maintaining Signs
It is imperative that signs are visible during both the day and night. Section 2A.22 (Maintenance) from the MUTCD states that maintenance activities should “consider proper position, cleanliness, legibility, and daytime and nighttime visibility” of traffic signs (FHWA, 2009).
One way of ensuring daytime visibility is conducting inspections during the day to detect missing, damaged, or obstructed signs. With respect to nighttime visibility, signs need to be above the minimum sign retroreflectivity. It is worth mentioning that nighttime visual inspection is just one out of five sign maintenance methods that can be used to comply with minimum retroreflectivity standards. Once sign inspectors identify damaged, deteriorated, or missing signs, they request a service order to replace those signs. Then, those signs are replaced by new signs. The major reasons to replace signs are as follows.
• Deterioration (retroreflectivity, age, and fade)
3
• Damage (environmental, accidental, and vandalism)
• Road reconstruction
• Change in regulations
• Sign is no longer needed
1.1.1 National Crashes Related to Signs
In 2008 a research study was published in which the authors conducted a survey to identify critical crash causations (NHTSA, 2008). The research team collected information about 5,471 crashes, which represented an estimated 2,189,166 crashes nationwide for a period of 2 and a half years. The authors explained that crashes often happen due to a casual chain of events rather that due to a unique event. The research focused on critical reasons for the critical pre-crash event (they consider that a crash is the result of a chain of events and the pre-crash event is the last event of this causal chain). The critical reasons were attributed either to the driver, vehicle, environment, or roadway. The authors noted that these critical reasons should not be confused with the cause of a crash. After analyzing the crash data, the authors found that 39,844 out of 2,189,166 crashes were attributed to roadway critical reasons (e.g., road design, slick roads, and view obstruction). From these roadway-related crashes, around 1,452 (3.6%) were related to signs and signals (e.g., a missing stop sign at an intersection).
Another study (conducted by Retting et al., 2003) analyzed 1,788 crash reports of vehicle crashes at stop signs in four U.S. cities that occurred between 1996 and 2000. The authors found that drivers did not stop at the stop sign in 304 (17%) of all crashes. The researchers stated that most of the crashes where drivers did not stop at the sign happened at night and a portion of the drivers involved in them reported not having seen the stop sign. According to the authors, these findings reinforce the importance of maintaining signs in good conditions and with proper retroreflectivity levels to ensure they are visible at night.
4 society. A severely injured person (who survived the crash) represents an average of $1.0 million in economic costs to society, from which medical costs and lost productivity account for over 80% of the costs. In addition, the research team estimated lifetime comprehensive cost of crashes, which includes both monetary (economic) and nonmonetary lost quality-of-life (e.g., pain, suffering, and death) costs. Doing so, the comprehensive nationwide cost of crashes in 2010 added up to $836 billion. The authors stated that each crash fatality (due to any reason) represents a lifetime comprehensive cost of $9.1 million to the society. A severely injured person (who survived the crash) represents an average of $5.6 million in comprehensive costs to society. These findings highlight the substantial negative impact that motor vehicle crashes have on society.
1.1.2 North Carolina Crashes Related by Signs
In North Carolina, the Division of Motor Vehicles (DMV) published the “2016 Traffic Crash Facts” (NCDMV, 2017) which showed that there were 267,494 crashes in 2016 in NC. From those crashes, 5,442 crashes (2% of total) were related to drivers that disregarded signs. From these sign related crashes, 40 were fatal and 2,493 resulted in injuries.
The “2016 Traffic Crash Facts” (NCDMV, 2017) also calculated an annual comprehensive average crash cost of $25.6 million in NC (all crashes) with an average cost per crash of $77,312.00. Note that this value is an average per crash and does not consider if it resulted in injuries or fatalities. Considering that there were 5,442 crashes related to signs in 2016 (due to drivers that disregarded signs), it was possible to estimate an average annual crash cost of over $420 million in 2016 related to signs in NC. This shows the importance that signs play in safety and the importance of drivers obeying regulatory and warning signs.
1.2Sign Retroreflectivity
5 Figure 1.1 illustrates how sign retroreflectivity works. In this case, a car headlight (original light source) illuminates a retroreflective Stop sign. As the light illuminates the sign, a portion of this light reflects back to the car “in a cone-like shape, centered around the light’s incidental path” (3M, n.d.1) making the sign is visible to the driver. The efficiency of a retroreflective sheeting depends on the how much light disperses (not directed to the driver) and the amount of light that returns to the light source within the cone of retroreflectivity (3M, n.d.2). A higher performance sheeting has less light dispersion.
The level of retroreflectivity of a sign sheeting can be measured by a retroreflectometer and it is known as coefficient of retroreflectivity (RA). The RA is calculated as the ratio of light that strikes the sign and the portion of this light that is reflected back to the source. The retroreflectometer unit of measurement is candelas per lux per meters squared (cd/lx/m2) (Re et al., 2011), which is defined by Immaneni et al. (2009) as “the ratio of light a sign reflects to a driver [candela (cd)] to the light that illuminates the sign [lux (lx)], per unit area [square meter (m2)].”
6
Figure 1.1. Scheme of How Sign Retroreflectivity Works
Figure 1.2. Scheme of How Retroreflectivity Deterioration Affects Sign Visibility at Night
It was in 1984 that the Center for Auto Safety requested the Federal Highway Administration (FHWA) to establish requirements for minimum sign and pavement marking retroreflectivity levels (Immaneni et al., 2007). In 1993, the Department of Transportation Appropriations Act mandated that the FHWA include minimum retroreflectivity standards in the MUTCD. The FHWA included the minimum sign retroreflectivity standards in the MUTCD in 2009 in Section 2A.08 (Maintaining Minimum Retroreflectivity).
7 on the color and the type of sheeting (e.g., Type I, Type III, etc.), which are classified based on the ASTM D4956 standards (ASTM, 2017). Appendix B presents the FHWA 2014 Traffic Sign Retroreflective Sheeting Identification Guide.
Table 1.1. MUTCD (FHWA, 2009) Minimum Maintained Retroreflectivity Levels
Source: MUTCD (FHWA, 2009)
8 sheeting is no longer allowed by the manual. For those colors, transportation agencies can opt for any Type II sheeting and above.
The following traffic signs are exceptions to the MUTCD minimum retroreflectivity levels and do not require compliance with the minimum retroreflectivity standards prescribed in the manual. In those cases, transportation agencies can decide whether or not they will include these signs in minimum retroreflectivity maintenance programs (FHWA, 2009).
• “A. Parking, Standing, and Stopping signs (R7 and R8 series)
• B. Walking/Hitchhiking/Crossing signs (R9 series, R10-1 through R10-4b)
• C. Acknowledgment signs
• D. All signs with blue or brown backgrounds
• E. Bikeway signs that are intended for exclusive use by bicyclists or pedestrians” (Section 2A.08 of MUTCD; FHWA, 2009).
It is important to say that, although MUTCD (FHWA, 2009) specifies minimum sign retroreflectivity levels, it also states that transportation agencies are not required to have 100% of their signs in compliance with the retroreflectivity standards at all times on the condition that those agencies adopt at least one of the sign maintenance methods recommended by the MUTCD (Hummer et al., 2013; Carlson and Picha, 2009) that are known to ensure general compliance with the standard.
1.3Sign Damage
9 survey in Texas that 28% of the signs were significantly damaged. These results show the importance of considering sign damage rate when developing an optimal sign replacement strategy.
There are many types of damage. The literature does not show a standard categorization of the damage types. For instance, Immaneni et al. (2007) organized them into three categories: vandalism, which is deliberately caused by humans (e.g., gunshots and spray paint), natural damage (e.g., mildew and scratches), and accidental, unintentional damage caused by humans (e.g., knockdowns and damage by mowing equipment). Evans et al. (2008) characterized damage differently by organizing sign damage in the following categories: bending, peeling, vandalism, cracking, and other. Table 1.2 shows a list of possible causes of damages that was compiled based on the papers listed above and based on meetings conducted with NCDOT sign maintenance personnel.
10
Table 1.2. Types, Causes, and Examples of Sign Damage Types of Damage
Environmental Accidental Vandalism
Caused By
Tree sap
Tree rubbing
Water (rain and
flood) Wind Snow Sun Sand Mold Dust Pollution Collision Mowing equipment Compressions (storage space)
Stones or debris
Gunshot Stickers Paintball Eggs Spray paint Stones Beer bottle Examples of Damage Scratches Mildew Dirty Bending Broken Knockdown Dirty Holes Stains Graffiti Scratches
Figure 1.3. Example of Deteriorated and Damaged Signs: Faded and Tree Sap Content
11 was no installation date on the back of the do not enter sign. The second sign (stop) was vandalized with white spray paint. Also, it shows signs of fading on the bottom part of it. Ideally, that stop sign would be replaced. The stop sign shown in the Figure 1.4 was installed in 1987 (31 years old).
Figure 1.4. Example of damaged Signs: Non-aligned and Spray Painted
Figure 1.5 shows a damaged guide sign that was installed in 1989 (29 years old). Observing the picture on the left, it is possible to note that the guide signs is bent and contains bullet holes. The picture on the right shows a close-up of a bullet hole on the sign. Note that the background green sheeting is totally damaged around the hole, allowing water infiltration between the sheeting and aluminum and causing possible mold problems.
Figure 1.5. Example of damaged Signs: Scratched and Gun Shot
12 contained a large amount of dirt, which compromised its visibility to drivers. The installation year of the weight limit sign was 2006 (11 years old). Possible causes for this damage are truck emissions or excessive dust in the area. The picture on the right shows a school zone sign, which was faded, cracked, and bent. The installation year of the school sign is unknown.
Figure 1.6. Example of damaged Signs: Dirty, Faded, Cracked, and Bent
1.4Problem Statement
Although there has been significant progress in the field of sign management research in the last few years, there is still room for improvement in some areas. This section lists and describes the problems addressed in this research.
13 Bullock 2002; Evans et al. 2012; Kipp and Fitch 2009; Re et al 2011; and Wolshon et al 2002). Therefore, there is a need to determine a reasonable sign service life based on previous sign retroreflectivity deterioration studies.
Problem 2: Previous studies analyzed and compared different sign maintenance and replacement methods without considering DOT’s resources nor organizational structure. Any asset management program should consider both resources (labor, equipment, material, and technology), organizational structure, and business process. For instance, studies conducted by Harris et al. (2007), Harris et al. (2012), Hummer et al. (2013), and Dumont et al. (2013) did not consider the costs of data collection, sign inventory database implementation, and maintenance in their sign maintenance cost analysis study. However, the absence of a sign inventory database within a transportation agency should be considered a major barrier to the implementation of the Expected Sign Life method. As Rasdorf et al. (2009) pointed out, there are great challenges involved in the development and maintenance of a database for high volume and low-cost assets such as signs. Thus, for NC, which has a large number of signs, tracking all of them can be a difficult task. Therefore, there is a need to analyze the five sign maintenance methods described by the MUTCD while considering NCDOT’s resources, structure, and processes.
Problem 3: Existing models that investigated the Blanket Replacement method did not properly apply the concept of an area-based approach. Although previous studies (e.g., Harris, 2010; Harris et al, 2012; Hummer et al., 2013) analyzed the Blanket Replacement method, they used a different approach from the current study. At the time the foundational work of the previous studies was conducted, the concept of implementing blanket replacement by areas in order to balance workload and expenditures had not been cosidered. Therefore, there is a need to develop a new model for the Blanket Replacement method that considers an area-based approach.
14 one of the major disadvantages of this method, none addressed practices to mitigate the material waste issue. At most, Re and Carlson (2012) described a case in which a grace period was adopted by a state DOT; however, there was not a further assessment nor analysis of that practice. Therefore, there is a need to further investigate practices that have the objective of mitigating sign material waste when adopting the Blanket Replacement method. In addition, a quantification of the benefits of such a practice is also desired.
1.5Research Objectives
One of the objectives of this research is to develop a sign replacement model focused on mid and large size transportation agencies that do not have sign inventory databases. Such a model should be capable of providing these agencies with a set of optimal sign replacement strategies that are systematic, cost efficient, and independent of sign inventory. In addition, sign retroreflectivity deterioration and reasonable service life are assessed as part of optimal sign replacement strategies. The objectives of this research are listed below.
Objective 1: Determine a reasonable sign service life based on previous sign retroreflectivity deterioration studies.
Objective 2: Determine a sign maintenance method suitable for mid and large size transportation agencies that do not have sign inventory database.
Objective 3: Develop a new sign replacement model based on the Blanket Replacement method that will consider an area-based approach. In addition, spot replacement and daytime inspections will also be considered, and their costs and benefits quantified.
Objective 4: Identify a field practice that reduces sign material waste and quantify its benefits and costs.
15
1.6Research Methods Overview
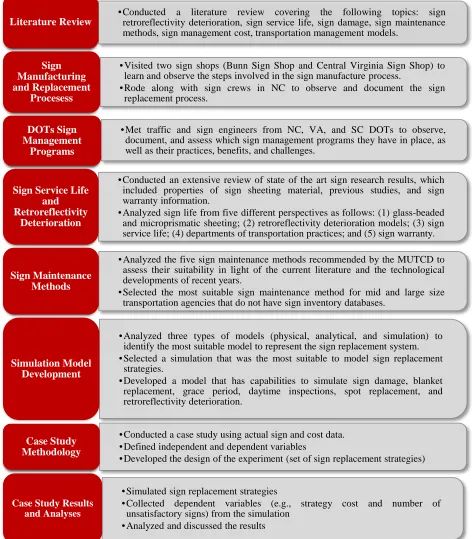
An overview of the research methodology is presented in Figure 1.7. In some cases, a more detailed description of the methodology is described at the beginning of a chapter.
Figure 1.7. Research Methodology Overview
• Conducted a literature review covering the following topics: sign retroreflectivity deterioration, sign service life, sign damage, sign maintenance methods, sign management cost, transportation management models.
Literature Review
• Visited two sign shops (Bunn Sign Shop and Central Virginia Sign Shop) to learn and observe the steps involved in the sign manufacture process.
• Rode along with sign crews in NC to observe and document the sign replacement process.
Sign Manufacturing and Replacement
Procesess
• Met traffic and sign engineers from NC, VA, and SC DOTs to observe, document, and assess which sign management programs they have in place, as well as their practices, benefits, and challenges.
DOTs Sign Management
Programs
• Conducted an extensive review of state of the art sign research results, which included properties of sign sheeting material, previous studies, and sign warranty information.
• Analyzed sign life from five different perspectives as follows: (1) glass-beaded and microprismatic sheeting; (2) retroreflectivity deterioration models; (3) sign service life; (4) departments of transportation practices; and (5) sign warranty.
Sign Service Life and Retroreflectivity
Deterioration
• Analyzed the five sign maintenance methods recommended by the MUTCD to assess their suitability in light of the current literature and the technological developments of recent years.
• Selected the most suitable sign maintenance method for mid and large size transportation agencies that do not have sign inventory databases.
Sign Maintenance Methods
• Analyzed three types of models (physical, analytical, and simulation) to identify the most suitable model to represent the sign replacement system. • Selected a simulation that was the most suitable to model sign replacement
strategies.
• Developed a model that has capabilities to simulate sign damage, blanket replacement, grace period, daytime inspections, spot replacement, and retroreflectivity deterioration.
Simulation Model Development
• Conducted a case study using actual sign and cost data. • Defined independent and dependent variables
• Developed the design of the experiment (set of sign replacement strategies)
Case Study Methodology
• Simulated sign replacement strategies
• Collected dependent variables (e.g., strategy cost and number of unsatisfactory signs) from the simulation
• Analyzed and discussed the results Case Study Results
16
1.7Contributions
This research presents a set of contributions to the body of knowledge in the topical areas noted below. The findings of this research can be considered by transportation agencies and managers to possibly improve the current sign replacement strategies.
Sign service life for microprismatic Type III sheeting. Most previous studies considered sign service life to be the same as sign warranty even though there was evidence that this approach is very conservative and leads to sign material waste (signs replaced before the end of their service life). After analyzing Type III sheeting sign service life from five different perspectives, the research team concluded that DOTs may consider a sign service life ranging anywhere from 15 to 20 years for white, yellow, red, and green signs. This sign service life range is significantly above the sign warranty period of 10 to 12 years for Type III sheeting. This finding would enable DOTs to improve its sign maintenance practices, utilize signs to the full extent of their service life, and free labor resources for other critical transportation infrastructure needs.
Critical analysis (considering agencies’ resources, structure, and processes) of the five sign maintenance methods recommended by the MUTCD. Based on the literature reviewed, various DOTs’ experiences, and typical DOT management policies, the research team observed that there is a trend of transportation agencies transitioning from assessment to management methods to maintain sign retroreflectivity. The research team concluded that the Expected Sign Life method is most appropriate for agencies that have a sign inventory database or small agencies that plan to implement a sign database. However, when considering mid and large size transportation agencies that do not have sign inventory database, the Blanket Replacement method is the most appropriate to comply with the MUTCD requirements.
17 and quantifies the cost of an area-based blanket replacement, which had not been done previously in the literature.
Quantification of grace period benefits. Another contribution of this study was a thorough investigation of a practice to reduce sign material waste when adopting the Blanket Replacement method. From the practices observed in the literature and in the field, utilization of a grace period showed promise for doing so. Therefore, the research team incorporated a grace period sub-model into the sign replacement model. It was the first time that a study included this practice. Grace period was included in the analysis and its benefits were quantified for the first time in a study. Quantification of daytime inspection benefits and costs. Daytime inspections are conducted to identify and replace damaged signs. The research team incorporated a daytime inspection sub-model into the sign replacement simulation sub-model. Daytime inspections were included in the analysis and their benefits and costs were quantified for the first time in a study.
Identification of a set of optimal strategies. Optimal replacement strategies must be realistic and implementable, which requires consideration of budget, available resources (labor, equipment, and material), constraints, and business culture. This research considered all these aspects to develop and analyze different sign replacement strategies. At the end of the study, the research team identified a set of optimal strategies, which included longer replacement cycles, the presence of daytime inspections, and a grace period.
1.8Structure of Dissertation
This dissertation is organized into chapters. Each chapter provides a description of its topic, theoretical and practical contributions, research methods (when needed), findings, and conclusions.
19
2. LITERATURE REVIEW
The first step in this research project was to examine the current literature to determine the extent to which similar work has been attempted and to determine the progress made by researchers and other state DOTs. The literature review is organized by topics that are relevant to the present work as follows: sign retroreflectivity deterioration and compliance, sign service life, sign damage, sign maintenance methods, sign management costs, and simulation-based studies.
2.1Sign Retroreflectivity Deterioration and Compliance
Many studies were conducted to determine retroreflectivity deterioration curves (Black et al., 1991; Immaneni et al., 2009; Clevenger et al. 2012; Pike and Carlson, 2014; etc.). Understanding how sign retroreflectivity deteriorates and which factors are involved in that process are necessary to develop deterioration models. Most researchers estimate sign service life based on the deterioration models developed through field survey studies. This section organized the retroreflectivity deterioration studies into two groups: (1) field survey studies in which researchers collected data from in-service signs that were located in the field, mostly on primary and secondary roads, and (2) studies that collected data from out-of-service signs, meaning that instead of the signs being located on the highway system, they were in a yard or facility where researchers could control some conditions (e.g., avoidance of vandalism).
2.1.1 In-Service Sign Field Survey Studies
20 One of the most comprehensive retroreflectivity study was conducted by Black et al. (1991) in which the authors collected data on 5,722 signs across the U.S., including Types II and III glass beaded sheeting. The authors developed deterioration models for the different colors and sheeting types and found that age was one of the major factors affecting retroreflectivity. In addition to age, the authors also found that precipitation, ground elevation, and temperature were significant factors as well. On the other hand, sign orientation to the sun was not found to be a significant factor on sign deterioration. Another finding was that by washing signs, the retroreflectivity improved by almost 12% in Type II signs and almost 8% in Type III signs. An interesting finding was that most of the signs up to 12 years old were performing above the minimum initial retroreflectivity levels (minimum levels to be considered Type II or III at the moment of manufacturing).
Kirk et al. (2001) conducted a study for the Oregon Department of Transportation (Oregon DOT) to assess which factors affect sign retroreflectivity. The research team collected data on 137 washed signs within Oregon. All signs were Type III and were distributed in four colors (white, yellow, green, and red). Although the authors did not find a strong trend between retroreflectivity deterioration and age, they stated that the variability of retroreflectivity readings was greater for older signs. The deterioration models had low R2 values and therefore would not be suitable for estimating sign service life based on age. The authors also analyzed the effect of sign orientation on retroreflectivity deterioration and found that signs oriented to west and south: had greater retroreflectivity variability than signs oriented to other directions. Kirk et al. (2001) was one of the few studies to show some correlation between retroreflectivity and sign orientation; however, the authors also stated that during the field survey, the orientation of some signs were wrongly recorded, and therefore, the link between retroreflectivity and sign orientation is somewhat uncertain.
21 retroreflectivity levels while only 43% of the signs out of warranty were compliant. The authors found that age was the only significant factor affecting retroreflectivity deterioration. The research team also claimed that by washing sign faces, they obtained an average of 33% improvement in retroreflectivity, which indicates that transportation agencies could clean or wash their signs during maintenance activities in order to increase their sign service life. Based on the field data, Wolshon et al. (2002) developed deterioration models for all combinations of sheeting types and colors; however, they did not state the R2 value of the models.
In a study conducted for NCDOT, Immaneni et al. (2007) collected field data on 1,057 signs across NC, including Types I and III sheeting in four colors (white, yellow, green, and red). The authors conducted a simple retroreflectivity analysis in this paper; however, deterioration was not the main topic of that study. They found that 13% of the 1,057 signs were non-compliant; however, the authors pointed out the fact that most of the noncompliant signs were Type I sheeting, considered to have a shorter sign service life, while most Type III sheeting were still in compliance with the minimum retroreflectivity levels.
22 deterioration models based on the field data to estimate sign service life, they indicated that the R2 values were low and, therefore, the models were somewhat questionable.
Kipp and Fitch (2009) also conducted a study to evaluate different sign maintenance methods for the Vermont Agency of Transportation. The authors collected data on 618 signs Types III and IX in five different colors (white, green, red, yellow, and yellow-green fluorescent); all signs were compliant with the minimum retroreflectivity levels. Of all of the factors studied, the authors found that those affecting retroreflectivity deterioration were sheeting color, type, and manufacturer. In general, Type IX sheeting is more retroreflective than Type III and from the two sheeting manufacturers studied, one had a clearly better performance. Deterioration models were developed; however, as most of the other studies, the R2 values were very low. Although Kipp and Fitch (2009) did not find sign orientation as a significant factor in retroreflectivity deterioration, they indicated that sign orientation can lead a sign sheeting to fade faster.
Evans et al. (2012) collected data on 1,433 signs in Utah and found that 91% of the signs were compliant with minimum retroreflectivity levels. The data set collected by this research team was one of the most complete among the studies reported here, being comparable to Wolshon et al. (2002), Kipp and Fitch (2009), Pike and Carlson (2014), and Pulver et al. (2018). The research team collected data on signs Types I, III, IX, and IX in four colors (white, yellow, green, and red). Beside the basic data collected in most research (sign age, retroreflectivity color and type, location), the authors also collected photos, offset, height, orientation, and visual assessment data. Evans et al. (2012) found that Type I sheeting accounted for most of the noncompliant signs. When analyzed apart, 97% of Type III sheeting signs were compliant. The authors suggested Utah DOT to replace all signs Type I by Type III to increase the retroreflectivity compliance rate.
23 signs age. The authors also found that the number of noncompliant signs increased with an increase in average precipitation, elevation, and seasonal temperature swing.
In a research study conducted for the Minnesota DOT, Preston et al. (2014) studied expected sign service life and used different research methods to do so, including field survey. During the field survey, the research team collected valid retroreflectivity readings in 379 signs. The data collected included sign age, sheeting type (I, IV, IX, and XI) and background color (white, yellow, green, and red). To analyze the data, the authors disaggregated the data into subsets by age, sheeting type, and sheeting color. Mathematical models were developed for all combinations of data set; however, some models were considered inconclusive because they showed sign retroreflectivity increasing as signs aged, which goes against the common knowledge.
Although other models trended downwards, Preston et al. (2014) concluded the amount of data per subset was not enough to validate the models and, and therefore, considered all deterioration models as inconclusive due to the limited data available in each subset. In addition, the R2 values were very low too. At the end, the authors commented that even though the deterioration models were inconclusive, they noted that most signs performed above the minimum retroreflectivity levels, even after achieving the end of warranty period. Based on that, the authors believed that the sign service life could be extend to 12 to 20 years for Type I sheeting and to 15 to 30 years for Types IX, IX, and XI sheeting.
24 downward trend, indicating that sign retroreflectivity was deteriorating as signs aged (the opposite of what they found for Type III sheeting).
25 retroreflectivity levels. The objective of the study was to quantify the reduction in retroreflectivity caused by frost or dew. Thus, the researcher collected data of 130 Type I and glass beaded Type III in service signs (in eastern Canada) in different conditions. For all 130 signs, retroreflectivity measures were collected for three conditions (dry, frost, and dew). The author found that when signs were frost, the retroreflectivity levels reduced by almost 80%, in some case, being below the minimum levels required by the MUTCD. Signs covered with dew had an average reduction of 60% of retroreflectivity. The author concluded that in regions where frost and dew are common, agencies need to consider them when adopting a sign maintenance method. In addition, better quality of sheeting should be used in those areas based on the fact that Type III sheeting had overall better performance than Type I sheeting.
2.1.2 Out-of-Service Sign Studies
Few retroreflectivity studies have been conducted with signs that are located on a controlled environment (e.g., yard or facility). These signs are referred to as out-of-service signs because they are not installed along roads of a highway system. This section will discuss some of these studies that collected sign data in a control sign facility (or yard). In other words, researchers installed signs of different materials and colors on yards that frequently were surrounded by fences with the objective of avoiding any kind of vandalism. Then, research teams would collect retroreflectivity data through the years. There are two main reasons to conduct sign control studies. The first reason is to keep track of the retroreflectivity of control signs as a representative sample of all in-service signs; when the control signs achieve retroreflectivity levels below than the minimum required by MUTCD, all in-service signs that are represented by that control group is replaced (Kipp and Fitch, 2009). The second reason is also to track sign retroreflectivity deterioration through the years; however, in this case, the goal of the researchers is to collect enough retroreflectivity data to develop valid deterioration models (Jiang and Zhou, 2012; Huang et al., 2013; and Preston et al., 2014).
26 signs) through the years with the objective of determining when in-service signs made of the same type of material and color should be replaced
Jiang and Zhou (2012) analyzed 12 years of sign data of 130 retroreflective signs (Types I, II, and III) installed in a control sign facility (yard) in Beijing, China, and concluded that age was one of the main factors affecting sign retroreflectivity. In addition, the authors also listed temperature, altitude, climate, and humidity as being significant factors in sign retroreflectivity deterioration. The authors developed retroreflectivity deterioration models and, although the R2 values were low, they stated that quadratic and cubic models were better than linear models to predict sign retroreflectivity as a function of sign age.
Similar, Huang et al. (2013) conducted a retroreflectivity study in 2013 in China where they observed and measured retroreflectivity of 230 signs located in a control sign facility (test square) for over 12 years. The variety of signs included Types I, II, and III in three colors (white, green, and blue). A quickly and important note here is that sign sheeting in China is referred in a different way. According to the authors, Type I is high-intensity grade in China and Type III is engineering grade in Chine. Therefore, we must be careful to avoid any confusion with U.S. nomenclature. The researchers developed deterioration models in function of sign age for all combinations of sheeting types and colors, and based on the results, the authors stated that quadratic and cubic models resulted in better R2 values than linear models (same as Jiang and Zhou, 2012). They also recognized that the R2 values were not high, but that was consistent with previous studies. Preston et al. (2014) also installed a sign rack with new and used traffic signs in one of the Minnesota DOT’s facility. The researchers planned to collect sign retroreflectivity deterioration data through the years and, based on that data, to develop deterioration models. According to the authors, it would be possible to estimate sign service life for different sheeting materials (Types I, IV, IX, and XI) and colors based on the deterioration models.
2.1.3 Summary
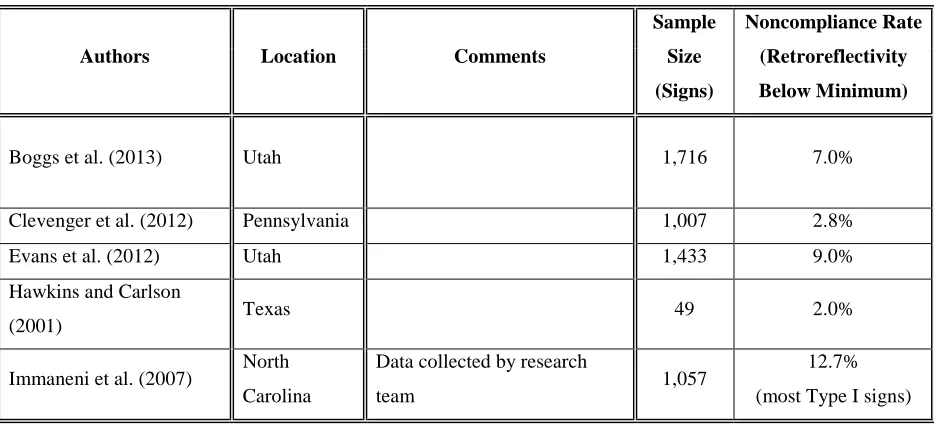
27 orientation, only two out of seven studies considered it as significant in retroreflectivity deterioration. Pulver et al. (2018) found that degree of shade was a significant factor and that signs in the shade tend to deteriorate faster because they often contain mildew and dirt. It was the first time that degree of shade was considered as a variable in a retroreflectivity deterioration study. In relation to sign retroreflectivity compliance with the minimum levels required by the MUTCD (FHWA, 2009), Table 2.1 shows a summary of the field survey studies by noncompliance rate. Note that most studies found compliance rates above 90% (Kirk et al, 2001; Kipp and Fitch, 2009; Re et al., 2011; Clevenger et al., 2012; Evans et al., 2012; Dumont et al., 2013; Boggs et al, 2013; Hawkins and Carlson, 2014; Pike and Carlson, 2014; and Pulver et al., 2018). One of the few studies that found noncompliance rates greater than 10% was Immaneni et al. (2007), but the authors justified that most of the noncompliant signs were Type I sheeting. Wolshon et al. (2002) found that 57% of the signs that were over the warranty period were noncompliant with the minimum retroreflectivity levels; however, if only Type III signs are considered in the analysis, the percentage of noncompliant signs that are over guarantee drops to 40.7%.
Table 2.1. Summary of Papers by Sign Noncompliance Rate
Authors Location Comments
Sample
Size
(Signs)
Noncompliance Rate
(Retroreflectivity
Below Minimum)
Boggs et al. (2013) Utah 1,716 7.0%
Clevenger et al. (2012) Pennsylvania 1,007 2.8%
Evans et al. (2012) Utah 1,433 9.0%
Hawkins and Carlson
(2001) Texas 49 2.0%
Immaneni et al. (2007) North Carolina
Data collected by research
team 1,057
12.7%
28
Table 2.1. Summary of Papers by Sign Noncompliance Rate (continued)
Authors Location Comments
Sample
Size
(Signs)
Noncompliance Rate
(Retroreflectivity
Below Minimum)
Khalilikhah et al. (2015) Utah
Noncompliance rate by type:
Type I: 74%
Type III (glass beaded): 97%
Type III (prismatic): 0%
Type IX: 0.5%
Type XI (prismatic): 0%
1,466 7.3%
(most Type I signs)
Kipp and Fitch (2009) Vermont 618 0%
Kirk et al. (2001) Oregon Signs within 10 years; based
on Oregon DOT standards 137 0%
Pike and Carlson (2014) Wyoming 525 0%
Pulver et al. (2018) South
Carolina 1,599 < 1%
Re et al. (2011) Texas Signs 10 to 12 years: 2%;
Signs 12 to 15 years: 8% 859 1%
Wolshon et al. (2002) Louisiana Signs within warranty 149 8%
Wolshon et al. (2002) Louisiana Signs over warranty 88 57%
2.2Sign Service Life
Sign service life (also known as life expectance) is the time between the installation (or manufacturing) of an asset and its replacement (or removal). In the case of signs, their service life can be determined by age rather than by routine inspections with the objective of tracking retroreflectivity and damage (Thompson et al., 2012). Based on a survey of 39 transportation agencies, Markow (2007) reported a sign service life ranging from 10 to 30 years depending on the sign sheeting type and color.
29 signs before retroreflectivity deteriorates below the minimum required, which increases the costs to maintain signs (Re et al., 2011; Re and Carlson, 2012; Preston et al., 2014; and Pike and Carlson, 2014).
Re and Carlson (2012) explained that a warranty period of a sheeting does not represent its true service life; instead, it refers to a period in which it is expected the sign retroreflectivity to deteriorate 20% in relation to its initial value (of a brand-new sign). In addition, manufacturers need to be somewhat conservative with relation to the warranty period because it is the same for different regions under totally different weather conditions (e.g., Alaska and Arizona) (Re and Carlson, 2012). Preston et al. (2014) cited that one of the explanations for signs performing well above the minimum retroreflectivity standards is the fact that sheeting manufacturers keep improving the quality of retroreflective sheeting.
Immaneni et al. (2009) were able to estimate sign service life by sheeting type and color. From the two types of sheeting studied (Types I and III), the most relevant results are those that refers to Type III sheeting, which are commonly used nowadays. For Type III sheeting, the authors found that the sign service life is about 20 to 30 years for white sheeting, 24 years for both yellow and red sheeting, and 37 years for green sheeting. Preston et al. (2014) also concluded that the sign service life could be extend to 12 to 20 years for Type I sheeting and to 15 to 30 years for Types IV, IX, and XI sheeting. Similarly, Pike and Carlson (2014) conducted a study for Wyoming DOT and also found that signs were performing well above the minimum retroreflectivity levels after the end of the warranty period. The authors found that it could be considered a sign service life of at least 13 to 14 years for Type III sheeting and at least 15 to 21 years for Type IV sheeting horizontally applied (depending on the sheeting color). Overall, the authors recommend that the Wyoming DOT adopt a sign service life of at least 15 years.
30 Kipp and Fitch (2009) conducted a study for Vermont DOT and at the end they recommended the transportation agency adopt 15 years for red signs and 15 to 20 years for white, yellow, and green signs. Clevenger et al. (2012) conducted an interesting survey with various DOT offices in many states to assess relevant information related to signs maintenance methods. Two sets of information were relevant for this body of knowledge: (1) which signs maintenance methods the DOTs were adopting and (2) what was the sign service life the DOTs were adopting. Dumont et al. (2013) also conducted a similar study, but in that case, the sign service life information was obtained through literature review instead of surveys.
A filed survey was conducted by Clevenger et al. (2012) who collected data of 1,000 signs located in Pennsylvania. Although the authors could not establish a direct correlation between sign age and retroreflectivity deterioration, they stated that, based on the observed data, there was enough evidence that signs between 16 and 18 years would still be above the minimum retroreflectivity levels.
On the other hand, different from all previous studies, Pulver et al. (2018) recommended South Carolina DOT (SCDOT) to consider sign service life as 10 years, the same as the sign warranty period in SC. The authors developed retroreflectivity deterioration models that predicted minimum sign service life of 25 years for red signs, 12 years for yellow signs, and 11 years for both white and green signs (the study did not specify the type of sheeting analyzed). However, despite the deterioration models predictions, the authors recommended SCDOT to keep their sign service life of 10 years (which is currently based on the warranty period of SC signs). The research team explained that such recommendation was based on failure rate.
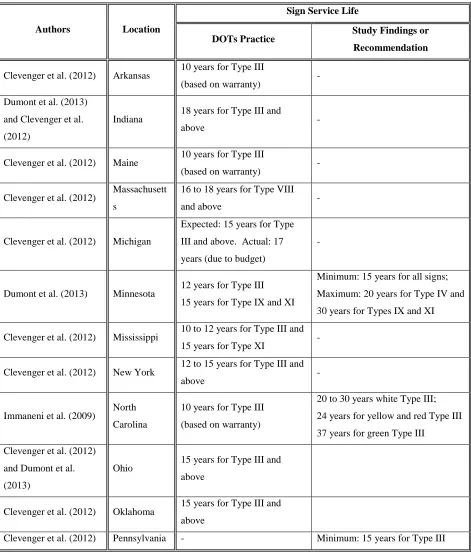
31 predicting sign service life than is the failure rate. A summary of the papers related to sign service life is presented in Table 2.2 and it is organized by authors, location, and sign service life.
Table 2.2. Summary of Papers by State and Sign Service Life
Authors Location
Sign Service Life
DOTs Practice Study Findings or
Recommendation
Clevenger et al. (2012) Arkansas 10 years for Type III
(based on warranty) -
Dumont et al. (2013)
and Clevenger et al.
(2012)
Indiana 18 years for Type III and
above -
Clevenger et al. (2012) Maine 10 years for Type III
(based on warranty) -
Clevenger et al. (2012) Massachusett s
16 to 18 years for Type VIII
and above -
Clevenger et al. (2012) Michigan
Expected: 15 years for Type
III and above. Actual: 17
years (due to budget)
-
Dumont et al. (2013) Minnesota 12 years for Type III 15 years for Type IX and XI
Minimum: 15 years for all signs;
Maximum: 20 years for Type IV and
30 years for Types IX and XI
Clevenger et al. (2012) Mississippi 10 to 12 years for Type III and 15 years for Type XI -
Clevenger et al. (2012) New York 12 to 15 years for Type III and
above -
Immaneni et al. (2009) North Carolina
10 years for Type III
(based on warranty)
20 to 30 years white Type III;
24 years for yellow and red Type III
37 years for green Type III
Clevenger et al. (2012)
and Dumont et al.
(2013)
Ohio 15 years for Type III and
above
Clevenger et al. (2012) Oklahoma 15 years for Type III and
above
32
Table 2.2. Summary of Papers by State and Sign Service Life (Continued)
Authors Location
Sign Service Life
DOTs Practice Study Findings or
Recommendation
Pulver et al. (2018) South Carolina
10 years for Type III
(based on warranty) 10 years for Type III and above.
Clevenger et al. (2012) South Dakota
12 years for Type III
15 years for Types IV, VI,
VIII, and X; 18 years for
Types IX and XI
-
Kipp and Fitch(2009)
and Clevenger et al.
(2012)
Vermont 15 years for Type III
15 years for red Type III
15 to 20 years for white, yellow, and
green Type III (Kipp and Fitch,
2009)
Clevenger et al. (2012) Virginia 15 years for Type IX -
Clevenger et al. (2012)
and Dumont et al.
(2013)
Wisconsin 12 years for Type III -
Clevenger et al. (2012)
and Pike and Carlson
(2014)
Wyoming 12 years for Type III
Minimum: 13 to 14 years for Type
III
15 to 21 for Type IV
Recommendation: 15 years
(Pike and Carlson, 2014)
33
2.3Sign Damage
Although sign retroreflectivity rates are important, transportation agencies also should take into consideration sign damage rates when choosing the adoption of one or more of the sign maintenance methods described by the MUTCD (FHWA, 2009). Major damages cause loss of sign legibility, which can represent a risk for drivers because enables signs to convey the message to drives (Boggs et al., 2013). The damage issue is more critical by the fact that the sign legibility is affected both during the day and at night (Khalilikhah et al., 2016). Another factor to be considered by transportation agencies is the cost to maintain and replace damaged signs with the objective to offer a satisfactory overall sign condition to the population. Therefore, transportation agencies need to consider damage in their sign maintenance program.
Many studies were conducted to investigate sign damage caused and rates across the U.S. The most common method used by researchers to assess sign damage was conducting visual assessment while doing field survey. Khalilikhah et al. (2016) was one of the few studies that used an equipped car to register images of signs and then process the information.
For instance, Immaneni et al. (2007) studied sign damage rates in NC. The research team rejected 197 out a total of 1,057 inspected signs due to low retroreflectivity and/or damage. According to the authors, a sign could be rejected due to one or more reasons (e.g., low retroreflectivity and paintball marks). Sign damage was classified into vandalism (e.g., gunshots and paintball marks) and natural damage (e.g., tree sap). The results showed that from the 197 rejected signs, 40% were vandalized and 30% presented natural damages. The research team also stated that the overall sign replacement rate due to damage per year in NC was 4.7% of all signs.
34 were average annual precipitation, seasonal temperature swing, elevation, and location (canyon mountain, urban, and rural). The author suggested that by knowing in which locations signs have higher damage rate, transportation agencies can distribute better their resource allocation in order to maintain sign visibility and legibility. Evans et al. (2012) also collected data of 1,433 signs throughout Utah (1.5% of Utah DOT’s sign inventory) and found the damage rates in two of the four regions of Utah Department of Transportation were significant, ranging from 25% to 30% of the surveyed signs.
Khalilikhah et al. (2016) conducted a study to correlate sign vandalism and demographics of local population. The research team collected information and images of 97,314 signs using an equipped car in Utah. From the signs surveyed, almost 7% were damaged and were classified into three categories (aging/environmental, vandalism, and unknown). The authors stated that from those damaged signs, at least 22% was caused by vandalism (equivalent to 1.5% of the 97,314 signs). The findings showed that counties with higher population populated, higher-income, and higher education (at least one associate degree) have a lower vandalism rate.
Khalilikhah and Heaslip (2016) also investigated the effect of damage on sign visibility by conducting a field survey in which they collected data and resisted photos of 1,683 signs in Utah, from which 8% were damaged. The authors found that damage was a significant factor contributing to sign retroreflectivity deterioration for glass beaded Type III sheeting. According to the authors, when glass beaded Type III signs were damaged, they had lower retroreflectivity performance than undamaged signs. However, the same did not hold true for prismatic Type III, IX, and XI. Signs manufactured with these materials had a higher performance (retroreflectivity levels) independent of being damaged or not.
35 of the signs were rejected due to damages and inconsistency on the sign face rather than due to low retroreflectivity. The authors pointed out that most of the rejected signs were Type I sheeting, which Texas DOT had been replacing by Type III since 1993. Based on these results, Hawkins and Carlson (2001) concluded that measuring sign retroreflectivity is not enough for a sign maintenance program; visual assessment of the sign is useful in detecting damages and inconsistencies that affect the sign legibility, and therefore, which signs should be replaced. Pike and Carlson (2014) observed different types of damage during a field survey in which they collected data on 525 signs in Wyoming. Besides retroreflectivity data, the authors also observed major sign damages, including damages caused by shotgun, vandalism (stickers and spray paint), errant vehicles, and dirt. The authors found that 21.5% of the signs were damaged even though all surveyed signs were above the minimum retroreflectivity levels. The authors also stated only Type I signs presented color fading issues. The same was not noted for Type III and IV signs. Pike and Carlson (2014) concluded that that although signs were performing well above the minimum retroreflectivity levels, they would most likely need to be replaced before the end of their service life due to damages.
36 respect to signs, one of the first questions on the NCDOT online form is if the problem is with a stop sign. Then, it is asked if the person is reporting a knocked down or a damaged signs. Those questions help the agency to organize their priority to replace or repair the reported signs.
Table 2.3. Summary of Papers by Damage Rate
Authors Location
Sample
Size
(Signs)
Damage (by type)
Overall
Damaged
Vandalism Aging
Natural
and
Accidental
Unknown
Boggs et al.
(2013) Utah 1,716 6.0% 4.6% 12.0% 28.0%
Evans et al.
(2012) Utah 1,433 8.6% - 19.8%
Khalilikhah
et al. (2016) Utah 97,317 1.5% 3.0% 2.4% 7%
Khalilikhah
and Heaslip
(2016)
Utah 1,683 8%
Hawkins and
Carlson
(2001)
Texas 49 - - 51.0%
Immaneni et
al. (2007)
North
Carolina 1 1,057 7.4% 5.7% -
Immaneni et
al. (2007)
North
Carolina 2 1,681 1.3% 0.9%
2.3% *
4.7% **
Pike and
Carlson
(2014)
Wyoming 525 11.0% 11.0% 21.5%
1 Data collected by the NCSU research team 2 Data collected by NCDOT sign inspection crews
* Damage rate of sign identified during field inspection.