THE
EFFECTS OF r- AND K-SELECTION
ON
COMPONENTS OF
VARIANCE FOR TWO QUANTITATIVE TRAITS
THOMAS LONG A N D GREGORIA LONG
Department of Zoology and the Genetics Curriculum, University of North CaroEina, Chapel
Hill,
North Carolina27514
Manuscript received June 21, 1973
ABSTRACT
The genetic and environmental components of variance for two quantita- tive characters were measured in the descendants of Drosophila melanogaster
populations which had been grown for several generations a t densities of 100,
200, 300, and 400 eggs per vial. Populations subject to intermediate densities had a greater proportion of phenotypic variance available for selection than populations from either extreme. Selection on either character would be least effective under pure r-selection, a frequent attribute of selection programs.
ARGALEF (1958) suggested that the genotypes selected for reproductive
rate in the early stages of succession will differ from the genotypes selected
for efficiency in utilization of scarce resources in later stages of succession. MAC-
ARTHUR
and
WILSON
(1967) called selection for reproductive rate “r-selection”
and selection for efficiency in resource utilization “K-selection.” Some genetic
consequences of the two types of selection were explored with respect to allele
frequency at a single locus by KING and ANDERSON
(1971).
But
nearly all char-
acters of practical interest are controlled by the combined effects of alleles a t
many loci and influenced to some extent by the environment as well. W e have
therefore chosen to observe the effects of r- and K-selection on two quantitative
traits in experimental populations.
W e subjected larvae of
Drosophila melanogaster
to four levels of crowding:
100,
200,
300,
and 400 eggs per vial. Under conditions of 100 eggs per vial, all
the viable larvae formed adults. The likelihood of a n individual of the previous
generation being represented by offspring was proportional to the number of
fertile eggs laid per female, or the number of inseminations per male (high r),
since eggs were transferred without regard to genotype. Under conditions of suc-
cessively higher densities, fewer of the larvae survived the competition for food
to emerge
as
adults. The phenotypes favored at higher densities should be those
which were better at exploiting a limited environment (high
K)
.
Four selection
lines were established, one for each density. Each line was subjected
to
selection
every second generation, with alternate generations being grown in non-com-
petitive conditions (r-selection) so that high-density lines could recover from the
stress
of
food limitation
so
the different levels
of
selection would be operating
on a comparable group of eggs in each selective generation. The only differences
among the selection lines were produced in the selected generations where the
developing larvae were subjected
IOvarious degrees of K-selection. The crowded
lines were therefore subject to alternate r- ar?d K-selection while the uncrowded
lines were subject to continuous r-selection.
Following the fifth generation of selection and the fifth generation in a com-
mon, non-competitive environment, estimates were made
of
the genetic param-
eters involved in the inheritance of sternopleural bristle number and wing length.
These characters were chosen for ease
of
measurement rather than for any in-
terest in bristle number and wing length as such, in the hope that both would
respond similarly to the selective regimes involved in the experiment and thus
provide a basis for generaiization. The response to crowding of descendants of the
selected populations was also measured, providing evidence that populations
subject to higher densities produce a greater biomass from a limiting amount of
food. The entire experiment was repeated on an independent sample
of
flies. but
both experiments had to be combined in analysis in order to provide statistically
significant differences.
MATERIALS A N D METHODS
The flies used in each of the two experiments were descended from at least ten inseminated Drosophila melanogaster females caught near Chapel Hill in woods where over-ripe fruit was discarded by nearby roadside vendors. The first set of flies was captured in June, 1969, and maintained in the laboratory for about five months before the experiment was initiated. The second set of flies was captured in June 1970 and the first selection was begun one generation later.
MITTLER
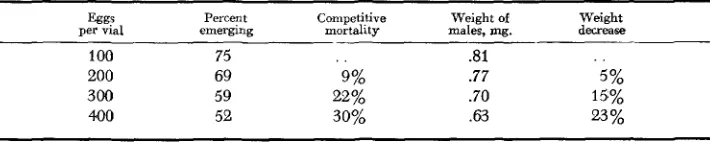
and BENNEIT'S (1962) medium was used throughout, and the flies were always maintained in a 25" constant temperature incubator with light and a fan.We began each experiment by distributing eggs among vials at different densities. There were 8 ml of food per vial. 400 eggs were placed in each of two vials, 300 in two vials, 200 in two vials, and 100 in each of four vials. The flies emerging from these vials were treated as four selection lines, one for each density. Table 1 shows the effect of increasing density on emergence and on the weight of emerging males, averaged over the whole experiment. The flies emerging from the more crowded vials were considerably smaller than the uncrowded flies, and laid many fewer eggs than the uncrowded flies. The second generation was therefore raised in uncrowded circumstances. Four hundred eggs were collected from the flies which emerged in each selection lines and 200 were placed i n each of two bottles, with 50 ml of food. There was no crowding in these bottles; an average of 76% emerged at ;n average weight of .89 mg per male. The flies emerging from these uncrowded bottles were collected as virgins. A few days after emergence was complete, males from each selection line were mixed with females of that line, and their eggs were collected over two- or three-hour intervals so that all the eggs in each vial were nearly the same age. Again there were four vials of 100 eggs each and two vials of 200, 300, and 400 eggs each.
TABLE 1
Effects of K-selection procedure
Percent Competitive Weight of Weight
per vial emermm mortallts males. m. decreae
100 200 300 400
75 69 59 52
~~~~~
.81
9% .77 5%
22% .70 15%
R- A N D K-SELECTION
569
After the relaxed generation following the fifth generation of selection (the ninth generation of the experiment), the sternopleural bristle numbers of males and virgin females were counted and twenty pair matings were made a t random. After four or five days, the parents were re- moved from the vials and their wings mounted on slides for later measurement. A profile projec- tor (Ehrenreich Photo-Optical Industries LP-2) was used to magnify the wings fifty-fold, SO
they could be measured with a centimeter rule to the closest half-centimeter. The measure used was the distance from the intersection of the anterior crossvein with the fourth longitudinal vein to the intersection of the third longitudinal vein with the marginal vein. Twelve days after the matings, the bristle numbers of five male and five female progeny from each mating were counted, and single wings from three males and three females from each mating were mounted for later measurement. Four replicate sets of twenty matings were made for each selection line
in each experiment, providing eight estimates of each parameter.
From the bristle and wing measurements of parents and offspring, we were able t3 estimate three variance components for each set of matings. The additive genetic variance was estimated as twice the covariance of offspring and midparent. The component of variance due to differences between right and left sides of individual flies was estimated from the parent flies alone. This has been called asymmetry variance, but we follow REEVE (1960) in calling it “chance variance.” The chance variance was calculated as the variation of right and left sides about their mean. As a component of variance it contributes only half this value to the total phenotypic variance, since the values for each fly were based on the average of both sides. Means and standard errors of variance components were calculated under the square root transformation, which makes the distribution of estimates more nearly normal. Estimates of the additive genetic variance (from comparison of parents and off spring) and chance variance (within parents) were substracted from the total phenotypic variance of the parent flies to provide an estimate of the remaining components of variance, primarily non-additive genetic variance and environmental variance, in the parents.
The flies which were not used for estimating components of variance were mated at random to produce eggs fer testing response to crowding for each selection line. Four hundred eggs were again collected during a three- or four-hour period after mating and placed in a vial with 8 ml of food. The adult flies which emerged were counted and the males weighed. An estimate of the biomass produced in each vial was obtained by multiplying the number of flies emerging by the average weight of male flies.
RESULTS
Means and estimated components of variance for the four selections lines are
set out in Tables 2 and
3.
Inspection of the composition of the total phenotypic
variance
(V,)
graphically (Figures
1
and 2) shows no striking similarities. Some-
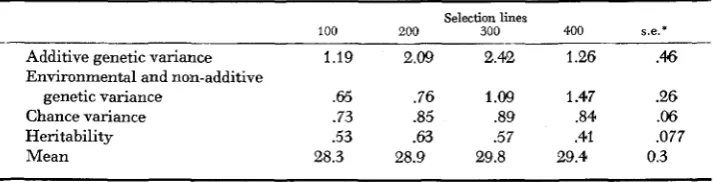
TABLE 2
Bristle number: components of variance and means
Selection lines
100 200 300 400 se.*
_ _ -
Additive genetic variance 1.19 2.09 2.42 1.26 .46
Environmental and non-additive
genetic variance .65 .76 1.09 1.47 9 6
Chance variance .73 .85 .89 .84 .06
Heritability .53 .63 .57 .41 .077
Mean 28.3 28.9 29.8 29.4 0.3
TABLE 3
Wing lengths: components of variance and means
Selection lines
100 200 3M) 400 s e . *
Additive genetic variance 131 147 1 92 126 34
Environmental and non-additive
genetic variance 150 95 109 151 18
Chance variance 22 24 20 2.3 2.5
Mean (2xIW3mm) 728 728 73 1 743 3.6
Heritability .# .57 .60 .43
.w
*
Average standard error, based on 28 degrees of freedom.100 2 0 0 300 400
Select
ion
Li nes
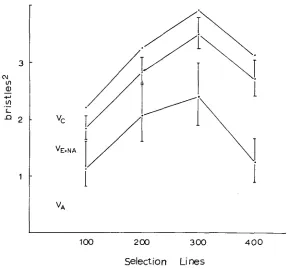
FIGURE 1.-Components of variance for sternopleural bristle number, as a function of K-selection density. The components are additive genetic variance (V,) between abscissa and lower line, environmental and non-additive genetic variance (V, +N,) between lower and
middle lines, and chance variance (V,) between middle and upper line. The phenotypic variance is roughly equal to the sum of estimates of individual components, here represented by the upper line. Standard errors of the first two components of variance are indicated.
R- A N D K-SELECTION
*7
6
-h2
.5-4
571
-
-
-
100 2 0 0 303 400
Selection Lines
FIGURE 2.-Components of variance for wing length, as a function of K-selection density. Arrangement and abbreviations as in Figure 1.
T
1 0 0
200
300 4 0 0Selection
Li
nes
150
:
$130E
110-.-
-
-.-
2301
-
1
Ai---
-
i
T
1901
1
FIGURE
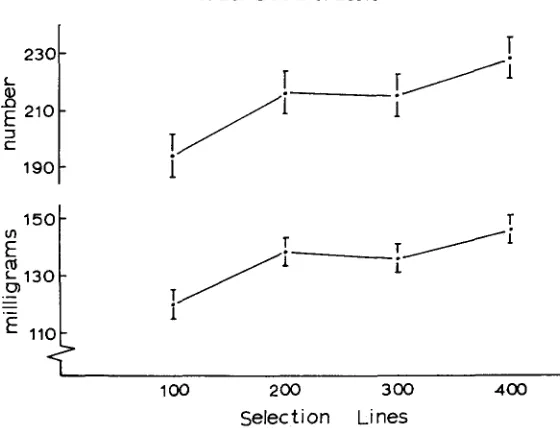
4.-Response to a density ofMO eggs per vial, as a function
of K-selection density. Upper line, total number of flies emerging as adults. Lower line, biomass of emerging flies in milligrams. Standard errors of the estimates are indicated.400-egg lines
( t
=
2.62). This suggests that the heritability may vary similarly
in the two characters
as
a function of larval density.
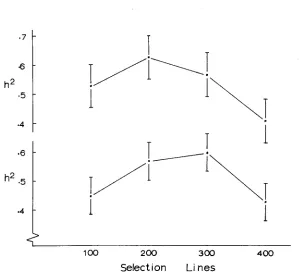
Figure
3
shows that the intermediate densities do have higher heritability for
both characters than the extreme densities, the difference being significant in the
case of wing length
( t
=
2 . 2 7 ) .
Figure 4 shows that the selection lines did respond to differential selection for
ability to utilize a limiting resource. When tested after a generation in a common
environment, the number of individuals emerging and the biomass produced un-
der a density of 400 eggs per vial is found to be highest in the 400-egg selection
line and lowest in the 100-egg selection line.
DISCUSSION
The differences observed in this study are most likely genetic, since the meas-
urements were made on flies raised in a common environment. There is, never-
theless, the possibility that environmentally-produced effects were carried over
from previous K-selection generations.
R- AND K-SELECTION
5
73
While selection for bristle number or wing length
is
less efficient at high densi-
ties, it may well be more effective because the greater selection intensity possible
with higher numbers of eggs offsets the lower heritability. Selection would be
least effective, under the conditions of this experiment, for populations subject
only to r-selection. Simultaneous r-selection is nevertheless a frequent feature of
selection programs. For instance, densities are often controlled by culling some
number of individuals without regard f o r numbers per parent. This practice is a
form
of
r-selection, since the likelihood of individuals leaving offspring is pro-
pwtional to their fecundity.
We are indebted to HENRY SCHAFFER, JANIS ANTONOVICS, ERNEST CARL, and two reviewers for suggesting improvements in drafts of the manuscript. We gratefully acknowledge support from the University Research Council of the University of North Carolina, Chapel Hill.
LITERATURE CITED
KING, CHARLES E. and WYATT W. ANDERSON, 1971
MACARTHUR, ROBERT
H.
and EDWARD 0. WILSON, 1967MARGALEF, RAMON, 1958
MITTLER, S. and J. BENNETT, 1962
REEVE,
E.
C. R., 1960Age-specific selection. 11. The interaction
The Theory of Island Biogeography.
Mode of evolution of species in relation t o their places in ecological
A simple food medium that requires no live yeast with the
Some genetic tests on asymmetry of sternopleural chaeta number i n Dro-
Corresponding editor: T. PROUT
between r and K during population growth. Am. Naturalist
105:
137-156Princeton University Press, Princeton, New Jersey.
succession. XVth Int. Cong. Zool. Proc. 10: 787-789.
minimum of variables. Drosophila Inform. Serv. 36: 131-132.