Article
1
Using Multiple Index Comprehensive Method to
2
Assess Urban Rainstorm Disasters Risk in Jiangsu
3
Province, China
4
Junfei Chen 1,2,3,*, Mengchen Chen 2 and Pei Zhou 2
5
1 State Key Laboratory of Hydrology-Water Resources and Hydraulic Engineering, Hohai University,
6
Nanjing 210098, China;
7
2 Institute of Management Science, Hohai University, Nanjing 210098, China;
8
3 National Engineering Research Center of Water Resources Efficient Utilization and Engineering Safety,
9
Hohai University, Nanjing 210098, China;
10
* Correspondence: [email protected]; Tel.: +86-25-6851-4613
11
12
Abstract: A new model for risk assessment of urban rainstorm disasters, based on information
13
diffusion method and variable fuzzy sets (IDM-VFS) was proposed. In addition, an integrated index
14
system of urban rainstorm risk was established. In the proposed model, IDM was employed to
15
calculate the classification standards of urban rainstorm risk levels, then the VFS was adopted to
16
assess the dangerousness, sensitivity, vulnerability and comprehensive risk of urban rainstorm
17
disasters. In the present study, the urban rainstorm risk of Jiangsu province was evaluated with the
18
proposed model. The results show that Wuxi, Changzhou, Nanjing and Suzhou have higher
19
dangerousness, due to sustained rainfall and strong rainfall intensity in short duration; Wuxi,
20
Changzhou and Nanjing have higher sensitivity because of lower disaster resistance ability; and
21
Wuxi and Suzhou have higher vulnerability because these cities have higher potential losses in face
22
of urban rainstorm disasters. The comprehensive risk zoning map of urban rainstorm shows
23
apparent regional characteristics: the northwestern cities have lower risk than the southern cities.
24
Moreover, most cities of the Jiangsu province are of the moderate urban rainstorm risk level. The
25
results are consistent with the actual situation of Jiangsu province, and the study can provide some
26
decision-making references for the urban rainstorm management.
27
Keywords: urban rainstorm disasters; risk assessment; information diffusion method (IDM);
28
variable fuzzy sets (VFS); Jiangsu province
29
30
1. Introduction
31
With the global climate change and the rapid developments of the urbanization, many cities are
32
suffered extreme rainstorm events frequently [1]. About 15% of the global population is under the
33
threat of the rainstorm disasters as a consequence of combined impacts of climate change
34
phenomenon and rapid population growth, also the rainstorm events tend to increase both in
35
frequency and magnitude [2-4]. According to EM-DAT and Munich RE disaster databases, flood losses
36
account for 28% of the total global disaster losses. Now the urban rainstorm disasters occur more
37
frequently in big cities in the world, which causes great impacts on urban traffic safety and brings
38
about severe economic losses [5,6]. In China, more than 600 cities are exposed to frequent flooding,
39
which has a huge social, economic and environmental impact [7]. Frequent urban rainstorms have
40
severely restricted the stability of China’s urban developments [8]. Therefore, it is important to assess
41
the risk of urban rainstorm disasters, which can help to improve the prediction ability and to reduce
42
the losses caused by urban rainstorm disasters.
43
In order to assess the risk of urban rainstorm disasters, it need build a reasonable and effective
1
assessment system. Over the years, several disaster risk assessment systems of urban rainstorm have
2
been developed. Urban rainstorm is a multivariate phenomenon which is always assessed by many
3
integrated indices, including economic loss data, social impact and emergency performance, etc [9-11].
4
Lyu et al. [12] selected rainy season, average rainfall, average rainy days, elevation and slope, river
5
proximity, river density, land use, metro line proximity, metro line density and road network
6
proximity and density to construct a risk assessment system of metro systems, and took Guangzhou
7
metro system as an example to conduct an empirical study.Alfa [13] proposed a flood risk assessment
8
of Ofu river catchment in Nigeria, including elevation, slope, proximity and soil type. Weerasinghe
9
et al [14] put forward the risk assessment system of rainstorm for the Western Province of Sri Lanka,
10
and use a statistical expression of hazard, exposure and vulnerability to assess the combined flood
11
risk levels. These researches laid a good foundation for the risk assessment index system of urban
12
rainstorm disasters. Therefore, in order to assess the risk of urban rainstorm disasters effectively, this
13
paper establishes the urban rainstorm assessment system with dangerousness indices of
hazard-14
formative factors, sensitivity indices of hazard-inducing environments, and vulnerability indices of
15
hazard-affected bodies .
16
Then in order to assess the risk of urban rainstorm disasters properly, it is necessary to adopt
17
scientific and effective methods. Many studies have focused on hydrological and meteorological
18
models or traditional assessment methods to assess the risk of urban rainstorm disasters. For
19
example, Jonkman et al. [15] proposed a model for the estimation of damage caused by rainstorm in
20
the Netherlands. This integrative character of the presented model is featured by the combination of
21
information on land use and economic data, and data on flood characteristics and stage-damage
22
functions. Wang et al. [16] developed a generalized risk assessment model of pipeline network, in
23
combination with critical data of urban plan, as well as hydrologic data, and used Storm Water
24
Management Model (SWMM) to optimally analyze on the rate of impervious area of upper
25
catchments areas as well as the design standard of lower drainage pipeline. Shao et al. [17] used the
26
methodology of gray fixed weight cluster analysis to assess the disaster losses from 2004 to 2009
27
based on the 1302 historical sample data. Some advanced technologies such as GIS (Geographic
28
Information System) and remote-sensing imagery [18-21] are used for risk assessment of urban
29
rainstorm disasters. While urban rainstorm disasters are difficult to quantify accurately mainly
30
because of the lack of sufficient data[22]. So fuzzy and uncertainty theories can be introduced into the
31
risk assessment of urban rainstorm disasters, such as fuzzy comprehensive evaluation [23],
32
information diffusion [24], variable fuzzy sets (VFS) [25]. However, there are some drawbacks in these
33
methods, for example, the fuzzy comprehensive evaluation cannot well resolve the duplication
34
information caused by related evaluation indices; the establishment of the relative membership
35
function of the variable fuzzy sets depends on physical analysis and experts’ judgments [26]. Hence,
36
taking these factors into consideration, it can combine the advantages of different methods to
37
construct a new approach.
38
Urban rainstorm disasters lack enough data to assess, while the information diffusion method
39
(IDM) can compensate for the incomplete information of small samples. And the risk of urban
40
rainstorm disasters is ambiguous and uncertain, it have many different indices to calculate. So it can
41
use the variable fuzzy sets (VFS) to eliminate the border effect on assessment results effectively and
42
make full use of various indices data to obtain comprehensive risk evaluation results. In this paper,
43
IDM was combined with VFS as an integrated model to assess the risk of urban rainstorm
44
disasters.The IDM is employed to calculate the level classification standards of assessment indices,
45
and then the VFS is adopted to assess the comprehensive risk of urban rainstorm. Through integrated
46
assessment system and IDM-VFS model, Jiangsu province in China can be taken as a case study area.
47
The paper is organized as follows. Section 2 describes the overview of study area, then the data and
48
methods are followed in Section 3. Section 4 depicts the main results and analysis. The discussion
49
and conclusions of the study are presented in Section 5.
50
2. Overview of Study Area
1
This paper takes Jiangsu province as the study area. Jiangsu province (Figure 1), which is located
2
between 116°18′E-121°57E and 30°45′N-35°20′N, the total land area is 1.072×10⁵ km2, accounting for
3
1.1% of the total area of China. The geomorphology of Jiangsu is mainly plains, covering 68% of the
4
total area. The elevation of most area is lower than 50m [27]. There are 13 prefecture-level cities in
5
Jiangsu province, including Nanjing (provincial capital city), Wuxi, Xuzhou, Changzhou, Suzhou,
6
Nantong, Lianyungang, Huai’an, Yancheng, Yangzhou, Zhenjiang, Taizhou and Suqian.
7
Jiangsu province has become one of the most urbanized regions, all the 13 cities in Jiangsu
8
province are prosperous cities in China. In recent years, urban rainstorm disasters have occurred
9
frequently and caused huge lossesin each city of Jiangsu province. Thus, urban rainstorm has become
10
one of the most important factors that restrict the development of Jiangsu province.
11
Jiangsu province belongs to the subtropical monsoon climate, it is usually hot and rainy in
12
summer, and most of the large-scale precipitation in Jiangsu province is in summer. Thus, in order
13
to better show the actual situations of the urban rainstorm disasters of Jiangsu province, this paper
14
emphasizes on the period which is from June to August.
15
16
Figure 1. Geographic location of Jiangsu Province, China.
17
3. Data and Methods
18
3.1. Data Sources
19
This paper uses Jiangsu Statistical Yearbook data and China City Statistical Yearbook data from
20
the National Bureau of Statistics of China to collect the statistical information of all cities in Jiangsu
21
province including economic, social, demographic,, urban construction, environmental and other
22
related city statistics. The meteorological data and the rainfall statistics are collected from the
23
meteorological stations of cities in Jiangsu province. Some other historical precipitation statistics are
24
provided from the Jiangsu climate center.
25
3.2. Weight of Index System
26
The risk assessment index system of urban rainstorm disaster includes a lot of indices. The index
27
weight reflects the relative importance of each index in the risk assessment index system. In this
28
the weights of indices. The AHP is a subjective method to determine the weight of indices based on
1
experts’ experience [28]. The entropy weight method is an objective method that determines the
2
importance of index based on the data information [29]. This combined method can reduce the
3
interference of the individual's subjective judgments on the weights of indices. Therefore, it can make
4
the weights more realistic and reliable relatively [30]. The idea of calculating weights is to calculate the
5
subjective weights of indices by AHP, and then to establish the entropy model of expert's own
6
weights by using the subjective weights of indices as attribute matrices through the idea of
7
information entropy. The weights of the indices are corrected by the weights of the experts, and the
8
final combination weights are obtained.
9
Suppose the weights calculated by AHP are the subjective weights of indices. The subjective
10
weights of indices can be represented as follows:
11
(
)
Tzr z
z
z
w
w
w
W
=
1,
2,
,
(1)where the
W
z is the subjective weight vector , then the0
<
w
zs<
1
and1
1
=
=
r
s zs
w
(12
;
,
,
2
,
1
r
s
=
z
=
1
,
2
,
,
v
).13
Then the expert's own weights are calculated by entropy weight method, it can be shown as
14
follows:
15
(
)
Tv
S
S
S
S
=
1,
2,
,
(2)where the
S
is expert's own weight vector and, and0
<
S
z<
1
(z
=
1
,
2
,
,
v
)and1
1
=
=
v
z z
S
.16
Finally, the weight fusion vector of subjective weights and expert's own weights can be
17
expressed as
W
=
(
w
1,
w
2,
,
w
r)
T, and it can be calculated as follows:18
(
)
=
×
=
vz
z zs
s
w
S
w
1
(3)
where
0
<
w
s<
1
,1
1
=
=
r
s s
w
ands
=
1
,
2
,
,
r
;
z
=
1
,
2
,
,
v
.19
3.3. Information Diffusion Method (IDM)
20
This paper uses normal information diffusion method, IDM is a kind of fuzzy mathematical
21
processing method which can be used to optimize the fuzzy information of samples by means of
22
appropriate diffusion model [31]. Whenthe sample is incomplete, the method can make the diffusion
23
estimation closer to the real relationship than the non-diffusion estimation. This method can establish
24
the level classification standards of the urban rainstorm disasters assessment indices to improve the
25
evaluation accuracy [32]. Based on the historical data of Jiangsu province,the different risk levels of
26
indices were determined according to classification standards.
27
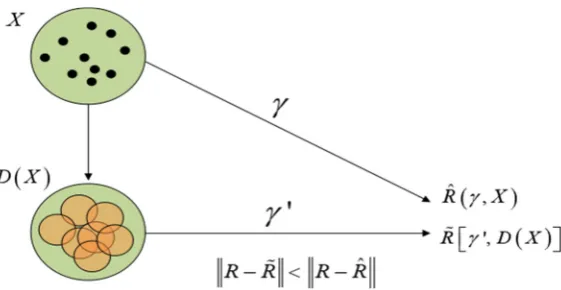
The principle of information diffusion method can be expressed as follows: suppose
X
(28
{
1 2 n}
=
, , ,
X
x x
x
) is a given sample, it can be used to estimate a relationship on a domainU
.29
When the
X
is incomplete, there exists an appropriate diffusion functionf
( )
x
i,
u
and the30
corresponding operator
γ
'
, which can transformX
into a fuzzy sampleD X
( )
, so that the31
information with a value of 1 from the sample
X
can be diffused around the sample following the32
function
f
( )
x
i,
u
, and the diffusion estimateR
is closer to the real relationship than thenon-33
1
Figure 2. The principle of information diffusion method.
2
The calculation steps of the information diffusion are shown as follows:
3
Firstly, the risk levels of urban rainstorm disasters are divided into five levels, that is lowest risk,
4
lower risk, moderate risk, higher risk and highest risk. The information carried by
x
i(i
=
1, 2, ,
n
5
) which can be chosen from the sample
X
can be diffused intou
j (j
=
1, 2, ,
m
) from the6
domain
U
according to Equation (4).7
( )
(
)
−
−
=
22
exp
2
1
h
u
x
h
u
f
i jj i
π
(4)where
h
is the diffusion coefficient which can be calculated by different sizes and values of the8
samples.
9
Secondly, in order to make each set of sample values identical, the diffusion function
f
i( )
u
j is10
normalized to be the diffusion function
g
i( )
u
j :11
( )
( )
( )
=
=
mj i j
j i j i
u
f
u
f
u
g
1
(5)
So the probability of samples located in
u
j can be represented as follows:12
( )
( )
( )
= = =
=
mj n
i j i n
i i j
j
u
g
u
g
u
F
1 1 1
(6)
Finally, the exceeding probability
F
*( )
u
j can be obtained through Equation (7):13
( )
( )
=
=
mj k
k
j
F
u
u
F
*(7)
According to the classification standards of exceeding probability, the critical value of each
14
evaluation index corresponding to the risk level of urban rainstorm is obtained, so the level
15
classification standards of urban rainstorm risk assessment indices can be obtained.
16
3.4. Variable Fuzzy Set (VFS)
17
Variable fuzzy set theory is mainly used in the dynamic analysis of fuzzy phenomena in the
18
system [36]. As its core, relative membership function, relative difference function and variable fuzzy
19
languages. By changing model and model parameters, the credibility and reliability of evaluation,
1
identification and decision-making can be increased, which provides new ideas for risk assessments
2
in many fields [37, 38].
3
Fuzzy variable evaluation method calculates the evaluation level of urban rainstorm disasters
4
scientifically by changing the model and its parameter combination, and it can improve the reliability
5
of risk assessment results. The fuzzy variable evaluation method mainly includes the following steps:
6
(1) Generating index eigenvalue matrix
7
Suppose there is a sample set
Y
=
{
y
1,
y
2,
,
y
n}
consisting of n samples of natural disasters.8
The index eigenvalue of the sample i can be expressed as
y
i=
(
y
1i,
y
2i,
,
y
ri)
T, where r is the
9
number of sample indices. Then the sample set can be express as
Y
=
( )
y
si r×n , where10
n
i
r
s
=
1
,
2
,
,
;
=
1
,
2
,
,
.11
(2) Establishing index standard eigenvalue matrix
12
Suppose there are m levels of assessment classification standards. And sample set is identified
13
according to different standards of eigenvalues of r sample indices, and then the standard eigenvalue
14
matrix of the first order index is obtained.
15
(3) Calculating the relative membership matrix of index level
16
The interval matrix and the bound matrix of variable set of indices can be determined by
17
referring to the standard value matrix of indices and the actual situation of the area. Then according
18
to the different eigenvalues of samples
y
si, the different degreeL
A( )
y
si , so relative membership19
degree matrix can be calculated as follows:
20
( )
1
2
A( )
si siA
y
L
y
=
+
μ
(8)(4) Determining the weight of each index and the relative membership degree
21
According to the Equation (8), the non-normalized relative membership degree can be calculated
22
as follows:23
( )
(
)
[
]
( )
[
]
1 1 1 *1
1
− = =
−
+
=
P r s P si A s rs s A si
hi
y
w
y
w
T
αμ
μ
(9)where
w
s(
s
=
1
,
2
,
,
r
)
is the index weight that can be calculated by Equation (3). And r is the24
identify number of indices, h is the risk level number where
h
=
1
,
2
,
,
m
,α
is the optimal rule25
parameter(
α
=
1
,
2
),P
is the distance parameter,P
=
1
is Hamming distance andP
=
2
is26
Euclidean distance. Then the normalized relative membership degree can be calculated as follows:
27
==
m h hi hi i hT
T
T
1 * * (10)Finally, according to the principle of the largest degree of membership, we can obtain the risk
28
levels of urban rainstorm disasters.
29
4. Results and Analysis
1
4.1. Risk Index System of Urban Rainstorm
2
The reasonable assessment indices of urban rainstorm disasters should be able to accurately
3
describe the risk of urban rainstorm disasters. Therefore, In this paper, an integrated risk assessment
4
index system of urban rainstorm disasters was established (see Table 1). The index system is divided
5
into three subsystems including dangerousness, sensitivity and vulnerability.
6
The dangerousness indices reflect the abnormal conditions and factors of external natural
7
environment. The risk of urban rainstorm disasters can be attributed to short-term rainfall far
8
exceeding normal situations or long-term rainfall in cities, which will lead to the arranged discharge
9
of rainwater beyond the capacity of urban drainage network. Generally, the larger the dangerousness
10
is, the higher the risk of urban rainstorm disasters is. This paper chooses continuous rainfall days (I11:
11
days), heavy rain days (I12: days), maximum rainfall in 24h (I13: mm), monthly total rainfall (I14: mm)
12
and precipitation anomaly percentage (I15: %) as the evaluation indices of dangerousness.
13
The sensitivity indices represent that a particular region is potential to the destruction and
14
influence of disasters due to various natural and social factors [39]. Jiangsu province is located in the
15
plain area with low altitude, and it is easy to cause floods once it encounters rainstorms. And rapid
16
urbanization leads to the change of urban surface attributes. The urban surface is mostly impervious
17
and hardened surface, which leads to the rapid convergence of surface rainwater under extreme
18
rainstorms. The construction of drainage pipeline network in cities also has not kept pace with the
19
development of the city. So the urban average elevation (I21: m), urban green coverage rate (I22: %),
20
urban drainage network density (I23: km/km2), urban water area percentage (I24: %) and impermeable
21
construction land (I25: km2) were selected as the sensitivity indices.
22
The vulnerability indices describe the potential losses of the area exposed to the risk[40]. It refers
23
to the possible impact of urban rainstorm disasters in the urban, that is, the level of loss caused by
24
urban rainstorm. It is generally believed that densely populated, industrially developed cities suffer
25
greater risks and losses in face of the urban rainstorm disasters. The vulnerability indices include the
26
density of affected population (I31: people/km2), GDP of unit area (I32:100 million yuan/km2), disaster
27
relief investment level (I33:%) and public emergency response capability (I34).
28
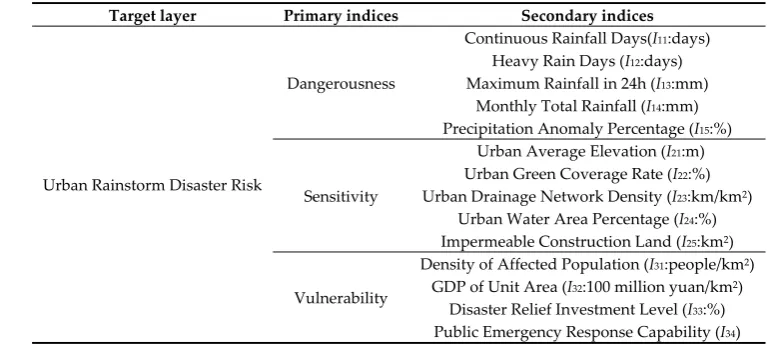
Table 1. Risk assessment index system of urban rainstorm disaster.
29
Target layer Primary indices Secondary indices
Urban Rainstorm Disaster Risk
Dangerousness
Continuous Rainfall Days(I11:days)
Heavy Rain Days (I12:days)
Maximum Rainfall in 24h (I13:mm)
Monthly Total Rainfall (I14:mm)
Precipitation Anomaly Percentage (I15:%)
Sensitivity
Urban Average Elevation (I21:m)
Urban Green Coverage Rate (I22:%)
Urban Drainage Network Density (I23:km/km2)
Urban Water Area Percentage (I24:%)
Impermeable Construction Land (I25:km2)
Vulnerability
Density of Affected Population (I31:people/km2)
GDP of Unit Area (I32:100 million yuan/km2)
Disaster Relief Investment Level (I33:%)
Public Emergency Response Capability (I34)
4.2. Risk Evaluation Based on IDM-VFS Model
30
Based on the risk assessment index system and IDM-VFS model, firstly the AHP was combined
31
with entropy method to determine the weights of the risk indices of urban rainstorm disasters; then
32
the IDM was adopted to determine the classification standards of the risk indices; and the disaster
33
risk values in dangerousness, sensitivity and vulnerability can be calculated by the VFS model
34
respectively. Finally, the comprehensive disaster risk levels were obtained and the risk zoning map
35
4.2.1. Determine the Weights of Risk Indices
1
Indices weights are determined by combined AHP and entropy weight method. The weights of
2
risk assessment indices are shown in Table 2.
3
Table 2. The index weights of urban rainstorm disasters.
4
Primary indices Secondary indices Weight
ω
iDangerousness
Continuous Rainfall Days(days) 0.0630 Heavy Rain Days (days) 0.0735 Maximum Rainfall in 24h (mm) 0.0945 Monthly Total Rainfall (mm) 0.0665 Precipitation Anomaly Percentage (%) 0.0425
Sensitivity
Urban Average Elevation (m) 0.0772 Urban Green Coverage Rate (%) 0.0577 Urban Drainage Network Density (km/km2) 0.0927
Urban Water Area Percentage (%) 0.0735 Impermeable Construction Land (km2) 0.1279
Vulnerability
Density of Affected Population (people/km2) 0.0424
GDP of Unit Area (100 million yuan/km2) 0.0916
Disaster Relief Investment Level (%) 0.0452 Public Emergency Response Capability 0.0408
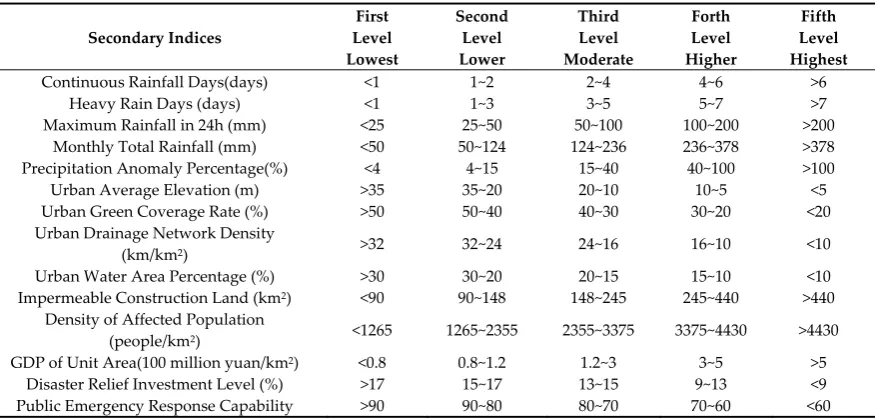
4.2.2. Calculate the Level Classification Standards of Indices
5
The level classification standards of each risk assessment index of urban rainstorm disasters are
6
determined by IDM. Firstly, the index values can be taken as samples of information diffusion, then
7
the exceeding probability of each index also can be calculated. Finally, the level classification
8
standards of each risk assessment secondary indices are obtained (see Table 3).
9
Table 3. Level classification standards of risk assessments secondary indices.
10
Secondary Indices
First Level Lowest
Second Level Lower
Third Level Moderate
Forth Level Higher
Fifth Level Highest
Continuous Rainfall Days(days) <1 1~2 2~4 4~6 >6 Heavy Rain Days (days) <1 1~3 3~5 5~7 >7 Maximum Rainfall in 24h (mm) <25 25~50 50~100 100~200 >200
Monthly Total Rainfall (mm) <50 50~124 124~236 236~378 >378 Precipitation Anomaly Percentage(%) <4 4~15 15~40 40~100 >100 Urban Average Elevation (m) >35 35~20 20~10 10~5 <5 Urban Green Coverage Rate (%) >50 50~40 40~30 30~20 <20 Urban Drainage Network Density
(km/km2) >32 32~24 24~16 16~10 <10
Urban Water Area Percentage (%) >30 30~20 20~15 15~10 <10
Impermeable Construction Land (km2) <90 90~148 148~245 245~440 >440
Density of Affected Population
(people/km2) <1265 1265~2355 2355~3375 3375~4430 >4430
GDP of Unit Area(100 million yuan/km2) <0.8 0.8~1.2 1.2~3 3~5 >5
Disaster Relief Investment Level (%) >17 15~17 13~15 9~13 <9 Public Emergency Response Capability >90 90~80 80~70 70~60 <60
4.2.3. Calculate the Disaster Risks of Three Subsystems
11
According to Table 3, the interval matrix, bound matrix are established, and then, based on
12
Equations (8)-(10), the relative membership degree matrix and integrated membership degree are
13
obtained, and finally the risk values can be calculated in terms of dangerousness, sensitivity and
14
vulnerability respectively. For demonstration purposes, Nanjing has been chosen as an example to
15
discuss the risk assessment of urban rainstorm disasters in detail. The risk values of urban rainstorm
16
disasters in Nanjing in 2016 are shown in Table 4.
17
Table 4. Risk values from June to August in 2016 in Nanjing.
1
Month Dangerousness Sensitivity Vulnerability
June 4.11 3.82 2.87 July 4.21 3.82 2.85
August 2.46 3.82 2.88
Average 3.59 3.82 2.87
2
As we can see from the Table 4, dangerousness indices have different risk values due to different
3
monthly rainfall and rainfall days. While sensitivity and vulnerability indices remain basically
4
unchanged in one year. Adopting the same methods and procedures, we can obtain risk values of the
5
urban rainstorm in Nanjing from 2010 to 2016 in terms of dangerousness, sensitivity and vulnerability
6
respectively (see Table 5).
7
Table 5. Risk values of urban rainstorm from 2010 to 2016 in Nanjing.
8
Year Dangerousness Sensitivity Vulnerability
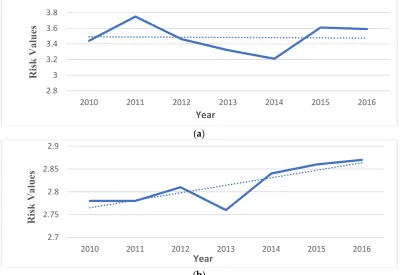
2010 3.44 3.64 2.78 2011 3.75 3.66 2.78 2012 3.46 3.68 2.81 2013 3.32 3.68 2.76 2014 3.21 3.73 2.84 2015 3.61 3.79 2.86 2016 3.59 3.82 2.87 Average 3.48 3.72 2.82
9
From the Table 5, the average risk value of dangerousness is 3.48, the average risk value of
10
sensitivity is 3.72, and the average risk value of vulnerability is 2.82. The dangerousness of 2011 is
11
higher than other years because the precipitation was higher than the normal level (Figure 3(a)), it
12
had sustained rainfall and strong rainfall intensity in short duration. While the sensitivity and
13
vulnerability had an upward tendency because of the acceleration of urbanization (Figure 3(b),(c)).
14
The impervious construction area of the cities is gradually increasing, but the drainage facilities and
15
greening constructions are not matched, and the density of affected population and GDP were also
16
increasing from 2010 to 2016.
17
(a)
(b)
2.8 3 3.2 3.4 3.6 3.8
2010 2011 2012 2013 2014 2015 2016
Risk Va
lues
Year
2.7 2.75 2.8 2.85 2.9
2010 2011 2012 2013 2014 2015 2016
Risk Va
lues
(c)
Figure 3. Variation tendency of risk values in terms of three subsystems from 2010 to 2016.
1
(a) dangerousness; (b) sensitivity; (c) vulnerability.
2
By calculating the average risk values in different cities in terms of dangerousness, sensitivity
3
and vulnerability, and weighting the three subsystems with weights, the risk level of urban rainstorm
4
disasters can be shown in Table 6.
5
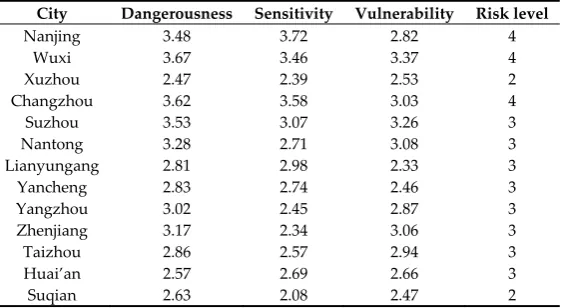
Table 6. Comprehensive risk level in Jiangsu province.
6
City Dangerousness Sensitivity Vulnerability Risk level
Nanjing 3.48 3.72 2.82 4
Wuxi 3.67 3.46 3.37 4
Xuzhou 2.47 2.39 2.53 2
Changzhou 3.62 3.58 3.03 4
Suzhou 3.53 3.07 3.26 3 Nantong 3.28 2.71 3.08 3
Lianyungang 2.81 2.98 2.33 3
Yancheng 2.83 2.74 2.46 3
Yangzhou 3.02 2.45 2.87 3
Zhenjiang 3.17 2.34 3.06 3
Taizhou 2.86 2.57 2.94 3
Huai’an 2.57 2.69 2.66 3
Suqian 2.63 2.08 2.47 2
The dangerousness of Wuxi, Changzhou, Nanjing and Suzhou are higher, while Xuzhou,
7
Huai’an and Suqian are lower from 2010 to 2016. The major influence factors of dangerousness are
8
sustained rainfall and strong rainfall intensity in short duration. And the precipitation decreased
9
from south to north gradually.
10
The sensitivity of Wuxi, Changzhou and Nanjing are higher, while Xuzhou and Suqian are
11
lower. The sensitivity of urban rainstorm disasters mainly depends on the natural and social
12
environment of the cities and the disaster resistance level. The conditions of the different cities in
13
Jiangsu province are uneven. Because different cities have different natural and social environments,
14
Zhenjiang, Xuzhou and Suqian have higher altitudes and less impervious construction area which
15
makes them have lower sensitivity. Wuxi, Changzhou and Nanjing are more advanced so they have
16
more impervious construction area which decreased the ability of disaster resistance, resulting in
17
higher sensitivity.
18
Lianyungang, Yancheng and Suqian are located in the lowest vulnerability area, while Wuxi and
19
Suzhou are the highest cities. The vulnerability of urban rainstorm is the reflection of the vulnerable
20
degree of social economy and human society capability to disasters. Lianyungang, Yancheng and
21
Suqian have lower GDP of unit area and affected population density so they belong to the lower
22
disaster vulnerability cities. The GDP of unit area in Wuxi and Suzhou is more than 500 million yuan/
23
2
km
and the population density is higher, leading to the highest urban rainstorm vulnerability.24
The comparisons of different cities in terms of dangerousness, sensitivity, and vulnerability
25
respectively in Jiangsu province were shown in Figure 4.
26
3.5 3.55 3.6 3.65 3.7 3.75 3.8 3.85
2010 2011 2012 2013 2014 2015 2016
Risk Va
lues
1
Figure 4. Comparisons of different cities in terms of dangerousness, sensitivity, and
2
vulnerability respectively in Jiangsu province.
3
Based on the assessment results, the comprehensive risk zoning map in Jiangsu province can be
4
drawn (Figure 5). From the Figure 5, it can be seen that the comprehensive risks of urban rainstorm
5
in Jiangsu province have apparent regional characteristics. The comprehensive risk level of urban
6
rainstorm in Wuxi, Changzhou and Nanjing is higher, while Xuzhou and Suqian is lower. The risk
7
levels in the northwestern cities are lower than the southern cities in the Jiangsu province. Moreover,
8
most cities of Jiangsu province experience moderate risk level.
9
10
Figure 5. Distribution of
urban rainstorm
risk in Jiangsu province.11
5. Discussion and Conclusions
12
0 0.5 1 1.5 2 2.5 3 3.5 4
Risk Values
City
Because the urban rainstorm disasters are occurring more frequently in China, so the risk
1
assessment of urban rainstorm disasters is very important for urban rainstorm management.
2
However, urban rainstorm is a fuzzy phenomenon and there is a lack of sufficient data. It is difficult
3
to depict it accurately through traditional statistics, especially in small sample problems. Therefore,
4
the method built in this paper can be developed to assess the risk of urban rainstorm disasters. The
5
VFS can make full use of various index data to obtain comprehensive risk evaluation results. The
6
IDM can transform a sample observed value into a fuzzy set and is capable of dealing with small
7
sample problems. Meanwhile, IDM can extract useful information and establish the level
8
classification standards of the risk assessment indices, which is helpful to determine the relative
9
membership function of VFS.
10
According to the natural disaster system theory and actual situation of Jiangsu province, an
11
integrated risk assessment system of urban rainstorm disasters with dangerousness indices, the
12
sensitivity indices and the vulnerability indices are established. Considering the integrated impact of
13
dangerousness, sensitivity and vulnerability indices, to establish an integrated risk index system of
14
urban rainstorm disasters in Jiangsu province is helpful to support risk management and develop
15
effective mitigation strategies in this region. In addition, most cities of Jiangsu province are located
16
in a moderate risk region. The results are consistent with the actual situation of the Jiangsu province
17
and can provide reference and decision-making for management departments of rainstorm disasters.
18
However, the assessment of urban rainstorm disasters is quietly complex. It needs to be studied
19
further in formation mechanism, risk factors and losses of disasters.
20
21
22
Author Contributions: J.C. had the original idea for the study; M.C. and P.Z. were responsible for data collection,
23
M.C. and J.C. analyzed the data and wrote the paper. P.Z. provided guidance, comments and key suggestions;
24
J.C. and M.C. reviewed the paper.
25
Funding: This research was funded by the National Natural Science Foundation of China (Grant No. 41877526
26
and 71601070), the Humanities and Social Sciences Fund of Ministry of Education of China (Grant No.
27
18YJA630009), the Key Support Projects of Major Research Programs of the National Natural Science Foundation
28
of China (Grant No. 91846203), the National Key R&D Program of China (Grant No. 2017YFC0404600), the
29
Fundamental Research Funds for the Central Universities (Grant No. 2018B33614).
30
Conflicts of Interest: The authors declare no conflict of interest.
31
References
32
1. Liao, X.; Zheng, J.; Huang, C.; Huang, G. Approach for evaluating LID measure layout scenarios based on
33
random forest: Case of Guangzhou China. Water. 2018, 10, 894.
34
2. Koop, S.H.A.; Van Leeuwen, C.J. The challenges of water, waste and climate change in cities. Environment,
35
Development and Sustainability. 2017, 19, 385-418.
36
3. Jerneck, A.; Olsson, L.; Ness, B.; Anderberg, S.; Baier, M. Clark, E; Hickler, T; Hornborg, A; Kronsell, A;
37
Lövbrand, E. Structuring sustainability science. Sustainability Science. 2009, 6, 69-82.
38
4. Hegger, D.L.T.; Driessen, P.P.J.; Dieperink, C. Wiering, M; Raadgever, G.T; Van, Rijswick; H.F.M.W.
39
Assessing stability and dynamics in flood risk governance. Water Resources Management. 2014, 28,
4127-40
4142.
41
5. Quan, R. Risk assessment of flood disaster in Shanghai based on spatial-temporal characteristics analysis
42
from 251 to 2000. Environmental Earth Sciences. 2014, 72,4627-4638.
43
6. Huang, Z.W.; Zhou, J.Z.; Song, L.X.; Lu, Y.L.; Zhang, Y.C. Flood disaster loss comprehensive evaluation
44
model based on optimization support vector machine. Expert Systems with Applications. 2010, 37, 3810-3814.
45
7. Li, Z.; Dong, M.; Wong, T.; Wang, J.; Kumar, A.; Singh, R.P. Objectives and indexes for implementation of
46
sponge cities—A case study of Changzhou city, China. Water. 2018, 10, 623
47
8. Zhang, D.; Wang, L. Research on urban emergency management in Beijing based on complex System
48
Theory. City. 2016, 4, 49-53.
49
9. Silva, M.M.G.T.D.; Kawasaki, A. Socioeconomic Vulnerability to Disaster Risk: A Case Study of Flood and
50
10. Peng, C.; Zhang, J.; Sun, Y. Research on emergency rescue of urban flood disaster based on wargame
1
simulation. Journal of the Indian Society of Remote Sensing. 2018. 46, 1-11.
2
11. Cai, Y.; Li, L.; Elahi, E.; Qiu, Y. Selection of policies on typhoon and rainstorm disasters in China: A content
3
analysis perspective. Sustainability. 2018, 10, 387.
4
12. Lyu, H.M.; Sun, W.J.; Shen, S.L,; Arulrajah, A. Flood risk assessment in metro systems of mega-cities using
5
a GIS-based modeling approach. Science of The Total Environment. 2018, 626, 1012-1025.
6
13. Alfa, M.I.; Ajibike, M.A.; Daffi, R.E. Application of analytic hierarchy process and geographic information
7
system techniques in flood risk assessment: a case of Ofu river catchment in Nigeria. Journal of Degraded
8
and Mining Lands Management. 2018, 5, 1363-1372.
9
14. Weerasinghe, K.M.; Gehrels, H.; Arambepola, N.M.S.I.; Vajja, H.P.; Herath, J.M.K.; Atapattu, K.B.
10
Qualitative flood risk assessment for the western province of Sri Lanka. Procedia Engineering, 2018, 212,
503-11
510.
12
15. Jonkman, S.N.; Bočkarjova, M.; Kok, M.; et al. Integrated hydrodynamic and economic modelling of flood
13
damage in the Netherlands. Ecological Economics. 2008, 66, 77-90.
14
16. Wang, J.; Zhao, L.; Zhang, H.; Niu, W. Research on optimization of urban drainage pipelines’ carrying
15
capacity based on SWMM model. China Rural Water and Hydropower. 2017, 4, 41-44.
16
17. Shao M, Gong Z, Xu X. Risk assessment of rainstorm and flood disasters in China between 2004 and 2009
17
based on gray fixed weight cluster analysis. Natural Hazards. 2014, 71, 1025-1052.
18
18. Goetz, J. Forest harvesting is associated with increased landslide activity during an extreme rainstorm on
19
Vancouver Island, Canada. Natural Hazards and Earth System Sciences. 2015, 15, 1311-1330.
20
19. Lyu, H.M.; Wang, G.F.; Cheng, W.C.; Shen, S.L. Tornado hazards on June 23 in Jiangsu Province, China:
21
preliminary investigation and analysis. Natural Hazards. 2017, 85, 597-604.
22
20. Strzelecki, M.C.; Long, A.J.; Lloyd, J.M. Post-little ice age development of a high arctic paraglacial beach
23
complex. Permafrost & Periglacial Processes. 2017, 28, 4-17.
24
21. Liu, X.; Li, X.Y.; Dang, S. Spatial pattern of precipitation change in the main sediment-yielding area of the
25
Yellow River basin in recent years. Journal of Hydraulic Engineering, 2016, 47, 463-472.
26
22. Li, J.; Tan, S.; Wei, Z. A new method of change point detection using variable fuzzy sets under
27
environmental change. Water Resources Management. 2014, 28, 5125–5138.
28
23. Sun, Z.Y.; Zhang, J.Q.; Zhang, Q.; Hu, Y.; Yan, D.H. Wang, C.Y. Integrated risk zoning of drought and
29
waterlogging disasters based on fuzzy comprehensive evaluation in Anhui Province, China. Natural
30
Hazards. 2014, 71, 1639-1657.
31
24. Zou, L.J.; Zhong, M.; Yang, X.H.; Liu, X.F. Using information diffusion to analyze the membership degree
32
in risk assessment of flash flood. Journal of Water Resources Research. 2016, 05, 598-604.
33
25. Ren, Y.F.; Liu, G.D.; Zhou, L.; Zhang, C.M. Risk evaluation of Chengdu's flood hazard based on evidence
34
theory and variable fuzzy sets theory. Transactions of the Chinese Society of Agricultural Engineering. 2014, 30,
35
147-156.
36
26. Guo, E.L.; Zhang, J.Q.; Ren, X.H.; Zhang, Q.; Sun, Z.Y. Integrated risk assessment of flood disaster based
37
on improved set pair analysis and the variable fuzzy set theory in central Liaoning Province, China. Natural
38
Hazards. 2014, 74, 47-965.
39
27. Du, X.; Jin, X.; Yang, X.; Yang, X.; Zhou, Y. Spatial pattern of land use change and its driving force in Jiangsu
40
province. International Journal of Environmental Research and Public Health. 2014, 11, 3215–3232.
41
28. Saaty, T.L. Decision-making with the AHP: Why is the principal eigenvector necessary. European Journal of
42
Operational Research. 2003, 145, 85-91.
43
29. Zhao, D.; Zhang, Y.; Ma, J. Fuzzy Risk Assessment of entropy-weight coefficient method applied in
44
network security. Computer Engineering. 2004, 30, :21-23.
45
30. Xu, J.; Feng, P.; Yang, P. Research of development strategy on China’s rural drinking water supply based
46
on SWOT-TOPSIS method combined with AHP-Entropy: a case in Hebei Province. Environmental Earth
47
Sciences. 2016, 75, 58.
48
31. Zhang, L.J.; Li, W.; Zhang, D Y. Meteorological disaster risk assessment method based on information
49
diffusion theory. Scientia Geographica Sinica. 2009, 29, 250-254.
50
32. Wang, J.D.; Huang, C.F. Information diffusion method relevant in fuzzy information processing and its
51
application. Journal of Northwest University. 1992, 22, 383–392.
52
34. Li, Q. Flood Risk Assessment Based on the Information Diffusion Method. Advances in computer science,
1
environment, ecoinformatics and education: Springer Berlin Heidelberg, German, 2011, 111-117.
2
35. Nagata, K.; Shirayama, S. Method of analyzing the influence of network structure on information diffusion.
3
Physical A Statistical Mechanics & Its Applications. 2012, 391, 3783-3791.
4
36. Chen, S.Y. Theory and model of engineering variable fuzzy set-Mathematical basis for fuzzy hydrology
5
and water resources. Journal of Dalian University of Technology. 2005, 45, 308-312.
6
37. Huang, S.; Chang, J.; Leng, G.; Huang, Q. Integrated index for drought assessment based on variable fuzzy
7
set theory: A case study in the Yellow River basin, China. Journal of Hydrology. 2015, 527, 608-618.
8
38. Zhou, H.C.; Dan, Z. Assessment model of drought and flood disasters with variable fuzzy set theory.
9
Transactions of the Chinese Society of Agricultural Engineering. 2009, 25, 56-61.
10
39. Denton, F. Climate change vulnerability, impacts, and adaptation: Why does gender matter?. Gender &
11
Development. 2002, 10,10-20.
12
40. Hufschmidt, G. A comparative analysis of several vulnerability concepts. Natural Hazards, 2011, 58,