1399
Network Selection For Vertical Handoff In
Heterogeneous Wireless Networks Based On
Received Signal Strength And Other Parameters.
Ramandeep Kaur, Karamjit Kaur, Amandeep Kaur Brar
Abstract:A Heterogeneous Wireless Network (HWN) consists of dissimilar wireless networks according to the requirements of the users. The basic requirement is the seamless flow of voice, data and video applications. In different wireless networks handoff is required to user equipment (UE) for its continuous connectivity with transceivers. There are number of parameters that can be considered for handoff process. The most important and common
factor is Received Signal Strength (RSS) and other parameters considered are provided Bandwidth, Delay in communication, Delay Jitter, Packet loss ratio in data transfer and Price of service provided. The RSS is estimated using empirical and statistical models for different networks, whereas utility values for different attributes of network like delay, delay jitter, bandwidth etc. are calculated using utility functions for different applications (voice, video
and data). The different networks under consideration are Global System for Mobile Communications (GSM), Universal Mobile Telecommunication System (UMTS), Wireless Local Area Network (WLAN) and Long Term Evolution (LTE). The simulation results are shown for different observations. Index Terms:Bandwidth, Delay, Handoff, Heterogeneous network, Packet loss ratio, Price, Received signal strength, Utility functions, Vertical handoff.
————————————————————
1
I
NTRODUCTIONTHE earlier study on Vertical Handoff (VHO) basically considered number of parameters for various wireless systems like GSM, LTE systems. According to user the need of wireless technology is to exchange data, voice communication and video communication with mobility feature. A Heterogeneous Wireless Network (HWN) is a network that consists of multiple wireless networks with different capabilities and technologies. So in HWNs multiple wireless networks coexist with their signal coverage overlapping. To provide mobility in case of HWNs Vertical Handoff (VHO) is used. Handoff (HO) is a process for transferring a call from one Base Station (BS) to another without interruption. There are two types of HO; Vertical handoff is used in heterogeneous wireless networks while Horizontal handoff is used in homogeneous wireless networks. So here the parameters are analyzed for VHO process in HWN formed by GSM, UMTS, WLAN and LTE. It is assumed that UE can support all types of wireless networks present in HWN. RSS measurement report is reported by UE through a Broadcast Control Channel (BCCH). Then the RSS is calculated using empirical models. In case of other parameters, the utility values are calculated by using utility functions. In HWN, utility is the degree of satisfaction with the network service provided to the user. For most satisfaction of user, utility value is 1 and for least satisfaction utility value is 0.
While considering bandwidth like beneficial criteria, the satisfaction is high so utility value equals to u(x) and in case of non-beneficial like delay the utility value equals to {1-u(x)} [6]. In literature survey, for voice application in HWN, sample RSS had been considered for realistic performance analysis and proposed a framework for VHO triggering algorithms focusing on WLAN, and also other aspects such as small-scale fading effects, randomness in user‘s motion, factors that causes call drops were properly considered. However the proposed algorithm was based on RSS only and also other wireless networks were not considered [1]. For VHO in HWNs an optimized algorithm was proposed using an objective function considering load balancing, received signal strength, velocity and price, thus reducing unnecessary handoffs and improving service quality level and capacity of the system, Showed the reduction in handoffs with increase in velocity of UE i.e. for high speed UEs handoff is not required, Also two scenarios are considered with different weighting combinations, under first scenario only RSS and velocity were considered for handoff prediction, while under second scenario RSS, load, velocity and bandwidth were considered for handoff prediction [2]. A VHO decision policy was proposed considering the service quality perceived by the user, provided a modification for ranking networks to select the best radio access terminal, and better quality service among different radio access networks, and also, to avoid the processing delay in computations and multiple handoff ping pong effect by pre-selection of access terminal [3]. Derived an algorithm for VHO in k-tier HWN (consists of GSM, UMTS, LTE and WLAN networks) which suited Indian Urban or sub-urban terrains, by estimating the Path Loss (PL) and the RSS for each tier of k- tier HWN using statistical and empirical models [4]. Analyzed the different Multi Attribute Decision Makings (MADMs), performed seamless handoff to best available network using handoff decision algorithm that considered network related attributes, user preferences and system related attributes, and explored the VHO management problem [5]. A selection algorithm was proposed on the basis of service characteristics and preferences of user in HWNs, integrating utility function, entropy and MADM methods with network attributes (utility values and subjective and objective weights of network ________________________________
Ramandeep Kaur is currently pursuing masters degree program in electronics and communication engineering in Punjabi University, Patiala, India, PH-8427584377. E-mail: [email protected]
Co-Author Karamjit kaur is currently an assistant professor in Punjabi University, Patiala, India, E-mail: [email protected]
attributes) for different applications, resulting in selection of most suitable available network by ranking the comprehensive scores [6]. The paper is organized as, the PL and RSS analysis with the simulation results is included in section I [4], and section II includes the detailed calculations of various utility functions and their simulation results [6].
2
S
ECTIONI
RSS
MEASUREMENT USINGE
MPIRICALP
ROPAGATIONM
ODELSRSS is measured using empirical models, firstly calculating path loss of each network present in HWN. The path loss and RSS for each network is calculated using equations (1) –(7) [4].
2.1 GSM network and UMTS network
In case of GSM network and UMTS network, the models used are extensions of the Walfisch Ikegami model (W-I model) and Okumura and Hata models [4]. Both networks are deployed within 0.5 kilometer as micro cells. The frequency bands considered for GSM/UMTS are 900 MHz band, 1800 MHz band and 1900 MHz band [4]. For better path loss prediction, some additional parameters like building heights, street widths are also considered. The Path Loss for GSM/ UMTS in HWN is expressed as
𝑃 = 59.86 + 20 𝑙𝑜𝑔(𝑑) + 20 log(𝑓) − 10 log(𝑤) + 10 log(𝑓) + 20 log(𝑟𝑜𝑜𝑓 − 𝑈𝐸) − 18(1 + (𝑇𝑋 − 𝑟𝑜𝑜𝑓)) + (𝑇𝑋 − 𝑟𝑜𝑜𝑓) + 18 log(𝑑) − *4 + 0.7 ( − 1)+ log(𝑓) − 9log (𝑏) (1) Here 𝑃 represents the PL in dB, d is the distance between user equipment and the transceiver station (Km), f represents frequency (MHz), w is the mean width of the street (meters), hroof is the mean height of the buildings (meters), hUE is the UE height (meters), hTX is the transceiver station height (meters), b is the mean building separation (meters) [4]. The RSS for GSM and UMTS in HWN is expressed as
𝑅𝑆𝑆 = 𝑃 + ∑ 𝐺 − ∑ 𝐴 − 𝑃 (2)
Here RSS is the received signal strength of GSM or UMTS in dBm, P is the power transmitted by the transceiver station
(dBm), G is gain of antenna (dB), and A is the transceiver connectors loss.
2.2 WLAN network
Log Distance PL model represents the PL that a signal undergoes in a building over distance. For WLAN network the Log Normal PL model is used, which is suitable in 2.5 GHz range of frequency. The PL for WLAN network is calculated as
𝑃𝐿 = 𝑃𝐿(𝑑 ) + 10𝑛𝑙𝑜𝑔 ( ) + 𝑋 (3) Where, 𝑃𝐿 is the total PL inside a building in dB, 𝑃𝐿(𝑑 ) is the
PL (dB) with respect to the reference distance 𝑑 , 𝑛 is the PL distance exponent, 𝑑 is the distance between transceiver and user equipment (meters), and 𝑋 is a Gaussian random variable with zero mean and 𝜎 is standard deviation [4]. The RSS for WLAN network in dBm can be calculated as
𝑅𝑆𝑆 = 𝑃 − 𝑃𝐿 (4)
Here the 𝑃 is the power transmitted (dBm).
2.3 LTE Advanced network
The path loss for LTE network is estimated by the Okumara and Hata model [4]. The PL in dB is expressed as 𝑃𝐿 =
69.55 + 26.16log (𝑓) − 13.82 log( ) − 𝐶 + [44.9 −
6.55 log( )] log (𝑑) (5)𝐶 = 0.8 + (1.1 log(𝑓) − 0.7) −
1.56 log(𝑓) (6) 𝐶 is the correction factor for
antenna height in dB. The RSS for LTE in dBm is calculated as 𝑅𝑆𝑆 = 𝑃 + 𝐺 + 𝐺 − 𝑃𝐿 − 𝐴 (7) here 𝐺 is the
receiver gain (dB).
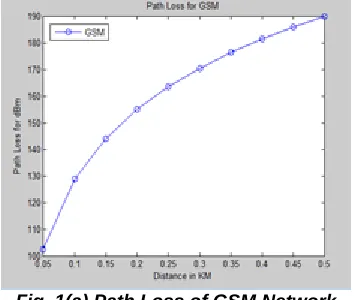
Fig. 1(a) Path Loss of GSM Network
2.4 Results and Discussion
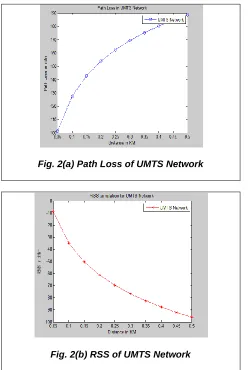
The simulation is performed by considering the network parameters, according to India terrain. The parameters of network and threshold RSS for different networks are shown in Table 1, and the environmental and PL parameters of HWN, for the PL and RSS calculation are shown in Table 2. The results of simulation for each network are shown. Fig. 1 shows the PL and RSS (in dBm) for GSM network. Similarly, the PL and RSS (in dBm) of UMTS network are shown in Fig. 2 and the simulation results in Fig. 3 shows the path loss and RSS of WLAN network, according to the parameters of Table 1 and Table 2. The PL is indicated in dB and RSS is indicated in dBm.LTE network simulation results for PL and RSS are shown in Fig 4. Here PL is in dB and RSS is in dBm.
TABLE 1NETWORK PARAMETERS [4]
1401 Fig. 2(b) RSS of GSM Network
As shown in Fig. 1 to Fig. 4, the path loss in each network increases with increase in the distance between mobile unit and the transceiver. And the received signal strength of each network decreases with increase in distance between mobile unit and transceiver.
Fig. 2(a) Path Loss of UMTS Network
Fig. 2(b) RSS of UMTS Network
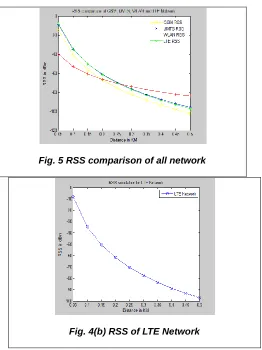
Fig. 5 shows the comparison of RSS of each network present in HWN i.e. GSM network, UMTS network, WLAN network and LTE network. This comparison is helpful for handoff decision making.
Fig. 3(a) Path Loss of WLAN Network
Fig. 3(b) RSS of WLAN Network
Fig. 4(b) RSS of LTE Network
TABLE 3UTILITY FUNCTION AND PARAMETER SETTINGS FOR BANDWIDTH [6]
3
SECTION
II
U
TILITY VALUES CALCULATION USING UTILITY FUNCTIONSThe utility functions are used to calculate the utility values for bandwidth, delay, delay jitter, packet loss ratio and price depending on different applications (voice applications, video applications and data applications). The functions adopted are defined as follows in equations (8)-(12) [6], Sigmoid function:
𝑢(𝑥) = ( )( ) (8) where u(x) is the utility value of parameter x, n controls the
steepness of the function and m is the threshold value.
Exponential function: 𝑢(𝑥) = (9) here c is a constant value. Logarithm
function: 𝑢(𝑥) = 𝑑 + 𝑒𝑙𝑛(𝑥 + 𝑓)
(10) here d, e and f are constant values which varies according to
application. Linear function: 𝑢(𝑥) = 𝑔𝑥 +
(11) Here g is a coefficient of independent variable which gives the
rate of change of the dependent variable, h is a constant
which is value of dependent variable when x is equals to 0.
Linear piecewise function: 𝑢(𝑥) = {
1 , 𝑥 < 𝑖
, 𝑖 ≤ 𝑥 < 𝑗
0 , 𝑜𝑡𝑒𝑟𝑤𝑖𝑠𝑒
(12)here the parameters i and j represents the minimum and maximum service prices, respectively.
3.1 Utility function for Bandwidth
Bandwidth is defined as a range of frequencies within a given band, in particular that is used for transmitting a signal. For voice and video applications sigmoid function is used. In sigmoid function u(x) is the utility value of bandwidth (x). The threshold value ‗a‘ is assumed to be the required bandwidth of voice applications (i.e., 1000 Kbps) and of video applications (i.e., 2500 Kbps). As for the data applications, there is no requirement of strict minimum bandwidth and with the increase in bandwidth utility value increases. Therefore, for data applications exponential function is used for calculating the utility value for bandwidth. The parameter values and simulation results according to these parameter values are shown in Table 3 and Fig. 6, respectively. The result shows that with increase in bandwidth the satisfaction also increases.
Fig. 6 Bandwidth utility function curve
3.2 Utility function for Delay
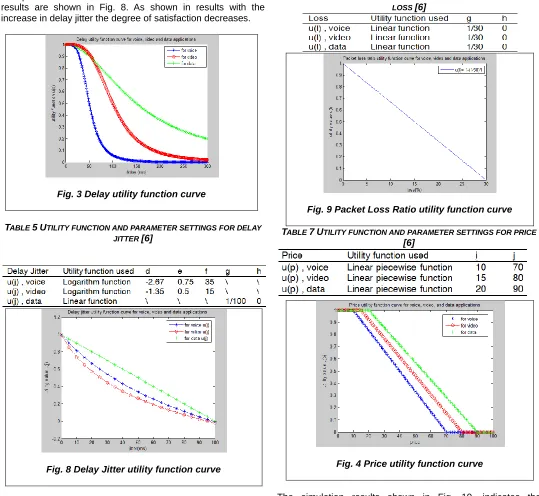
Delay can be defined as the time a signal takes to traverse the medium. The utility function used is sigmoid function. The delay requirement (i.e. threshold value a) for voice application is 50 ms, for video application is 100 ms and 150 ms for data application as it is least sensitive to delay. The parameter values are according to each application are shown in Table 4 and the simulation results are shown in Fig. 7, the result shows that with the increase in delay the degree of satisfaction decreases.
TABLE 4UTILITY FUNCTION AND PARAMETER SETTINGS FOR DELAY
[6]
3.3 Utility function for Delay Jitter
Delay jitter mentions the difference between end-to-end delays of two consecutive data packets [6]. The function used for voice and video applications is logarithmic function as these applications require less delay jitter than data applications, as
1403 for data applications the utility function used is linear function.
The parameter values are shown in Table 5 and simulation results are shown in Fig. 8. As shown in results with the increase in delay jitter the degree of satisfaction decreases.
Fig. 3 Delay utility function curve
TABLE 5UTILITY FUNCTION AND PARAMETER SETTINGS FOR DELAY JITTER [6]
Fig. 8 Delay Jitter utility function curve
3.4 Utility function for Packet Loss Ratio
The packet loss ratio defines the ratio of lost packets to the transmitted packets. Linear function is used for calculating utility value of packet loss ratio for all three types of applications. Assuming the lowest satisfaction level is reached when the packet loss ratio increases to 30%, as shown in Table 6. And the simulation results are shown in Fig. 9.
3.5 Utility function for Price
The utility function used for calculating utility value of price (p) is linear piecewise function for all three applications. Table 7 shows the parameter values indicating minimum service price ‗i‘ and maximum service price ‗j‘ for each application.
TABLE 6UTILITY FUNCTION AND PARAMETER SETTINGS FOR PACKET LOSS [6]
Fig. 9 Packet Loss Ratio utility function curve
TABLE 7UTILITY FUNCTION AND PARAMETER SETTINGS FOR PRICE
[6]
Fig. 4 Price utility function curve
The simulation results shown in Fig. 10, indicates the decrease in degree of satisfaction with the increase in service price.
4 CONCLUSION
functions. The handoff decision is based on this RSS comparison and utility values of all other parameters. In future, these simulations can be considered to develop an algorithm for VHO in HWNs.
R
EFERENCES[1] Tariq Ali, Mohammad Saquib, and Chaitali Sengupta, ―Vertical handover analysis for voice over WLAN/cellular network‖, In Communications (ICC), 2010 IEEE International Conference on, pages 1-5. IEEE, 2010.
[2] Sandra Brigit Johnson, Saranya Nath, and T Velmurugan, ―An optimized algorithm for vertical handoff in heterogeneous wireless networks‖, In Information & Communication Technologies (ICT), 2013 IEEE Conference on, pages 1206-1210. IEEE, 2013.
[3] Sassi Maaloul, Mriem Afif, and Sami Tabbane, ―Vertical handover decision policy based on the end user's perceived quality of service‖, In Advanced Information Networking and Applications Workshops (WAINA), 2013 27th International Conference on, pages 493-498. IEEE, 2013.
[4] Amitav Panda, Sarat Kumar Patra and D.P. Acharya, ―Received Signal Strength Based Vertical Hand Off Scheme for K-Tier Heterogeneous Networks‖, In Communication Systems and Network Technologies (CSNT), 2013 International Conference on, IEEE, 10 June 2013.
[5] Pramod Goyal, D. K. Lobiyal and C. P. Katti, ―Vertical Handoff in Heterogeneous Wireless Networks: A Tutorial‖, In Computing, Communication and Automation (ICCCA), 2017 International Conference on, IEEE, 2017.
[6] Gen Liang and Hewei Yu, ―Network selection