An Extensive Survey On Biclustering Approaches
And Algorithms For Gene Expression Data
N. Kavitha Sri, Dr. R. Porkodi
Abstract- Data mining (DM) is the exploration of useful and needed patterns from a huge database. Nowadays, several researchers showing their keen interest in analysis and experimentation on biological information which results in the generation of huge data. Complex biological data lead the data mining into the clinical context and diverse DM approaches made ease of interpretation as well as computational analysis. Som e general examples of DM based biological data analysis such as gene classification, disease prediction, protein structure prediction, analysis of gene expression and mutation. Biclustering is one of the emerging techniques to analyze gene expression and their key feature is identifying the subset of the gene along with the functional interrelation of gene sets. Biclustering establishes the correlation among the subset of gene-based on the characteristic conditions of genes. Biological and Statistical measures are employed to evaluate the discovering significant bicluster and bicluster quality. The paper describes a brief survey of biclustering algorithms. The biclustering algorithms are divided into five approaches, namely Greedy Iterative Search, Divide and Conquer, Iterative Row and Column Clustering Combination, Exhaustive Bicluster Enumeration and Distribution Parameter Identification. The paper also describes the last decade's novel approaches. This paper also describes the number of papers that are indexed in bibliographic databases.
Index Terms- Gene expression data, Biclustering, Greedy Iterative Search, Divide and Conquer, Iterative Row and Column Clustering Combination, Exhaustive Bicluster Enumeration and Distribution Parameter Identification.
————————————————————
1 INTRODUCTION
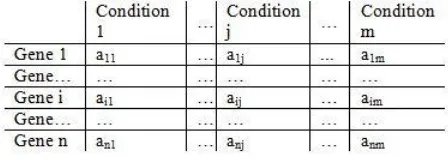
In recent years, the advancement in genomic technology offers various experimental conditions that measure the huge number of gene expression levels by using microarray techniques. The resulted data is arranged in a numerical matrix is named as the expression matrix [1].Every element of the expression matrix expressed in the form of the numerical values of a gene-based on the certain experimental condition. An experiment on microarray extracts useful knowledge from the gene expression data and the detection accuracy is increasing day by day [2]. For this reason, some machine learning techniques are used to extract information from microarray techniques. Figure Fig.1.1 shows the structure of gene expression data.
Fig 1.1 Structure of Gene Expression Data
Clustering techniques are focused on discovering many groups of genes.
————————————————
N. Kavitha Sri, Dr. R. Porkodi.
Research Scholar, Department of Computer Science, Bharathiar University, Coimbatore, Tamil Nadu, India.
Associate Professor, Department of Computer Science, Bharathiar University, Coimbatore, Tamil Nadu, India.
Each group of genes has similar variances in expression level during several experimental conditions. Gene clusters are not properly recognized when the clustering methods use huge gene expression data. The clustering technique considers gene expression profiles at the time with different conditions [3]. In order to overcome the problem, the biclustering techniques are used to find an important biological pattern even in huge gene expression data. Bicluster is known as submatrix; it contains a subset of columns (conditions) or rows (genes) in a matrix. Biclustering has proven to be a non-deterministic polynomial-time (NP)-hard problem. Therefore heuristic methods are used for many biclustering algorithms, and their results may be suboptimal and each biclustering algorithm has their pros and cons. The significant analysis executed on microarray gene-expression data is to find the biclusters, which represent a group of the gene that is coherently expressed for a subset of conditions [4]. Several biclustering algorithms have been proposed to discover various types of biclusters from these real-valued gene-expression data sets. The paper is organized as follows: the second section describes the bicluster representation, types of bicluster and its structure of bicluster. The third section presents the biclustering algorithms used so far. The fourth section presents various algorithms used to handle the gene expression data in tabular form. The fifth section shows the number of papers published and indexed in popular bibliographic databases. This paper is concluded in the sixth section.
2 BICLUSTERING
2229 in which Aij refers to the expression level of gene i under- sample j. Then A can be represented as follows.
(
)
Bicluster means genes and samples which are commonly used in some evaluation measure definitions. Here Aij values referring to the ith row and jth column.
2.1 Types of biclusters
Several types of biclusters have been introduced to group the gene expression data, which are Bicluster constant values, bicluster with constant rows and columns, bicluster with coherent values and coherent evolutions. Here, A represents the bicluster; I and J represent to be a row and column of a bicluster.
Biclusters with constant values
In Sub-matrix (I, J) where Aij values of rows and columns within the biclusters are equal for all i I and j J. This statement can be expressed as
Biclusters with Constant Rows or Columns
In submatrix (I, J) where Aij values of rows or columns have constant values. It can be expressed as in the form Additive or Multiplicative way.
Where µ is the typical value within the biclusters is the adjustment for row i I and is the adjustment for column j J.
Biclusters with coherent values
A subset of rows and a subset of columns, whose values Aijare predicted using,
Where µ is the typical value within the biclusters, is the adjustments for row i€ I and is the adjustment for row j€ J. These adjustments can be attained either in an additive or multiplicative way.
Coherent evolutions
The subset of gene is up-regulated or down-regulated when across a subset of samples without having any expression values. In this situation, the bicluster data doesn't have any mathematical model [5].
2.2 Biclustering Structure
The biclustering can be divided into some structures based on the rows and columns represent from the input matrix are incorporated in biclusters.
Row exhaustive- Every gene must assign to at least one
bicluster.
Column exhaustive- Every condition must assign to at least
one bicluster.
Non-exhaustive-Some of the conditions and genes could
not belong to any bicluster.
Row exclusive- Every gene can assign to be part of at least
one bicluster.
Column exclusive- every condition can assign to be part of
at least one bicluster.
Non-exclusive- It represents the overlapped bicluster.
2.3 Evaluation Functions
The performance of the biclustering algorithm is evaluated using two categories evaluation function namely Intra-bicluster evaluation function, and Inter-bicluster evaluation function.
Intra-Bicluster Evaluation Functions
The intra-bicluster evaluation functions are used to quantify the coherence degree within each bicluster. There are several intra-bicluster evaluation functions.
The Average Similarity Score (AVSS) is defined as follow
where (I’, J') is a bicluster, is a similarity measure among elements of row i and the column j with other elements belonging to I’ and J’ *6+.
The Average Row Variance (ARV) is defined as follow
Where miJ’ is the average over the row i. It follows that the biclusters that contain rows with large changes in their values for different columns are characterized by a large row variance. The ARV guarantees that a bicluster captures rows exhibiting coherent trends under some subset columns [7].
The Mean Squared Residue (MSR) is defined as follow
where mI’J’is the average over the whole bicluster, mI’ jis the average over the column j, miJ’is the average over the row i. The EMSR represents the variation associated with the interaction between the rows and the columns in the bicluster [8].
Inter-Bicluster Evaluation Functions
Let A1 and A2 be two biclusters,
The Prelic index is defined as follow
Where SPrelicis based on the Jaccard index for two sets, A1 and A2 are two groups of biclusters. This index compares two solutions based on the categorization of genes. However, it compares only gene sets [10].
The Liu and Wang index are defined as follow
The Liu and Wang index are used to compares two solutions by considering both genes and conditions [10].
3 BICLUSTERING ALGORITHMS
Biclustering algorithms mainly concentrating on two objectives: to identify one or more number of biclusters. Some approaches to identify one bicluster at a time. For example CC algorithm to find the one bicluster at a time and then repeat the procedure at the end of identifying other biclusters. In some approaches discover one set of biclusters at a time. In many heuristics approaches have been used to solve many complex problems in biclustering approaches. The biclustering algorithms are classified into five categories [8].
Greedy iterative search. Divide and conquer.
Exhaustive bicluster enumeration.
Iterative row and column clustering combination. Distribution parameter identification.
3.1 Greedy Iterative Search (GIS) Approach
The iterative greedy search could construct the submatrices from the expression data matrix by adding a gene or condition to the current submatrix or deleting a gene or samples from the current submatrix which optimizes a function. To repeat the process until no other gene or condition can be inserting or delete to any submatrix. The greedy approaches always give a locally optimal solution. The greedy approach's main advantage is working fast and disadvantage is some approaches may take loose good biclusters and take wrong decisions [10]. Cheng and Church (CC) algorithm was the most first algorithm to
handle the gene expression data. The main goal of the CC is to find biclusters based on the maximal acceptable score of the MSR (Mean Squared Residue) evaluation function. To achieve this goal, several algorithms developed under the CC algorithm [11]. Califano et al., [12]described the problem of identifying an interesting pattern from gene expression data. To overcome the problem, the author introduced the new algorithm. The new algorithm mainly focused on finding groups of genes that show a subset of the condition in the coherent values. But the remaining columns haven't coherence values. Finally, an optimal set of patterns is chosen among the statistically significant ones using a greedy set covering algorithm that adds rows and columns to the existing patterns so that they become maximal patterns. Wassim Ayad et al., [13] introduced the new algorithm named as Pattern Driven Neighbourhood Search algorithm (PDNS) and it is also known as an Iterated local search method. The PDNS method is used to discover the pattern and check the quality of the biclusters. The PDNS algorithm is adjusting some positions of genes and conditions to improve the bicluster's quality. To evaluate the proposed algorithm’s performance by using two microarray datasets, such as Saccharomyces cerevisiae and Yeast cell cycle. The biological significance was evaluated by using ASR (Average Spearman's Rho) measures function. Using the ASR function measures, the PDNS gives a good result when compared to the certain traditional algorithm, namely CC, ISA, OPSM, and BiMAX algorithm. Table 3.1 shows the features and time complexity of various algorithms comes under the GIS approach.
Table 3.1 GIS Algorithms and its Features
3.2 Divide and Conquer (DC) Approach
2231 matrix is converted into only one block (bicluster). And
then the block clustering finds the row (gene) or column (condition) iteratively, that time the largest reduction occurs within the block. After the block reduction, the block will be divided into two blocks by using the splitting method. The splitting method will be continued until the production of the bicluster. In block clustering, bicluster quality evaluates based on the mean value of rows and columns of the bicluster data [21]. Rosemary Braun et al., [22] described the problem of multi-gene interactions complexity. To overcome the complexity the proposed the new method, named as Partition Decoupling Method (PDM). The PDM method is work based on Scrubbing Method steps and ICS (Iterated Spectral Clustering). Using these two methods the results are updated and revealing their structure iteratively. The new method could analysis complex diseases easily. The PDM method performed well when compared to the K Means algorithm. The PDM method is mainly used to analyze the complex diseases and it can distinguish cell types and also streatments with higher accuracy. Table 3.2 shows the time complexity and features of various algorithms comes under the Divide and Conquer approach algorithm.
Table 3.2 DC Algorithms and its Features
3.3 Exhaustive Bicluster Enumeration (EBEB) Approach
The exhaustive bicluster enumeration (EBEB) mainly focused on identifying the best clustering. Every bicluster would be optimized by using a certain evaluation function. The EBEB approach algorithms work based on graph formalism. The EBEB approach's main objective is to identify the maximum weight of the subgraph and it will be corresponding to its statistical significance. The EBEB approach is to finds the bicluster based on their subgraph weight value. The highest weight value is taken from the selection of the heaviest subgraph. The advantage of the EBEB approach is obtaining the best results only. The main disadvantages of EBEB approach algorithms are taking more computing time and high memory space [10]. Fan Shi et al., [28] introduced a new method for microarray data. The new method called as bi-ordering analysis and it is mainly used to detect informative patterns from gene expression microarray data by using the ranking method. The statistical method is used to evaluate the significance of
genes and samples. The statistical method used three evaluation methods, namely saturation metric of samples, Jonckheere's trend test, and Gene Ontology Annotations. The bi-ordering analysis was mainly concentrated on ranking samples and genes in microarray data and also evaluated the statistical methods and biological significance of genes and samples. The new method is capable to generate highly robust and statistically significant gene modules. Rohit Gupta et al [29] developed a new error-tolerant biclustering model, known as 'ET-bicluster'. The 'ET-Bicluster' developed based on the heuristic-based approach. The heuristic-based approach based on the bottom-up algorithm. The authors mainly focused on real-valued data. The novel model directly discovers the sequential error-tolerant biclusters. The ET-bicluster model mainly proposed for finding the results even in the presence of functional module discovery problem and biomarkers discovery problem. The novel method was achieved the best score when compared to the existing RAP approach in the context of two biological problems based on the best enrichment score. Table 3.3 shows the time complexity and features of various algorithms come under the Exhaustive Bicluster Enumeration approach.
Table 3.3 EBEB Algorithm and its Feature
3.4 Iterative Row and Column Clustering
Combination (IRCCC) Approach
function of proposed algorithm achieved a good result when compared to GSEA algorithm. The algorithm can be evaluated by using biological significance in three functions, namely macromolecule metabolism, desiccation response and biopolymer metabolism. Chen et al., [38] proposed a new method known as WF-MSB. The WF-MSB based on a Fuzzy approach. The WF-MSB mainly used for the user-defined gene. The WF-MSB method mainly focuses on extracting a query driven bicluster. The main advantage of the WF-MSB discovering both the similar and dissimilar bicluster and also extract the bicluster gene expression values. The WF-MSB algorithm is mainly used to extract gene expression values. The gene expression values of WF-MSB algorithm have high difference value when compared to all baseline gene expression values. In the WF-MSB algorithm, the biclusters are more significant. Table 3.4 shows the features and time complexity of various algorithms come under the Iterative row and column approach algorithms.
Table 3.4 IRCCC Algorithm and its Features
3.5 Distribution Parameter Identification (DPI) Approach
The distribution parameter identification (DPI) based on the Statistical model. The statistical model was used to discover the distribution parameter. The data would be generated depend on minimizing the data based on some criterion iteratively [10]. Je-Gun Joung et al, described the problem of discovering the bicluster from 2D data. To propose the new algorithm for overcome the discovery of bicluster and it is known as Probabilistic CO-evolutionary Biclustering Algorithm (PCOBA). The PCOBA algorithm will try to discover the particular biological patterns. The patterns were must be the relationship between genes and other biological components at a genome-wide level. The Coevolutionary optimization was used to produces the optimized result (bicluster).To check the quality of bicluster is done by fitness value. The experimental result shows the performance of the proposed algorithm for yeast and synthetic dataset. The experiments result exhibits good result when compared to some evolutionary algorithms, namely Genetic algorithm (GA), Coevolutionary genetic algorithm (CGA), Estimation of the distribution algorithm (EDA) [5]. Hui Zhao et al., introduced a new algorithm named as ProBic. The ProBic algorithm developed based on
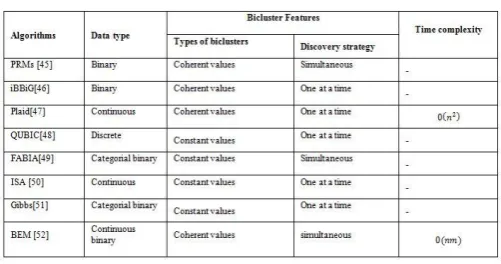
the algorithm of Query-Based Biclustering and its work mainly based on the PRM (Probabilistic Relational Model). The main objective of ProBic is to discover the gene set with related expression profiles. The PRM imposed on three classes in expression profiles namely gene class, array class and expression object class respectively. The ProBic algorithm to detect the gene set and gene set must be in biological similarity and highly quality biclusters even though in the presence of noise. The ProBic algorithm achieved a good result when compared to ISA and QDB existing algorithms. To evaluate the bicluster performance from the perception of expression profile quality, outcome robustness even in the presence of a noisy seed set and the biological relevance [44]. Table 3.5 shows the features and time complexity of various algorithms comes under the Distributed Parameter Identification Approach Algorithms.
Table 3.5 DPI Algorithms and its Features
4 VARIOUS ALGORITHMS IN BICLUSTERING
TECHNIQUE
2233 Table 4.1 Literature Review
S.NO YEAR TITLE DATASET ALGORITHM
1. 2019 Factor Analysis for Bicluster Acquisition
(FABIA) revealed
vincristine-sensitive transcript pattern of canine transmissible
Venereal tumors.
CCTV Factor Analysis for
Biclusters Acquisition (FABIA)
2. 2019 A rectified factor network-based biclustering
method for detecting cancer-related coding genes and miRNAs, and their interactions
Breast cancer A new method using
rank fusion process
3. 2018 Identifying Condition Specific Key Genes from Basal-Like Breast Cancer Gene Expression Data
Basal like breast
cancer (BLBC dataset)
A new approach based on WGCNA
4. 2017 Analysis of breast cancer subtypes by AP-ISA biclustering
Breast cancer AP-ISA Algorithm
5. 2017 Two-way learning with one-way
supervision for gene expression data
Rat dataset, Human dataset
parsimonious Gaussian mixture models
6. 2017 Application of bi-clustering of gene expression data and gene set enrichment analysis methods
to identify potential disease causing
nanomaterials
Lung diseases Bimax algorithm
7. 2016 Context Specific and Differential Gene
Co-expression Networks via Bayesian Biclustering
Breast cancer BicMix
8. 2015 Analysis of miRNA expression profiles in breast
cancer using biclustering
Breast Cancer Iterative Signature
Algorithm (ISA)
9. 2014 BicPAM: Pattern-based biclustering for
biomedical data analysis
Dlblc, Hughes, gasch BicPAM
10. 2010 Differential co-expression framework to quantify
the goodness of biclusters and compare biclustering algorithms
Breast, Liver, Yeast,
Lymphoma,
Path-metabolic
Differential co-expression framework
5 GROWTHS OF LITERATURES INDEXED IN
BIBLIOGRAPHIC DATABASES
This section presents the number of papers published by various journals that are indexed in bibliographic databases such as Science Direct, PMC, and Springer from the 2010-2018 year with respect to biclustering for gene expression data as shown in Fig 5.1. From the PMC, papers have been highly indexed as compared to other bibliographic databases over the last ten years.
Fig 5.1 Number of paper indexed in Bibliographic DB
6 CONCLUSION
REFERENCES
[1] Harpaz, R., & Haralick, R. (2006, August). Exploiting the geometry of gene expression patterns for unsupervised learning. In 18th International Conference on Pattern Recognition (ICPR'06) (Vol. 2, pp. 670-674). IEEE.
[2] Piatetsky-Shapiro, G., Khabaza, T., & Ramaswamy, S. (2003, August). Capturing best practice for microarray gene expression data analysis. In Proceedings of the ninth ACM SIGKDD international conference on Knowledge discovery and data mining (pp. 407-415). ACM.
[3] Ben-Dor, A., Chor, B., Karp, R., & Yakhini, Z. (2003). Discovering local structure in gene expression data: the order-preserving submatrix problem. Journal of computational biology, 10(3-4), 373-384.
[4] Joung, J. G., Kim, S. J., Shin, S. Y., & Zhang, B. T. (2012, December). A probabilistic coevolutionary biclustering algorithm for discovering coherent patterns in gene expression dataset. In BMC bioinformatics (Vol. 13, No. 17, p. S12). BioMed Central.
[5] Pontes, B., Giráldez, R., & Aguilar-Ruiz, J. S. (2015). Biclustering on expression data: A review. Journal of biomedical informatics, 57, 163-180.
[6] Liu, X., & Wang, L. (2006). Computing the maximum similarity bi-clusters of gene expression data. Bioinformatics, 23(1), 50-56.
[7] Aguilar-Ruiz, J. S. (2005). Shifting and scaling patterns from gene expression data. Bioinformatics, 21(20), 3840-3845.
[8] Cho, H., & Dhillon, I. S. (2008). Coclustering of human cancer microarrays using minimum sum-squared residue coclustering. IEEE/ACM Transactions on Computational Biology and Bioinformatics (TCBB), 5(3), 385-400.
[9] Saber, H. B., & ELLOUMI, M. (2015). DNA microarray data analysis: A new survey on biclustering. International Journal for Computational Biology (IJCB), 4(1), 21-37.
[10]Cheng, Y., & Church, G. M. (2000, August). Biclustering of expression data. In Ismb (Vol. 8, No. 2000, pp. 93-103).
[11]Califano, A., Stolovitzky, G., & Tu, Y. (2000, August). Analysis of gene expression microarrays for phenotype classification. In Ismb (Vol. 8, pp. 75-85).
[12]Dr. R.Porkodi., & R.Tamilarasi., (2015, December) .Study and Analysis of Gene Expression Profile Patterns of Myocardial Infraction Dataset Using Biclustering Approach. In International Journal of
Engineering Technology and Computer Research (IJETCR) (Vol. 3, pp. 50-63)
[13]Ayadi, W., Elloumi, M., & Hao, J. K. (2012, December). Pattern-driven neighborhood search for biclustering of microarray data. In BMC bioinformatics (Vol. 13, No. 7, p. S11). BioMed Central.
[14]Santamaria R., Khamiakova-T., Sill M. Theron R. Quintales L. Kaiser., S. & F. Leisch. Biclust. (2011). Bicluster algorithms. R package.
[15]Cho, H., & Dhillon, I. S. (2008). Coclustering of human cancer microarrays using minimum sum-squared residue coclustering. IEEE/ACM Transactions on Computational Biology and Bioinformatics (TCBB), 5(3), 385-400.
[16]Liu, X., & Wang, L. (2006). Computing the maximum similarity bi-clusters of gene expression data. Bioinformatics, 23(1), 50-56.
[17]Uitert, M. V., Meuleman, W., & Wessels, L. (2008). Biclustering sparse binary genomic data. Journal of Computational Biology, 15(10), 1329-1345.
[18]Ben-Dor, A., Chor, B., Karp, R., & Yakhini, Z. (2003). Discovering local structure in gene expression data: the order-preserving submatrix problem. Journal of computational biology, 10(3-4), 373-384.
[19]Yuval Kluger., Ronen Basri., Joseph T. Chang., & Mark Gerstein. (2003). Spectral biclustering of microarray cancer data: Co-clustering genes and conditions. Genome Research, 13, 703–716.
[20]Sharara, H. S., & Ismail, M. A. (2008). BISOFT: A Semi-Fuzzy Approach For BiClustering Gene Expression Data. In BIOCOMP (pp. 151-157). [21]Hartigan, J. A. (1972). Direct clustering of a data
matrix. Journal of the american statistical association, 67(337), 123-129.
[22]Braun, R., Leibon, G., Pauls, S., & Rockmore, D. (2011). Partition decoupling for multi-gene analysis of gene expression profiling data. BMC bioinformatics, 12(1), 497.
[23]Llatas, I., Quiroz, A. J., & Renom, J. M. (1997). A fast permutation-based algorithm for block clustering. Test, 6(2), 397-418.
[24]G. Govaert., & M. Nadif. (2013). Co-Clustering. FOCUS Series. Wiley.
[25]Getz, G., Levine, E., & Domany, E. (2000). Coupled two-way clustering analysis of gene microarray data. Proceedings of the National Academy of Sciences, 97(22), 12079-12084.
2235 [27]Nguyen, T., Khosravi, A., Creighton, D., &
Nahavandi, S. (2014). Spike sorting using locality preserving projection with gap statistics and landmark-based spectral clustering. Journal of neuroscience methods, 238, 43-53.
[28]Shi, F., Leckie, C., MacIntyre, G., Haviv, I., Boussioutas, A., & Kowalczyk, A. (2010). A bi-ordering approach to linking gene expression with clinical annotations in gastric cancer. BMC bioinformatics, 11(1), 477.
[29]Gupta, R., Rao, N., & Kumar, V. (2011). Discovery of error-tolerant biclusters from noisy gene expression data.
[30]Ayadi, W., Elloumi, M., & Hao, J. K. (2009). A biclustering algorithm based on a bicluster enumeration tree: application to dna microarray data. BioData mining, 2(1), 9.
[31]Gonçalves, J. P., & Madeira, S. C. (2010). e-bimotif: Combining sequence alignment and biclustering to unravel structured motifs. In Advances in Bioinformatics (pp. 181-191). Springer, Berlin, Heidelberg.
[32]Huang, T. H., Song, X., & Huang, M. L. (2011, June). Optimized data acquisition by time series clustering in opc. In 2011 6th IEEE Conference on Industrial Electronics and Applications (pp. 2486-2492). IEEE.
[33]Cheng, Y., & Church, G. M. (2000, August). Biclustering of expression data. In Ismb (Vol. 8, No. 2000, pp. 93-103).
[34]Chen, J. R., & Chang, Y. I. (2009). A condition-enumeration tree method for mining biclusters from DNA microarray data sets. Biosystems, 97(1), 44-59.
[35]Tanay, A., Sharan, R., & Shamir, R. (2002). Discovering statistically significant biclusters in gene expression data. Bioinformatics, 18(suppl_1), S136-S144.
[36]Wang, D., Wang, Z., Li, X., Liu, X., Li, J., & Zhang, B. (2007, September). Mapping query to semantic concepts: Leveraging semantic indices for automatic and interactive video retrieval. In International Conference on Semantic Computing (ICSC 2007) (pp. 313-320). IEEE. [37]Denton, A. M., Wu, J., Townsend, M. K., Sule, P., &
Prüß, B. M. (2008). Relating gene expression data on two-component systems to functional annotations in Escherichia coli. BMC bioinformatics, 9(1), 294.
[38]Chen, L. C., Yu, P. S., & Tseng, V. S. (2011). WF-MSB: A weighted fuzzy-based biclustering method for gene expression data. International journal of data mining and bioinformatics, 5(1), 89-109.
[39]Benabdeslem, K., & Allab, K. (2013). Bi-clustering continuous data with self-organizing map. Neural Computing and Applications, 22(7-8), 1551-1562. [40]Charrad, M., Lechevallier, Y., Saporta, G., &
Ahmed, M. B. (2009). Détermination du nombre des classes dans l'algorithme CROKI2 de classification croisée.
[41]Tang, C., Zhang, L., Zhang, A., & Ramanathan, M. (2001, November). Interrelated two-way clustering: an unsupervised approach for gene expression data analysis. In Proceedings 2nd Annual IEEE International Symposium on Bioinformatics and Bioengineering (BIBE 2001) (pp. 41-48). IEEE. [42]Busygin, S., Jacobsen, G., Krämer, E., & Ag, C.
(2002). Double conjugated clustering applied to leukemia microarray data. In In 2nd SIAM
[43]Zhao, H., Cloots, L., Van den Bulcke, T., Wu, Y., De Smet, R., Storms, V., ... & Marchal, K. (2011). Query-based biclustering of gene expression data using Probabilistic Relational Models. BMC bioinformatics, 12(1), S37.
[44]Guifen, C., Baocheng, W., & Helong, Y. (2007, November). The implementation of parallel genetic algorithm based on MATLAB. In International Workshop on Advanced Parallel Processing Technologies (pp. 676-683). Springer, Berlin, Heidelberg.
[45]Gusenleitner, D., Howe, E. A., Bentink, S., Quackenbush, J., & Culhane, A. C. (2012). iBBiG: iterative binary bi-clustering of gene sets. Bioinformatics, 28(19), 2484-2492.
[46]Lazzeroni, L., & Owen, A. (2002). Plaid models for gene expression data. Statistica sinica, 61-86. [47]Hochreiter, S., Bodenhofer, U., Heusel, M., Mayr,
A., Mitterecker, A., Kasim, A., ... & Bijnens, L. (2010). FABIA: factor analysis for bicluster acquisition. Bioinformatics, 26(12), 1520-1527. [48]Li, G., Ma, Q., Tang, H., Paterson, A. H., & Xu, Y.
(2009). QUBIC: a qualitative biclustering algorithm for analyses of gene expression data. Nucleic acids research, 37(15), e101-e101.
[49]Ihmels, J., Bergmann, S., & Barkai, N. (2004). Defining transcription modules using large-scale gene expression data. Bioinformatics, 20(13), 1993-2003.
[50]Andreatta, M., Lund, O., & Nielsen, M. (2012). Simultaneous alignment and clustering of peptide data using a Gibbs sampling approach. Bioinformatics, 29(1), 8-14.
[52]Hochreiter, S., Bodenhofer, U., Heusel, M., Mayr, A., Mitterecker, A., Kasim, A., ... & Bijnens, L. (2010). FABIA: factor analysis for bicluster acquisition. Bioinformatics, 26(12), 1520-1527. [53]Su, L., Liu, G., Wang, J., & Xu, D. (2019). A rectified
factor network based biclustering method for detecting cancer-related coding genes and miRNAs, and their interactions. Methods.
[54]Maind, A., & Raut, S. (2019). Identifying condition specific key genes from basal-like breast cancer gene expression data. Computational biology and chemistry, 78, 367-374.
[55]Yang, L., Shen, Y., Yuan, X., Zhang, J., & Wei, J. (2017). Analysis of breast cancer subtypes by AP-ISA biclustering. BMC bioinformatics, 18(1), 481. [56]Wong, M. H., Mutch, D. M., & McNicholas, P. D.
(2017). Two-way learning with one-way supervision for gene expression data. BMC bioinformatics, 18(1), 150.
[57]Williams, A., & Halappanavar, S. (2015). Application of biclustering of gene expression data and gene set enrichment analysis methods to identify potentially disease causing nanomaterials. Beilstein journal of nanotechnology, 6(1), 2438-2448.
[58]Gao, C., McDowell, I. C., Zhao, S., Brown, C. D., & Engelhardt, B. E. (2016). Context specific and differential gene co-expression networks via Bayesian biclustering. PLoS computational biology, 12(7), e1004791.
[59]Fiannaca, A., La Rosa, M., La Paglia, L., Rizzo, R., & Urso, A. (2015). Analysis of miRNA expression profiles in breast cancer using biclustering. BMC bioinformatics, 16(4), S7.
[60]Henriques, R., & Madeira, S. C. (2014). BicPAM: Pattern-based biclustering for biomedical data analysis. Algorithms for Molecular Biology, 9(1), 27.