Abstract—This article aims to analyze the factors affecting delay in EPC contracts of I.P.D.C. The data are gathered from 71 managers and senior project specialists of I.P.D.C. via questionnaires. The study focused on exploratory factor analysis of key elements. Considering experts’ views and studies there are four key elements hindering EPC contracts namely, improper planning, lack of commitment, employer’s influence and external uncertainties.
Keywords: Factor affecting, Commitment, contractor, Power Development
I. INTRODUCTION
imely delivery of projects has always been a factor of prime importance to institutions and companies. Right performance of important and large projects depends on utilizing new and progressive techniques by project managers. EPC technique gives speed to project execution by encompassing engineering, procurement, and construction. It facilitates resource utilization. Nowadays, performing projects in EPC form is gaining outstanding growth. Nevertheless, EPC projects are faced with risks, delays and unexpected events in spite of diverse advantages. Appropriate decision taking against these events may affect other parameters of the project such as cost, time and quality.
II. LITERATURE REVIEW
A. Improper Planning
Improper planning stems from weak coordination between parties and their misunderstanding of self, roles, and responsibility in the project (Doloi et al., 2012, Tohidi, H et al., 2017, Namdari, A et al., 2017). Delay in material delivery and inefficient use of construction equipment has
Manuscript received August 22, 2017; revised November 11, 2017. Corresponding author: Hamid Tohidi, College of Industrial Engineering,
South Tehran Branch, Islamic Azad University, Tehran, Iran. Email: [email protected]
Mohammad Mehdi Jabbari, Electrical Engineering Department, South Tehran Branch, Islamic Azad University, Tehran, Iran.
Omid Tohidi, Computer Engineering Department, Amirkabir University, Tehran, Iran.
had outstanding effect in achieving planned objectives of the project. Serious climatic conditions and geographical location complicate following of project scheduling (Assaf, S.A. and Al-Hejji, S., 2006, Haghighat et al., 2006) experienced over 50% of delays in construction projects due to factors such as delay in construction plans, weak scheduling, and slow decision-making process.
‘Significant factors causing a delay in the UAE construction industry’ (Faridi, A. and El-Sayegh, S. (2006).
B. External Uncertainty
Uncertainty is usually defined as lack of ability to indicate alternative solutions to solve unexpected problems and conditions arising from international sanctions, insufficient confidence in quantitative and qualitative information and the imposition of local manufacturers’ views and schedules.
C. Lack of Commitment
Lack of commitment is usually manifested by weak management methods, delay in material delivery, repetition of accidents due to insufficient safety precaution and lack of enthusiasm & motivation in project performance.
Mansfield et al., 1994 studied delay and cost increase reasons within contracts. The came to four major factors causing a delay in projects; lack of financial support for finished work, weak management, changes in site conditions and a shortage of material.
D. Employer’s influence
Clients’ needs against repetitive change of contractors or subcontractors, change of project scope or design are reported as common causes of delay in many projects. Lack of organizational, communication and reporting structure between employer and consultants inhibits contractors’ timely performance in giant projects (Semple et al., 1994, Aibinu and Odeyinka 2006).
Skitmore et al., (2009) carried out a similar study in Saudi Arabia investigating seven key sources of delay, i.e. client, contractor, consultant, material, labor, contract, and communication. One of the major causes for the delay was lack of qualified and experienced personnel.
The objective of the study is to analyze the factors affecting delay in EPC contracts of I.P.D.C.
Exploratory Analysis of Factors Influencing
Delay in EPC Contracts of Iranian Power
Development Company
Hamid Tohidi, Mohammad Mehdi Jabbari, Omid Tohidi
Fig 1. The Proposed Model
Table I: Factors affecting delay
III. METHODOLOGY
[image:2.595.54.533.62.700.2]In order to investigate factors affecting delay in EPC contracts and their relationships with each other, five factors and twenty questions were adapted as variables by Delphi method using ten experts. The questionnaires were distributed among 100 specialized employees and project managers of I.P.D.C. out of which 71 questionnaires came out to be eventually usable. As factor analysis is sensitive to asymmetry, some questions were omitted. Each item was given a value range of very little, little, average, high and very high. Cronbach’s alpha was used to measure questionnaire’s validity. Alpha came to be 969.0 which was higher than the least favorable value of 70.0. As alpha is higher than 90%, the questions had multicollinearity, and therefore overlapped items were indicated via variance factor. Afterwards, Variance Factor (VIF) larger than75.2 was omitted, and the number of items decreased to 16, while Cronbach’s alpha became 90% indicating that reliability lowered.
Table II: Cronbach’s alpha
Reliability Statistics
Cronbach' s Alpha
Cronbach'
s Alpha
Based on Standardize
d Items
N of Items
.901 .900 16
Kaiser-Meyer-Olkin measure of sampling adequacy was then carried out proving the inequality of correlation and identity matrices.
Table III: Kaiser-Meyer-Olkin measure
Kaiser-Meyer-Olkin Measure of Sampling
Adequacy
0.799
Bartlett's Test of Sphericity
Approx.
Chi-Square
647.616
Df. 120
Sig. .000
Skewness, multicollinearity and sampling adequacy was performed for the whole questionnaire as well as for each individual item. Also, Measure of Sampling Adequacy (MSA) was made via Principal Component Analysis (PCA) so that conditions are set for factor analysis.
Chan and Kumaraswammy (1997) [6];
Satyanarayana and Iyer (1996).[19]
Lack of
commitment (LC)
Aghaee Peyman (2005);
Knowledge of causes of delayed EPC projects.[1]
External uncertainty (EU)
Lo et al.(2006)[12]; Assaf et al. (1995)[5]; Ei-Razek et al.(2008)[9]; Ahsan and Gunawan (2010)[2] Improper planning
(IP)
Nikjo M ,Kiani M and Norang A (2009).Knowledge of causes of delayed projects.[15]
Employer`s influence (EI)
Satyanarayana and Iyer (1996) [19];
Sambas Ivan and Soon (2007) [18];
Odeh and Battaineh (200) [16]. Contractor`s
IV. UNITS RESULTS OF EXPLORATORY FACTOR ANALYSIS In this section, results of exploratory factor analysis are exhibited. They are ordered from highest to the lowest.
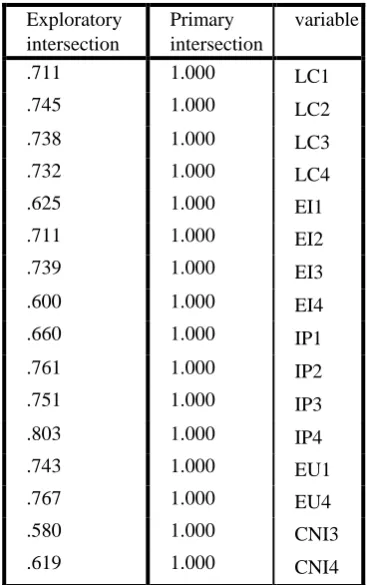
Table IV. Intersections in survey subjects
As observed in table III primary intersections are calculated via all possible components (factors) and are always equal to 1. Likewise, explorative intersections are only calculated by explored factors which are usable values. If intersection value of an item falls below 5.0, it gets omitted. According to 4-19, item CN1315 (low labor efficiency) bears the lowest intersection (580.0), and item IP412 (improper use of equipment) takes the highest rate of intersection (803.0).
A. First Factor: Improper Planning
The first item in Factor analysis which influences EPC contracts is improper planning. This factor comprises of six variables below: Weak coordination between parties, long time spent on contract reviews, delays in material preparation, inefficient use of equipment and lack of control on subcontractors. Calculated Cronbach’s alpha came out to be 0.897 as exhibited in table V along with other detailed findings.
Table V exhibits values before and after rotation. As evident, Specific value and percentages have changed (First specific value= 271.4, Second value=614.2, third value 548.2, fourth= 851.1). However, cumulative percentages are all equal to values before rotation (According to table V, % cumulative before and after rotation=528.70). 5.70 % delay is under the influence of these four factors.
Table V. Total Variance Expressed via Factor Analysis of Survey Subjects fact ors Primary specific value Explorative value Explorative values after rotation To tal varia nce % o f varia nce Cum ulat i ve% To tal varia nce of % varia nce Cum ulat i ve % To tal varia nce % o f varia nce Cum ulat i ve% 1 6.81 9 42.6 18 42.6 18 6.81 9 42.6 18 42.6 18 4.27 1 26.6 91 26.6 91 2 1.79 1 11.1 91 53.8 09 1.79 1 11.1 91 53.8 09 2.61 4 16.3 41 43.0 31 3 1.3 86 8.6 63 62. 473 1.3 86 8.6 63 62. 473 2.5 48 15. 925 58. 956 4 1.28 9 8.05 5 70.5 28 1.28 9 8.05 5 70.5 28 1.85 1 11.5 72 70.5 28 5 .810 5.06 1 75.5 89 6 .72 2 4.5 12 80. 102 7 .651 4.06 8 84.1 70 8 .508 3.17 6 87.3 46 9 .42 0 2.6 23 89. 969 10 .343 2.145 92.11 5 11 .33 5 2.0 96 94. 210 12 .26 8 1.6 78 95. 888 13 .24 4 1.5 27 97. 415 14 .16 8 1.0 51 98. 467 15 .13 7 .85 3 99. 320 16 .109 .680 100. 000 Exploratory intersection Primary intersection variable
.711 1.000 LC1
.745 1.000 LC2
.738 1.000 LC3
.732 1.000 LC4
.625 1.000 EI1
.711 1.000 EI2
.739 1.000 EI3
.600 1.000 EI4
.660 1.000 IP1
.761 1.000 IP2
.751 1.000 IP3
.803 1.000 IP4
.743 1.000 EU1
.767 1.000 EU4
.580 1.000 CNI3
Table VI: Improper Planning variables Sorte
d Factor Weight
Rotation Sums of Squared Loadings
Total Vari % of
anc
e
Cumul
ati
v
e
%
Weak coordination between parties
.849
4.618 26.691 26.691
long time spent on contract reviews
.793
delay in material supply
.753
inefficient use of equipment
.691
Low labor productivity
.690
lack of control on
subcontractors
.664
B. Second Factor: Lack of Commitment
The second item of factor analysis is lack of commitment. This factor covers four variables: Site accident, weak / supervision, contractor’s lack of motivation and delay in material delivery by suppliers. Calculated Cronbach’s alpha came out to be 0.818. Table VII exhibits findings.
Table VII: Lack of Commitment
variables
Sorted Factor Weight
Rotation Sums of Squared Loadings
Total Vari % of
anc
e
Cumul
ati
v
e
%
Site
accidents due to safety ignorance
.794
2.614 16.341 43.031
Weak
management/su pervision
.764
Contractor’s lack of motivation
.748
delay in material delivery by suppliers
.619
C. Third Factor: Employer’s Influence
The third factor is employer’s influence, which affects delays in EPC contracts. This factor comprises of four variables: Approval of design by employer, weak teamwork morale, holding fake tenders and insufficient knowledge of chairperson and members. Calculated Cronbach’s alpha came out to be 0.808. Table VIII exhibits findings.
Table VIII: Employer’s Influence
variables
Sorted Factor Weight
Rotation Sums of Squared Loadings
Total Vari % of
anc
e
Cumul
ati
v
e %
Approval of design by employer
.818
2.548 15.925 58.956
weak teamwork
morale .690
holding fake
tenders .668
insufficient knowledge of chairman and
members
.659
D. Fourth Factor: Uncertainty
[image:4.595.40.556.66.402.2]The fourth factor is uncertainty, which influences the delay in EPC contracts. This factor consists of two variables first; imposed views of monopolized local manufacturers and second; insufficient confidence in information quality and quantity. Calculated Cronbach’s alpha came out to be 0.686. Table IX exhibits detailed findings.
Table IX: Uncertainty
variables
Sort ed Factor Weight
Rotation Sums of Squared Loadings
Total Vari % of
anc
e
Cumul
ati
v
e
%
imposed views of monopolized local
manufacturers
.847
1.851 11.572 70.528
insufficient confidence in information quality and
quantity
.795
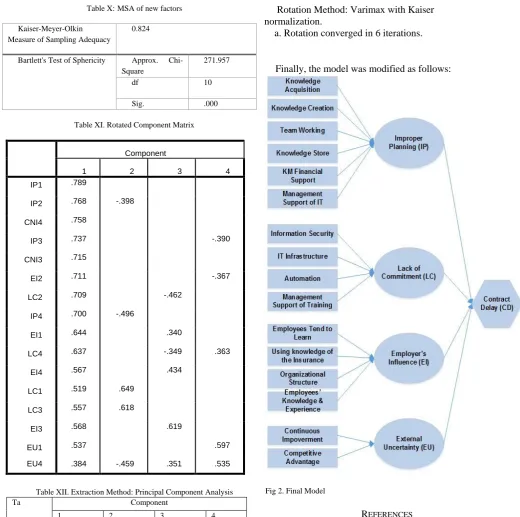
[image:4.595.52.552.500.770.2]Table X: MSA of new factors Kaiser-Meyer-Olkin
Measure of Sampling Adequacy
0.824
Bartlett's Test of Sphericity Approx. Chi-Square
271.957
df 10
Sig. .000
Table XI. Rotated Component Matrix
Table XII. Extraction Method: Principal Component Analysis
Ta Component
1 2 3 4
IP4 0.849
IP3 0.793
IP2 0.753 0.405
IP1 0.691
CNI3 0.69
CNI4 0.664
LC3 0.794
LC1 0.764 0.348
LC4 0.341 0.748
LC2 0.595 0.619
EI3 0.818
EI1 0.345 0.69
EI4 0.668
EI2 0.508 0.659
EU4 0.847
EU1 0.795
Rotation Method: Varimax with Kaiser normalization.
a. Rotation converged in 6 iterations.
Finally, the model was modified as follows:
Fig 2. Final Model
REFERENCES
[1] AghaeiDibaei, Peyman (2005). Analyzing the Causes of Delays in the Engineering Sector of the EPC Petrochemical Projects. The 2nd Conference of Project Management.
[2] Ahsan, M.K. and Gunawan, I. (2010) Analysis of cost and schedule performance of international development projects. International Journal of Project Management, 28, 68–78.
[3] Aibinu, A.A. and Odeyinka, H.A. (2006) Construction delays and their causative factors in Nigeria. Journal of Construction Engineering and Management, 132, 667–77.
[4] Assaf, S.A. and Al-Hejji, S. (2006) Causes of delay in large construction projects. International Journal of Project Management, 24, 349–57.
[5] Assaf, S.A., Al-Khalil, M. and Al-Hazmi, M. (1995) Causes of delay in large building construction projects. ASCE Journal of Management in Engineering, 11, 45–50.
[6] Chan, D.W.M., and Kumaraswamy, M.M. (1997) ‘A comparative study of causes of time overruns in Hong Kong construction projects. International Journal of Project Management, 15, 55–63.
[7] Doloi, H., Sawhney, A., Iyer, K.C., and Rentala, S. (2012) Analysing factors affecting delays in Indian construction projects. International Journal of Project Management, 30, 479–89.
Component
1 2 3 4
IP1 .789
IP2 .768 -.398
CNI4 .758
IP3 .737 -.390
CNI3 .715
EI2 .711 -.367
LC2 .709 -.462
IP4 .700 -.496
EI1 .644 .340
LC4 .637 -.349 .363
EI4 .567 .434
LC1 .519 .649
LC3 .557 .618
EI3 .568 .619
EU1 .537 .597
[8] Doloi, H., Sawhney, A., Iyer, K.C., and Rentala, S. (2012) Analysing factors affecting delays in Indian construction projects. International Journal of Project Management, 30, 479–89.
[9] El-Razek, A.M.E., Bassioni, H.A., and Mobarak, A.M. (2008) ‘Causes of delay in building construction projects in Egypt. Journal of Construction Engineering and Management, 134, 831–41.
[10] Faridi, A. and El-Sayegh, S. (2006) Significant factors causing a delay in the UAE construction industry. Construction Management and Economics, 24, 1167–76.
[11] Huang, L., & Lai, C. (2012). An investigation on critical success factors for knowledge management using structural equation modeling. Procedia - Social and Behavioral Sciences , 40, 24-30 [12] Lo, T.Y., Fung, I.W.H. and Tung, K.C.F. (2006) Construction delays
in Hong Kong civil engineering projects. Journal of Construction Engineering and Management, 132, 636–49.
[13] Mansfield, N., Ugwu, O. and Doran, T. (1994) Causes of delay and cost overruns in Nigerian construction projects. International Journal of Project Management, 12, 254–60.
[14] Namdari, A., Drzymalski, J., & Tohidi, H. (2017). Labor Productivity and Optimal Team Size in an Inspection Process. In IIE Annual Conference. Proceedings (pp. 854-859). Institute of Industrial and Systems Engineers (IISE).
[15] Nikjo, M., Kiani, M., and Norang, A. (2009). Knowledge of causes of delayed projects.
[16] Odeh, A.M. and Battaineh, H.T. (2002) Causes of construction delay: traditional contracts. International Journal of Project Management, 20, 67–73.
[17] Olawale, Y.A., and Sun, M. (2010) Cost and time control of construction projects: inhibiting factors and mitigating measures in practice. Construction Management and Economics, 28, 509–26. [18] Sambasivan, M. and Soon, Y.W. (2007) Causes and effects of delays
in Malaysian construction industry. International Journal of Project Management, 25, 517–2.
[19] Satyanarayana, K.N. and Iyer, K.C. (1996) Evaluation of delays in Indian construction contracts. Journal of the Institution of Engineers (India), 77, 14–22.
[20] Semple, C., Hartman, F. and Jergeas, G. (1994) Construction claims and disputes: causes and cost/time overruns. Journal of Construction Engineering and Management, 120, 785–95.
[21] Taheri, S.M., Sarfaraz, A.H., Seyedaliakbar, S.M. (2014).Investigating the effects of knowledge management and organizational innovation on organizational strategy: Evidence from insurance industry. Management Science Letters 4 (2014) 2399–2406 [22] Tohidi, H., Namdari, A., Keyser, T. K., & Drzymalski, J. (2017).