161
Calculating The Expected Time To Seroconversion Of
HIV Infected Using Two Source Of Transmission
BharathidassP
1
P
, sathiyamoorthyP
2
P
LognathanP
3
P
and PandiyanP
4
P
*
P
1
P
Assistant Proffesor, Department of Statistics, Periyar EVR College, Trichy.
P
2
P
Research Scholar, Department of Statistics, , Periyar EVR College, Trichy.
P
3
P
Assistant Proffesor, Department of Statistics,Tirukkoilur college Arts &Sciences.
P
4
P
Associate Professor, Department of Statistics, Annamalai University.
*Corresponding author’s email: UsubashstatU32TU@gmail.comU32T
Abstract
The public health issues have a lot of importance in our society, particularly the Human
Immunodeficiency Virus (HIV) infection. If leave HIV had become be leading cause of deaths because of
increased life expectancy. Statistical tools were derived from the firmly established theory of epidemiological
modeling, although some adjustments are made because of specific characteristics of HIV infection. In this
paper shock model approach to estimate the threshold level is been derived by three parameter Exponentiated
Weibull distribution. The Data collected in trichy region and fitted for this model are also used to support be
model development.
Key words : Epidemiological modeling, Expected time, HIV INTRODUCTION
Mathematical models based on the underlying transmission of HIV might help the medical and
community. such modeling is still vital in investigating how changes in the various assumptions and parameter
values affect the course of the epidemic. Therefore, by developing such mathematical models, we can to some
extent anticipate its spread in different populations and evaluate the potential effectiveness of different
approaches for bringing the epidemic under control, and thus help to devise effective strategies to minimize the
destruction caused by this epidemic.
The threshold beyond which the human immune system cannot wits and is represented as sum of two
random variables. One can see for more details in Esary et al. (1973) and Pandiyan et al.,(2014), discussed about
the expected time to cross threshold level of seroconversion period. In this chapter a stochastic model is
discussed by considering the fact that a person is exposed to two different modes of transmission of HIV and the
www.ijiset.com
162
ASSUMPTIONS OF THE MODEL
Sexual contacts are the only source of HIV infection person.
The threshold of any individual is a random variable.
If the total damage crosses a threshold level Y which itself is a random variable, the seroconversion occurs
and a person is recognized as an infected.
The interarrival time between the successive contacts are at random variable which are identically.
MODEL DESCRIPTION
The Cumulative density function (CDF) of the three parameter Exponentiated Weibull distribution
𝐹(𝑥,𝜃) =�1− 𝑒−�𝑥𝜆�𝑘� 𝛼
; 𝑥> 0
The corresponding survival function is is given in equation (1), on simplification
𝐻� (𝑥) =𝑒−� 𝑥𝜆1� 𝑘1
+𝑒−� 𝑥𝜆2� 𝑘2
− 𝑒−� 𝑥𝜆1� 𝑘1
𝑒−� 𝑥𝜆2� 𝑘2
… (1)
The shock survival probability is given by
𝑃(𝑋𝑖<𝑌) =� 𝑔∗(𝑥) ∞
0
𝐻�(𝑥) 𝑑𝑥
Now the threshold Y is such that it has two contacts namely 𝑌1and 𝑌2. Transfer of Immune system from
𝑌1 to 𝑌2 is also possible. We have the threshold level of seroconversion is given by 𝑌=𝑚𝑎𝑥(𝑌1,𝑌2).
𝑃[𝑚𝑎𝑥(𝑌1,𝑌2)] =𝑃[(𝑌1<𝑦)∩(𝑌2<𝑦)] =𝑃[𝑌1<𝑦]𝑃[𝑌2<𝑦]
Now that, 𝑌1 and 𝑌2 follow three parameter Exponentiated Weibull distribution with parameter 𝜆,𝑘 𝑎𝑛𝑑 𝛼 .
The continous random variable denotes the threshold level. the survivor function i.e 𝑃(𝑇>𝑡).
𝑃(𝑇>𝑡) =� 𝑉𝑘(𝑡) 𝑃 �� 𝑋𝑖 𝑘𝑖
𝑖=1
<𝑚𝑎𝑥 𝑌1,𝑌2� ∞
𝑘=0
163
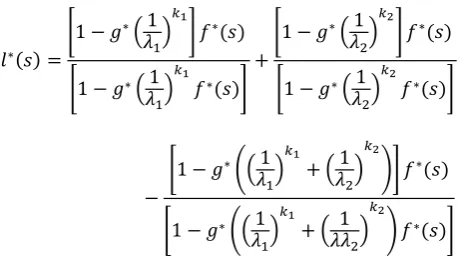
To find expected time of the threshold we D.r.to S=0 in equation in equation (3). Let the random variable U
denoting inter arrival time which follows exponential with parameter c. Now 𝑓∗(𝑠) =� 𝑐
𝑐+𝑠�, substituting in the
above equation(4).
𝑙∗(𝑠) =�1− 𝑔 ∗�1
𝜆1� 𝑘1
� 𝑓∗(𝑠)
�1− 𝑔∗�1 𝜆1�
𝑘1
𝑓∗(𝑠)� +
�1− 𝑔∗�1 𝜆2�
𝑘2
� 𝑓∗(𝑠)
�1− 𝑔∗�1 𝜆2�
𝑘2
𝑓∗(𝑠)�
−
�1− 𝑔∗��1 𝜆1�
𝑘1
+�𝜆1 2�
𝑘2
�� 𝑓∗(𝑠)
�1− 𝑔∗��1 𝜆1�
𝑘1
+�𝜆𝜆1 2�
𝑘2
� 𝑓∗(𝑠)�
… (3)
The inter arrival time which follows exponential distribution is subsisted in Laplace transform of equation. we
finally obtain the expected time in the equation(4).
𝐸(𝑇) =𝜆1𝑘1𝜇𝑐 1+ 1+𝜆2𝑘2𝜇𝑐 2+ 1− �𝜇1𝜆1𝑘1𝜇2𝜆2𝑘2+𝜇1𝜆1𝑘1+𝜇2𝜆2𝑘2+ 1� 𝑐 �𝜇1𝜆1𝑘1+ 1− 𝜇1𝜆1𝑘1− 𝜇1𝜇2𝜆2𝑘2𝜆1𝑘1� … (4)
Where
C = Time interval of CD4 count, 𝜇1= Platelet count
𝜇2= Activated Partial Thromboplastin Time 𝜆1= Prothrombine Tim
𝜆2= Viral RNA , KR1R= CD8 count KR2 R=protein 24
www.ijiset.com
164
Age
Time interval of CD4 count
C
𝜇1Platele
t count
𝜇2Activated
Partial Thromboplastin
Time
𝜆1
Prothrombi ne Tim
𝜆2
Viral RNA
34 405 230 22.6 16.1 1360
27 706 210 25.6 18 1556
30 516 260 58.2 22.3 1650
45 945 246 70.6 27.6 1959
28 146 205 20.6 21.3 612
42 590 340 59.7 29.4 1552
33 242 225 27.1 14.6 812
30 415 175 19.5 13.9 1293
28 253 190 31.8 11.4 673
47 346 148 28.4 12.4 994
32 526 250 85.4 15.8 1267
44 80 110 22.7 26.4 268
38 256 240 22.6 14.5 689
55 430 210 17.3 16 1750
39 530 179 26.8 19.6 1681
52 600 416 120.4 26.9 1908
29 297 199 30.4 18.3 853
33 458 160 27.3 15.4 1548
38 269 176 19.9 11.8 759
46 556 256 46.8 16.3 1761
47 526 350 60.9 22.4 1689
52 340 195 35 11.5 879
35 310 169 42.6 14.6 794
34 405 210 43.6 15.9 1268
46 425 280 34.2 11.7 1164
34 254 190 31.8 11.4 670
46 348 144 28.4 12.4 994
41 527 250 85.4 15.8 1260
45 80 110 22.7 26.4 268
49 255 241 22.6 14.5 689
CONCLUSION
In the study blood samples were collected from HIV positive individuals residing in Trichy .
Stochastic model was applied to assess the progression of illness among the infected individuals.
Out of the 30 HIV positive patients table 1 given above for observation there were 18 males and 12
165
viz. Platelet count, pothrombin, time and activated partial thromboplastin time and viral RNA that the time to
reach threshold is very near once the CD4 count starts decreasing.
When CD4 count is kept fixed with other parameters Platelet count, pothrombin, time and activated
partial thromboplastin time and viral RNA the inter-arrival time ′𝑐′, which follows Exponential distribution, is
an increasing parameter. Therefore, the value of the expected time 𝐸(𝑇) to cross the threshold of seroconversion
is decreasing,
Reference
1. Wodarz, D and M.A., Nowak, (2002). Mathematical models of HIV pathogenesis and treatment.
Bio Essays, Vol. 24, pp.1178-1187.
2. Purushottam A Giri, Jayant D Deshpande, and Deepak B Phalke (2013). Prevalence of Pulmonary Tuberculosis Among HIV Positive Patients Attending Antiretroviral Therapy Clinic, N Am J Med
Sci. 2013 Jun; 5(6): 367–370.
3. Rockville (MD): Substance Abuse and Mental Health Services Administration (US); 2000.
(Treatment Improvement Protocol (TIP) Series, No. 37.) Executive Summary and
Recommendations.
4. Pandiyan (2013). Calculating Human Immune Virus Infected Persons Survival Time Through
Stochastic Model. Bio Science Research Bulletin-Biological Sciences . Vol. 29 Issue 1, p1-4. 4p.
5. G.S.Mudholkar and D.K.Srivastava, (1993), “Exponentiated Weibull family for analyzing bath-tab