Energy Audit of an Industry & Solution on
Energy Wastage According to Variable Load
Analysis
Yuvraj U. Rathod1 , Mithun M. Bhavsar2, Rahul G. Mule3,Shubham S. Kale4, Rushikesh D. Pandit5, Pritesh D. Jagtap6
Head of the Department, Dept. of EE, MGM’s Polytechnic, Aurangabad, Maharashtra, India1
Lecturer, Dept. of EE, MGM’s Polytechnic, Aurangabad, Maharashtra, India2
Student, Diploma in Electrical Engineering, MGM’s Polytechnic, Aurangabad, Maharashtra, India3
Student, Diploma in Electrical Engineering, MGM’s Polytechnic, Aurangabad, Maharashtra, India4
Student, Diploma in Electrical Engineering, MGM’s Polytechnic, Aurangabad, Maharashtra, India5
Student, Diploma in Electrical Engineering, MGM’s Polytechnic, Aurangabad, Maharashtra, India6
ABSTRACT: India is a developing country and electrical energy consumption by industries is about 60% of the total energy consumption. The industrial development in the country is progressing at a fast pace due to the increase in the number of industries, the gap among demand and supply of electricity is also increasing continuously. To minimize this gap the perfect solution is to conduct is energy audit of all industries on frequent bases. The energy audit will determine energy wastage and losses, and provide techniques and ways to minimize the losses. The energy consumption by different ways suggested by the energy audit will not only decrease the losses but also reduce monthly electricity bill. This paper suggests ways and means to conduct an energy audit in an industry.
KEYWORDS: Energy Audit, Energy Consumption (EAC), Energy Conservation, Power Factor Surcharge PFS, Payback Period(PBP), Energy Audit Phase(EAP), Energy Conservation Opportunities (ECOs).
I. INTRODUCTION
II. DATA COLLECTION
The proposed work will cover following sections.
Fig.1 Plant Layout and Power Flow Diagram of Industry
A) Audit Phase- I (Pre-Audit Phase)
During pre-audit phase the following observations/inspection were complited within two days as per the schedule given in Table 1
Table.1 Schedule of Energy Audit Phase -1
Sr. no. Observations/inspection Result
i A complete walk through in the industry Done ii Discuss advantages of energy audit Done iii Inspect various sections for any energy wastage Done
iv Prepare a list of major energy consuming machinery with their ratings
See Table-2
v Obtain drawings and electrical distribution See Figure-1 vi To identify instruments required for audit See Table-2 vii Calculate lighting and machine load See Table-4
viii Check any loose connection and leakage No any loose connection and leakage ix Prepare a visual inspection report See Table-5
X Suggestion and ECOs for Pre-audit Phase-I See Table-6
Table.2 Instruments Required for Energy Audit S.no. Name of Instruments
1 Digital Multimeter 2 Digital Tachometer
3 Power Analyser having kW,kVA options Clip on meter
4 Measuring tape of 100 meter 5 Lux meter
B) Audit Phase- II
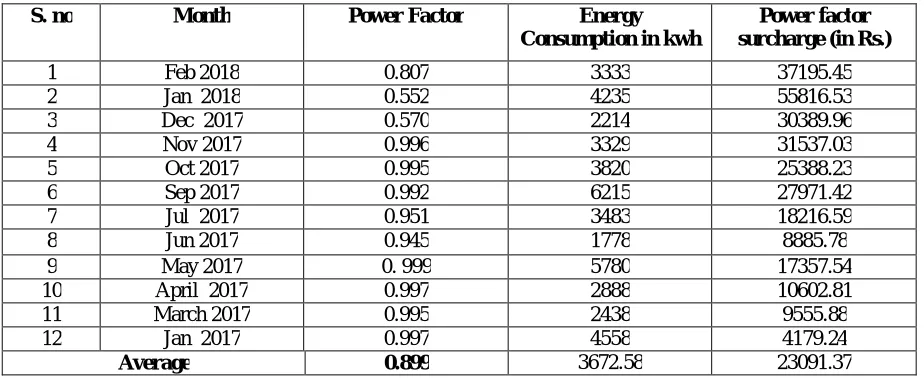
During audit phase II the following observations were completed within 10 days. The summary of electricity bills of 12 months since Jan 2017 to Feb 2018 is shown in Table 8. Due to some technical reason the electricity bill for the month of Feburary-2017 and Aug 2017 was not added in the electricity bill .Therefore there were some irregularities found in electricity bills of Dinanath industry.
Table .3Summary of Annual Electricity Bills
S. no Month Power Factor Energy
Consumption in kwh
Power factor surcharge (in Rs.)
1 Feb 2018 0.807 3333 37195.45
2 Jan 2018 0.552 4235 55816.53
3 Dec 2017 0.570 2214 30389.96
4 Nov 2017 0.996 3329 31537.03
5 Oct 2017 0.995 3820 25388.23
6 Sep 2017 0.992 6215 27971.42
7 Jul 2017 0.951 3483 18216.59
8 Jun 2017 0.945 1778 8885.78
9 May 2017 0. 999 5780 17357.54
10 April 2017 0.997 2888 10602.81
11 March 2017 0.995 2438 9555.88
12 Jan 2017 0.997 4558 4179.24
Average 0.899 3672.58 23091.37
The Performance of different machines and appliances for Dinanath industry is shown in Table 9.This table shows that almost all machines were not being operated with their maximum capacity. It means that the motors used in these machines are higher rating or over size . This table also shows that all machines operated at average power factor of 0.8999 lag. Also traditional welding sets draw high current and operate at 0.8 lagging power factor that causes power factor low. Due to this reason the power factor of industry will be low and there is an average monthly power factor surcharge (Rs.23091.37) is added in electricity bill. It is an extra cost paid by consumer which needs to be reduced by energy auditing.
Fig.3 shows the monthly billing unit variation in a year
C) Line Graph Of Monthly Consumption Unit..
Fig.4 shows the monthly billing amount variation in a year
Line Graph OfMonthiy Billing Amount In Rs
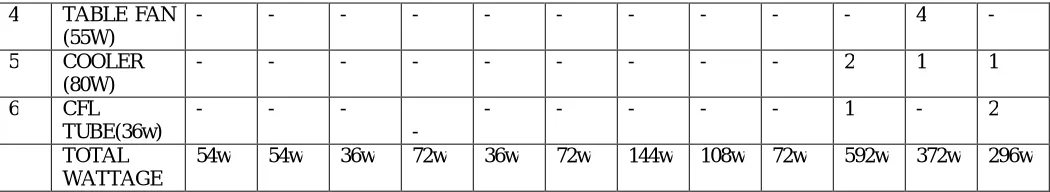
Table4. Performance of Electrical Appliances/Machines for Dinanth Industry Lighting load:
Sr. No.
Type Of Load
Block 1
Block 2
Block 3
Block 4
Block 5
Block 6
Block 7
Block 8
Block 9
Block 10
Block 11
Block 12
1 CFL(18W) 1 1 - - - 4 4 - - 2
2 LED(36W) - - - 2 1 2 4 1 - - - -
3 TUBELIGH T(36W)
1 1 1 - - - -
-
4 TABLE FAN (55W)
- - - 4 -
5 COOLER (80W)
- - - 2 1 1
6 CFL TUBE(36w)
- - -
-
- - - 1 - 2
TOTAL WATTAGE
54w 54w 36w 72w 36w 72w 144w 108w 72w 592w 372w 296w
Total lighting load =54w + 54w + 36w + 72w + 36w + 72w + 144w + 108w + 72w + 592w + 372w + 296w= 1908W
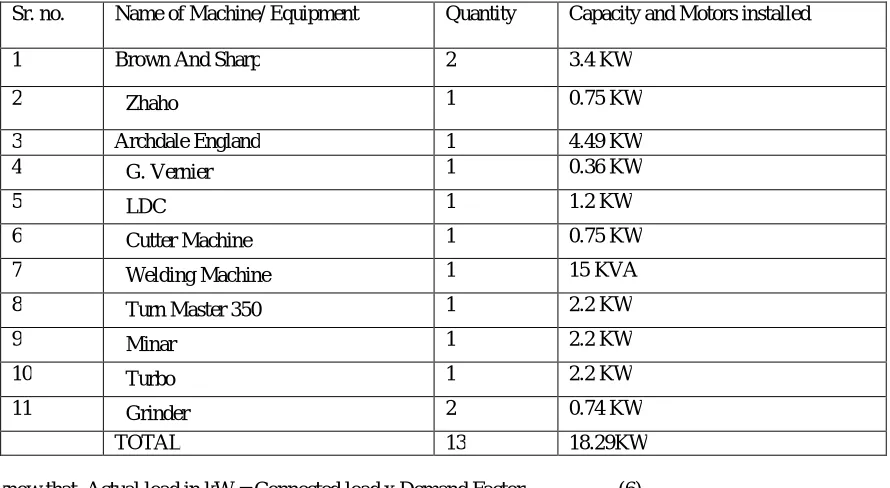
Table 5.Machine load : Workshop-1
Sr. no. Name of Machine/ Equipment Quantity Capacity and Motors installed
1 Brown And Sharp 2 3.4 KW
2 Zhaho 1 0.75 KW
3 Archdale England 1 4.49 KW
4 G. Vernier 1 0.36 KW
5 LDC 1 1.2 KW
6 Cutter Machine 1 0.75 KW
7 Welding Machine 1 15 KVA
8 Turn Master 350 1 2.2 KW
9 Minar 1 2.2 KW
10 Turbo 1 2.2 KW
11 Grinder 2 0.74 KW
Workshop-2
Sr. no. Name of Machine/ Equipment Quantity Capacity and Motors installed
1 Grinder 4 4.6KW(each)
2 Drilling 4 2.2 KW(each)
Total machinery load in industry(Workshop-1): 3.4+0.75+4.49+0.36+1.2+0.75+2.2+2.2+2.2+0.74=18.29KW Total machinery load in industry (Workshop-2):(4.6*4)+(2.2*4)=27.2KW
Total load = (Workshop-1) + (Workshop-2) = 18.29+27.2 = 45.49KW = 4549W
Energy Consumption in industry
Fig.5 Equipment Wise Energy Consumption
Referring Fig.4, it can be seen that contract demand and billing demand of factory is 62 kVA , 24 kVA respectively but factory should be operated on low demand(recorded demand).
III. KVAR CALCULATION FOR INDUSTRY
According to the electrical data given below the required kVAr or capacitor bank can be calculated to maintain the
power factor of 0.95 to reduce power factor surcharge because the electrical utility shall be apply a power factor clause
for those consumers who have not maintain the average power factor of 0.90.In case the average power factor falls
below 0.9(90%), a surcharge @1% of energy charges for every 0.01(1%) fall in average power factor below
0.90(90%), shall be charged. Also an incentive of 1% of energy charges shall be provided if power factor is above
0.95(95%) for each 0.01 (1%) improvement above 0.95(95%).
Sanctioned load = 67 hp, Load in KW = 50.25
Average power factor (during the year Jan 2017 to Feb 2018) = 0.899 (Referring Fig.2)
Required power factor = 0.95
The power factor is defined as the ratio of true or real power in kW to apparent power in kVA.
Therefore, Power factor (cosΦ) = kW/kVA (1)
The required kVAr can be calculated from the above equation 2.If the power factor is improved from 0.863 to 0.95 this
wills reduces the power factor surcharge. The required kVAr or capacitor bank can be calculated from the given below.
Power Factor Correction
The required kVAr will be calculated as under tan= AC/OA, OA = P (kW).
Therefore, AC = P tanØ1 And AB = P tanØ2, BC =AC –AB, put the values
we get,BC = P tanØ1 - P tanØ2
Brown And Sharp 14%
Zhaho
2% Archdale England9%
G. Vernier 1% LDC
2%
Cutter Machine 2%
Turn Master 350 4% Minar
4% Turbo
4% Grinder
3% Grinder
37% Drilling
18%
and BC = Q (kVAr)- Q (kVAr) = P (tanØ1 – tanØ2) (3)
where,
cosØ1 = 0 .899 (existing power factor), Ø1=25.97
cosØ2 = 0.95 (required power factor) Ø2 = 18.194
Put the values of P = 50.25 Q (kVAr) = 50.25 [tan (25.97) – tan (18.194)
Q (kVAr) = 7.960, say 30 kVAr (approximately) (4)
IV. THREE PHASE CABLE SIZE CALCULATION
The load 50.25 KW in Dinanath industry is divided in two power circuits, hence the full load input current at average power factor of 0.899 and at 440 V supply voltage will be
I = P/ V cosΦ
I = (50.25 x1000)/1.732x 440 x 0.899 = 73.34 A. (5)
The power circuits uses two sized cables in these circuits,the first power circuit has 50sqmm,1100V, PVC, multi core Aluminum cable, while second power circuit has 35 sq mm,1100V, PVC, multi core Aluminum cable Comparing these three phases of current, hence it can be observed that the three phases of load of industry is almost balanced. The verification of above cable sizes can be determined as under shown in Table 10
Table 6. Load Calculation for Power Circuit no.1
Sr. no. Name of Machine/ Equipment Quantity Capacity and Motors installed
1 Brown And Sharp 2 3.4 KW
2 Zhaho 1 0.75 KW
3 Archdale England 1 4.49 KW
4 G. Vernier 1 0.36 KW
5 LDC 1 1.2 KW
6 Cutter Machine 1 0.75 KW
7 Welding Machine 1 15 KVA
8 Turn Master 350 1 2.2 KW
9 Minar 1 2.2 KW
10 Turbo 1 2.2 KW
11 Grinder 2 0.74 KW
TOTAL 13 18.29KW
We know that, Actual load in kW = Connected load x Demand Factor (6) Taking demand factor for industry = 0.75 (7)
Length of power circuit no.1= 38meters (measured).The full load current for this circuit is at 440V, 0.863 power factor will be, I = (13.71 x 1000) /(√3 x 440x0.899) =20.01 A. Now we can select 50 sq mm, 1100V, PVC, 3.5 core,
Aluminum cable Havells[5]. Its current carrying capacity is 155 amperes and resistance per kilometer is 0.443 ohms . The resistance of 38 meter length cable = (0.443x 38)/1000 R = 0.01683 ohms
The permissible voltage drop = (440x5)/100= 22V (8)
Actual voltage drop in cable of circuit no.1 =√3. I R=√3 x 13.71 x 0.01683 = 0.39 V . (9)
Referring Equation 8 and Equation 9, it can be seen that the actual voltage drop for 50 sq mm, Aluminum cable is less than permissible voltage drop .Hence 50 sq mm, PVC, Aluminum cable is suitable for circuit no.1which is already installed at Dinanath industry.
Table7. Load calculation For Power Circuit 2
Sr. no. Name of Machine/ Equipment Quantity Capacity and Motors installed
1 Grinder 4 4.6KW(each)
2 Drilling 4 2.2 KW(each)
Total 8 45.49 KW
Actual load of circuit no.2 = 45.49 x 0.75 (Refer equation 7)= 34.11 kW
Length of power circuit no.2 = 38meters (measured).The full load current for this circuit is at 440V, 0.899 power factor will be,I = (34.11 x 1000) /(√3 x440x0.899) = 49.78 A. Now we can select 35 sq mm, 1100V, PVC, 3.5 coreAluminum cable Havells [5]. Its current carrying capacity is 130 amperes and resistance per kilometer is 0.320 ohms at 20 ◦c
Therefore,
The resistance of 38 meter length cable = (0.320x 38)/1000
R = 0.01216 ohms
The permissible voltage drop = (440x5)/100 = 22V (10)
Actual voltage drop in cable of circuit no.2 =√3 × I R =√3 x 49.78 x0.01216= 1.048 V (11)
Referring Equation 10 and Equation11, It can be seen that the actual voltage drop for 35 sq mm, Aluminum cable is less than permissible voltage drop. Hence 35 sq mm, PVC, Aluminum cable is suitable for circuit no.2 which is already installed at Dinanath industry.
V. SUGGESTION AND ECOS FOR AUDIT PHASE-II& III
(i) Referring Table 9, it can be seen that the all over sized motors must be replaced by energy efficient motors for maintain power factor high.
(ii) Referring Fig.3, the maximum electrical energy consumed by traditional welding sets(64%) and also they operates at 0.6 lagging p.f. hence they must be replaced by the 300 Amp IGBT inverter welding sets for maintain p.f. (iii) Referring Fig.4, it is advice to industry to reduce their contract demand and billing demand so that the tariff charged by RVVNL will be reduced.
(iv) Referring equation 4, to improve power factor from 0.899 to 0.95 the additional capacitor bank of 30 kVAr (APFC) should be connected across the load
(v) The average surcharge of Rs.23091.37 as per Table 8 can be eliminated in electricity bill by adopting above mentioned suggestions.
AUDIT PHASE-III
(i) Implement ECOs suggested in Table 7.
(iv) Also the additional APFC or capacitor bank has been installed in factory.
CALCULATION OF PAYBACK PERIOD FOR IMPLEMENTATION OF ECOS The total investment on hardware shown in Table 12
Table 12. Investment on Hardware
S.no Hardware to be installed with specification Rate in Rs Qty Cost in Rs a Electronic ballast,40W, 230 V, Phillips. 200 18 3600 b Capacitor bank(APFC),30KVAr 48000 1 48000 c Annual interest and depreciation on cap.
installation
15%per annum 7200
d Investment 58800
(I) Annual energy savings (due to replacement of ballast)
= [18 (T.L) x36(W) x08(hr) x365(d) x7.5 (Rs/Kwh)] / 1000 = Rs 14191.2 where, T.L = tube lights
W = wattage of each traditional chokes hr = no. of hours in a day
d = total no. of days in a year Rs/Kwh = rate of each unit
(II) Average annual saving in power factor surcharge= 2274.121x 12(months) =Rs 27289.452
(III) Income from selling of old traditional chokes= 18x @Rs50 = Rs 900
Total investment will be = Total investment on hardware (as per Table 12) - Income from selling old Chokes
= [58800-900]
Total investment = Rs 57900 (12)
Net savings will be = (I) + (II)
Net savings = [14191.2 +27289.452] =Rs 41480.652 (13)
We know that Payback period in year will be given as
Referring Equation12 and Equation13
Total annual investment = Rs 57900
Net annual savings = Rs 41480.652
Therefore the Payback period will be = 57900/41480.652 = 1.3958 Years
Payback period in months= 1.3958 x 12=16.75 =Rs 17
VI. CONCLUSION
is solely dependent upon the decision of the management of the factory. Several ECOs that are cost saving are not often implemented due to lack of internal funding such as installation of IGBT welding sets.
REFERENCES
[1] Mehulkumar J Panchal,VedVyasDwivedi and RajendraAparnathi ―The Case study of Energy Conservation and Audit in Industry Sector‖ International Journal Of Engineering And Computer Science,Vol.3, Issue, pp 5298-5303,April,2014. K. M. Passino, “Biomimicry of bacterial foraging for distributed optimization,” IEEE Control Systems Magazine, vol. 22, no. 3, pp. 52-67, 2002.
[2] UmeshRathore, A reference book ―Energy Management‖ published by S.K.kataria and Sons.
[3] PutriZalilaYaacob and Abdullah AsuhainiMohd.ZinElectical, Energy management in Small and Medium Size Industries‖ Proceedings of Conference on Computer, Communication, Control and Power Engineering, Vol.5, Bgijng, China, pp 379-382, October,1993. H. Khalife, N. Malouch, S. Fdida, “Multihop cognitive radio networks: to route or not to route,” IEEE Network, vol. 23, no. 4, pp. 20-25, 2009.
[4] Jaipur Discom,Tariff for supply of Electricity-2012,designed and produced by Jaipur VidyutVitran Nigam Limited.P. K. Visscher, “How Self-Organization Evolves,” Nature, vol. 421, pp. 799–800 Feb.2003.
[5] http://www.havells.comQ. Wang, H. Zheng, “Route and spectrum selection in dynamic spectrum networks,” in Proc. IEEE CCNC 2006, pp. 625-629, Feb. 2006.
[6] S.L Uppal, A reference book ―Electrical wiring and estimating costing‖ by Khanna publishers, Delhi-6.H. Khalife, N. Malouch, S. Fdida, “Multihop cognitive radio networks: to route or not to route,” IEEE Network, vol. 23, no. 4, pp. 20-25, 2009.