User-Driven Modelling: Visualisation and Systematic
Interaction for end-user programming
Peter Hale, Anthony E Solomonides, Ian Beeson Corresponding Author - Peter Hale
Email - [email protected]
Room 3P31
University of the West of England Frenchay Campus
Coldharbour Lane Bristol
BS16 1QY United Kingdom
Telephone - (00) 44 117 965 6261 83279 Fax - (00) 44 117 965 6261 82587
Abstract
This research examines enabling computer literate engineers to model problems in software by
1. Introduction
The research question to be answered is - ‘To what extent is it possible to improve user-driven collaborative software development through interaction with diagrams and without requiring people to learn computer languages?’
The research involves step by step translation from visualised ontology, through modelling system output to interactive visualisations. These can be tree/graph, spreadsheet, or CAD type view, depending on what is most appropriate. A further alternative is providing translations into computer languages and meta-languages. The translation and output uses Semantic Web standards to ensure wide applicability. This translation approach is the core aspect of User-Driven Modelling/Programming and is intended to ease problems of software development, and so enable wider participation in modelling and programming. The research eases problems of maintenance, extensibility, ease of use, and sharing of information.
This research involves enabling computer literate people who are not programmers to create software. This section 1 introduction argues the need for this.
The aim is to enable programming without requiring people to learn computer languages so a wider range of people can collaborate on development of computer models.
This aim of creating a modelling system that can be edited by computer literate
non-programmers is split into objectives for solving problems of Maintenance, Extensibility, Ease of Use, and Sharing of Information. These objectives are described in section 3.
Section 4 examines the research method used for providing the means for meeting the above objectives.
Section 5 explains development of the methodology for User-Driven Modelling/Programming.
The methodology and implementation demonstrate an application of end-user programming that could be used in a generic way. This was the aim but it must be admitted that unexpected limitations were found relating to problems that do not fit a tree/graph based description. This will be discussed in section 6. The implementation is described in section 7.
Sections 8 and 9 discuss results, future work and areas of application.
1.1 Diagrammatic Reasoning
The theory is that it is possible to create systematic diagrams to represent user’s wishes to computers. Peirce [1] proclaimed in 1906, “Come on, my Reader, and let us construct a diagram to illustrate the general course of thought; I mean a system of diagrammatization by means of which any course of thought can be represented with exactitude”. Perhaps use of new technologies can solve this old problem. To limit scope and so make application of this theory testable, the research is restricted mainly to engineers (because they often think in terms of diagrams) and to the domain of modelling (which often requires diagrams). Others can expand it for different domains and users. Crapo et al. [2] assert the need for a methodology for creation of systems to enable collaborative modelling by domain expert end-users; this combined with visualisation would allow engineers to model problems accurately. The research outlined in this paper involves enabling users (engineers) to model manufacturing and design problems. Collaborative tools are created to allow users to develop software in a way familiar from use of
spreadsheets. This research could then enable a larger range of software users to model problems.
use in product data structures of breaking a large complex structure down into linked
parts/components/attributes, by means of a tree structure. This can aid maintenance, and in order to further aid maintenance, and ease of use, extensibility, and re-use it is proposed that the whole structure is made editable by the engineers/modellers themselves. So the empowerment of end users to be modellers/ programmers is not just a worthy aim, but an essential part of making this approach feasible, and different from previous approaches of enabling users to customise the front end, and parts of programs only.
1.2. User-Driven Modelling
In order to model a problem and enable editing of the whole structure, this structure must be clear in showing the various complex linked parts of it, so any person knows what is in their role and interest to maintain and/or amend.
Scaffidi [3] explains that computer literate people who do not have time to learn or access programming tools nevertheless try to accomplish programming tasks, so instead, they model problems using
spreadsheets (Scanlan et al. [4]). Erwig et al. [5] examine worries about the error rate in spreadsheets - “Given the billions of spreadsheets in use, this leaves the worlds of business and finance horribly vulnerable to programming mistakes”. There are solutions available; Erwig et al. have produced a spreadsheet add-on that can be used to improve spreadsheet accuracy. Erwig et al.’s research has influenced the research explained in this paper towards examining an aspect of end-user
programming/modelling, investigating both improvements to and alternatives to spreadsheet modelling for this kind of computer literate end-user programmer/modeller.
So such an approach scales the same as a spreadsheet, due to using the same approach of linking
formulae, but has the advantage of visualising the connections to show the overall structure. The decision support system used stores the structure in the same range of formats as spreadsheets (plus other Semantic Web languages were enabled via translation code), and can render the whole structure by only showing a screenfull of the tree at a time, as necessary. So the system can handle many thousands of nodes, but scales better than spreadsheets for human understanding as the nodes and navigation structure are more visible
This research examines an aspect of end-user programming/modelling, investigating both linked
improvements to and alternatives to /or modelling for this kind of computer literate end-user programmer/ modeller. This takes further the end-user programming aspect of spreadsheets and similar tools, to enable easier manipulation of the kind of complex information often held and managed in spreadsheets. An approach based on diagrammatic visualisation of models is employed to enable navigation and
communication of models. This allows models consisting of equations to be navigated by following a tree of relationships between items and between models. This makes collaboration easier by ensuring people can navigate and interpret models created by others. To further understanding of the structure and relationships these are stored in a visualised ontology, different types of information are colour coded for decision support, and this is then visualised via open standard Semantic Web languages made visible via web based visualisations.
Uschold states that “there is nothing inherently good about being further along the semantic continuum. In some cases there will be advantages; in other cases there will not. What is good is what works.” Ciocoiu et al. [10] and Horrocks [11] consider the advantages of moving towards a more formal ontology. This is in contrast to Uschold’s argument of only moving to more formal ontologies as necessary, however, this is merely a difference of emphasis as Horrocks argues for their theoretical importance, while Uschold is examining practical difficulties of finding and managing information for formal ontologies.
This research involves translating between these layers and their representations to enable User-Driven Modelling/Programming (UDM/P). The research builds this translation methodology and implements it in order to enable knowledge gathering, modelling, and visualisation. The implementation is developed using examples ranging from visualisation and calculation of the area of a rectangle, to the modelling and costing of complex processes, and the visualisation of component design. The visualisation and tree will often contain different types of information, the source tree keeps these separate, but for decision support these are linked and merged, e.g. a process may apply to a product and a material be used in the product (3 different sub-trees, all linked). The colour coding shows and clarifies when this happens, and why. This aids decision making, and makes errors more visible.
1.3. Knowledge Gathering and Visualisation
instructions for others, Cheung et al. [15] also make this point. Eng and Salustri [12] refer to a dimension from ‘tacit’ to ‘articulatable’ knowledge. Naeve [16] argues that where knowledge is tacit it is vital to keep track of the individuals or groups who have this tacit knowledge, and that also the ‘Human Semantic Web’ can help elevate tacit knowledge to explicit. This problem of tacit knowledge highlights the difficulty of getting information into a knowledge base when it may be either only in individual’s minds, or completely unstructured. The structure needs to be developed step by step with involvement of all interested parties.
2 Research Aim
The aim is to answer this question - ‘To what extent is it possible to improve user-driven collaborative software development through interaction with diagrams and without requiring people to learn computer languages?’. This could then enable better and more adaptable modelling. So the application area is for modelling/programming for computer literate end-users, and to achieve this, visual diagrammatic programming will be developed. This provides for a diagrammatic way of visualising and editing the kind of models often represented by end-user programmers in spreadsheets. The direct translation and use of the ontology for widely accessible collaborative modelling and decision support is aimed at ensuring its maintenance by demonstrating its usefulness in solving practical problems.
3. Research Objectives
3.1. Maintenance
Maintenance of models and modelling systems will be improved by
:- Stepped translation process consisting of Step 1 Ontology creation, Step 2 Translation and Modelling, Step 3 Translation and Visualisation (modelling is possible at all stages).
Minimising the amount of code necessary to create a model, and structuring the model so all connections can be seen.
3.2. Extensibility
Extensibility will also be improved by the above means to enable understanding of a model and so allow easier re-use. A clear structure and visualisation can be edited with fewer worries about unintended consequences. This is achieved by enabling system developers, model builders and users to modify the ontology, translation/modelling capability, and visualisation. This is the three-step translation process for User-Driven Modelling/Programming (UDM/P). People could make changes to whichever step is most appropriate depending on the task they are performing and their interests and preferences.
3.3. Ease of Use
Maximising accessibility is important for ease of use and vice versa, use of open standards helps achieve this, together with enabling models to run on software and systems that people are familiar with. Ease of use should be facilitated by improving model structure. Clear structuring and visualisation of information also assists in making a modelling system easier to use.
3.4. Sharing of Information
Maintenance, extensibility and ease of use are key drivers for sharing information. Achievement of objectives in these areas would enable collaboration. Ontologies are used as a way of representing explicit and implicit knowledge. This is visualised as a taxonomy view of the ontology information.
3.5. Measurement
4. Research Method
The approach builds on work undertaken for Rolls-Royce aerospace to allow designers and manufacturers to visualise and share cost information (Scanlan et al. [4]). This was part of the Rolls-Royce supported DATUM (Design Analysis Tool for Unit-cost Modelling) project to develop modelling capabilities for costing early stage design. During this project, tree representations of information requested by users were produced. Information held in relational databases was visualised and exported in structured languages.
For this research, a high level visual interface is used to create a meta-program, which can communicate wishes of users. This must be achieved in a way that enables translation and interoperability between applications. Ciocoiu et al. [10] make the point that as it becomes necessary to translate between more systems, the number of paths for translation increases exponentially. To improve interoperability, it is therefore necessary to provide either a translator or multiple translators, and the translators would be based on taxonomies/ontologies. Ciocoiu et al. write “One of the major problems facing enterprises today is the lack of interoperability among the various software applications that the enterprise uses.” They also mention that ontology tools could assist with concurrent engineering and design. Ciocoiu et al. explain how an engineering ontology can be made more rigorous in order to facilitate interoperability. Zhao and Liu [17] examine mapping of STEP representations to ontology languages OWL and SWRL and how this benefits interoperability. To improve interoperability, it is therefore necessary to provide a translator based on intermediate representation(s). Cheung et al. [15] assert the necessity for collaboration tools to support early stage product development within networked enterprises. They point out that any
providing a web based modelling and simulation environment as a product of translation from an ontology.
Frankel et al. [18] explain the opportunities for, and importance of model-driven programming using Semantic Web techniques. Berners-Lee and Fischetti [19] declare, “The Semantic Web, like the Web already, will make many things previously impossible just obvious. Visual Semantic Web programming is one of those obvious things.” Use of Semantic Web languages as programming languages assists with interoperability as these languages are standardised for use in a wide range of computer systems (as explained by Berners-Lee and Fischetti). They write, “The advantage of putting the rules in RDF is that in doing so, all the reasoning is exposed, whereas a program is a black box: you don’t see what happens inside it.” So this approach assists with easing problems of maintenance, extensibility, ease of use and sharing of information, by improving structuring, interoperability, and visibility of information.
5. Development of User-Driven Modelling/Programming Methodology
5.1. Ontology to Model/Program Translation
process. The authors explain that users prefer usability over automation, and that users should drive the more difficult tasks where they are needed and leave routine tasks to the system.
Ontologies can be made editable for maintenance and extension, and modelling tools based on ontologies can provide a structured system for building and editing of models. Miller and Baramidze [22] establish that for a “simulation study that includes model building, scenario creation, model execution, output analysis and saving/interpreting results. Ontologies can be useful during all of these phases.” Translation between these phases enables translation between levels of abstraction, and therefore from human to computer and back.
Lieberman [23] asks “Why is it so much harder to program a computer than simply to use a computer application? I can’t think of any good reason why this is so; we just happen to have a tradition of arcane programming languages and mystically complex software development techniques. We can do much better.” Paternò [24] outlines research that identifies abstraction levels for a software system. These levels are ‘task and object model’, ‘abstract user interface’, ‘concrete user interface’, and ‘final user interface’. This is important in enabling end-user programming, such as for engineers to model problems and create programs at a high level of abstraction. Stages take development through to a user interface that consists of interaction objects. This approach can be used for automating the design of the user interface and the production of the underlying software. Paternò states that “One fundamental challenge for the coming years is to develop environments that allow people without a particular background in programming to develop their own applications.” Huhns [25] argues that current programming techniques are inadequate, and outlines a technique called Interaction-Oriented Software Development, concluding that there should be a direct association between users and software, so that they can create programs, in the same way as web pages are created today. This enables distributed constructionism expounded by Resnick [26] as “the idea that people construct new knowledge with particular effectiveness when they are engaged in
emphasizes that if programming is left only to programmers rather than allowing domain experts to be involved, the program becomes a ‘black box’ and the domain expert cannot trust or verify the results. Begel also explains that text based computer languages are often too obscure for end-user programmers.
These problems of software languages being a black box and the obscurity of some text based
programming language semantics were mentioned repeatedly by engineers during this research. So it was judged necessary to visualise software language semantics and translate these into appropriate
representations.
Design of a translation system to enable domain experts to create models/programs is illustrated in 5.2. Because it is difficult to anticipate future uses and problems with software, an approach of meta-design to build systems for building systems is used in this research. This is what is different from existing approaches which allow customization, rather than complete creation of systems/programs/models by end-users.
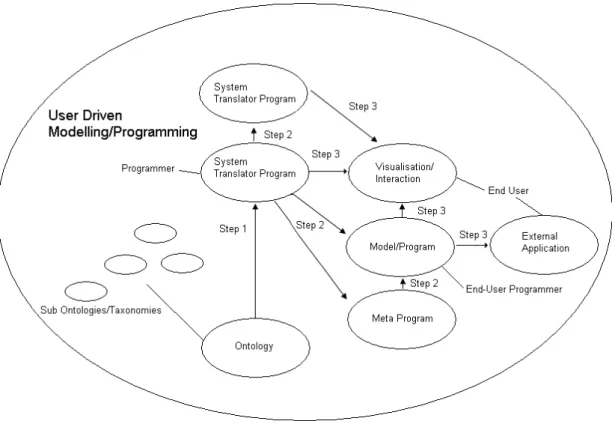
5.2. Translation for User-Driven Modelling/Programming
Figure 1. Translation Process for User-Driven Modelling/Programming (UDM/P)
A problem here is that there are so many possible translations, any of these systems could be linked to any other. This makes it potentially a complex and powerful system. The 2 main limitations so far are that
:- Note the arrows only point one way, theoretically translations could be made in either direction and both.
The arrows represent translations prototyped, and even these have not been fully developed. To fully enable diagrammatic modelling/programming, all systems would need to be linked, and in both directions.
makes it possible for engineers to use a familiar interface. The intention of research into User-Driven Modelling (UDM), and more widely User-Driven Programming (UDP), is to enable non-programmers to create software from a user interface that allows them to model a particular problem or scenario. The information entered in diagrams is translated to appropriate code.
6.1. Translation
Translation capabilities are provided to enable better communication between computer systems and humans. This allows visualisation of chains of equations, which are common in cost modelling. This visualisation enables people to add and manage information in large models, and identify cost
information. A cost modelling example is used, but this work is relevant to process modelling in general. To model complex problems a structured approach is needed for representing explicit and implicit knowledge. A translation will be provided in 3 steps that enable system developers to develop an end-user programming tool for model builders to produce models for end-user modellers.
Step 1 Ontology and System Translator
Step 2 Modelling Tool and System Translator
Step 3 Interactive Visualisation
Step 3 visualises results and enables interaction with the information to establish the meaning of the results. The translation uses Semantic Web standards to enable widespread applicability and ensure this is a generic solution. The visualisation and interactions can be tree/graph-based, spreadsheet type, and CAD style as necessary. Another option is translation to programming or Meta-programming languages so the information can be re-used by developers who are creating systems with these languages.
The research has been applied mainly to aerospace cost modelling. Cost models have been constructed from information chosen by users through an interface that interacts with users to establish what
effective production of generic models. Here though there was a problem in that the team’s focus on design and manufacturing engineering problems led us to consider this technique applied to engineering modelling in general. But in practice the approach used a tree based structure, and though this can be translated to a CAD style representation, it is not led by that kind of diagram. It is even less suitable for finite element analysis, and does not seem useful for fluid dynamics, for which linking of many equations does not obviously help. Expanding into business process modelling, and scientific taxonomy
management led to missing of these problems with engineering modelling. A further weakness was inability to model equations which have feedback loops between either side of the equals sign, such as many economic modelling equations.
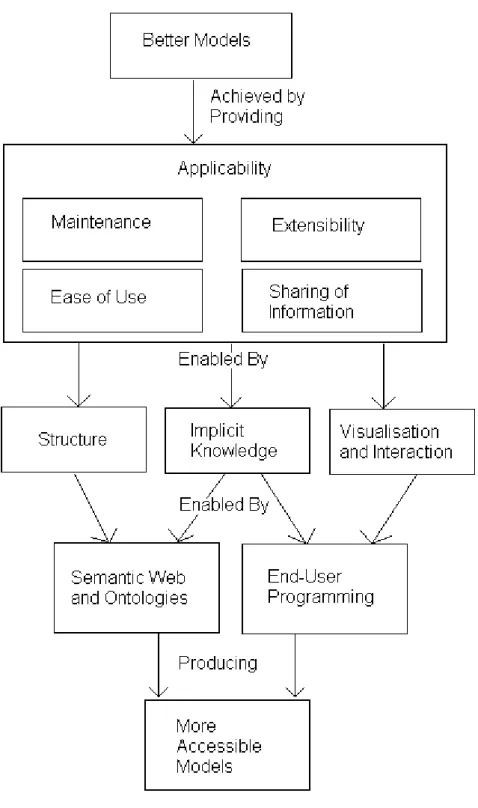
Figure 2. Objectives and Methodology to aid better modelling
data structures’, and methods for representing items and equations that relate them can be expressed in standard mathematical form. Therefore, using the same methodology and categories it would be possible to represent other items and equations the same way. So this methodology is reusable for costing other engineering components outside aerospace. The costing method is recursive because components and sub components can be costed separately or together and top down or bottom up. This methodology has potential for application to calculation based modelling problem (subject to the exceptions above).
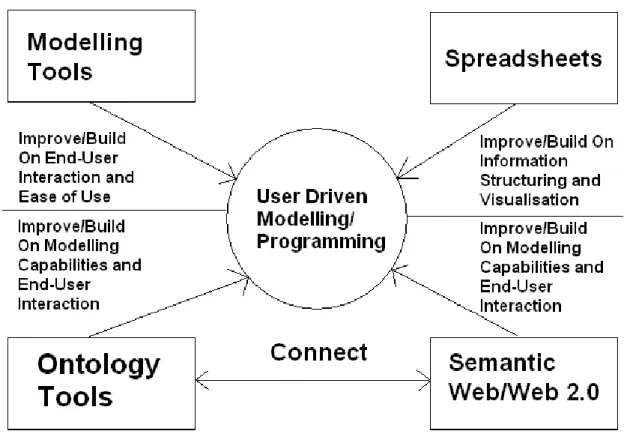
UDM/P has the advantage of using a modelling approach for creating modelling solutions and involves creating systems to create systems. This makes it possible to solve problems by breaking them down into stages and allowing software developers to concentrate on system complexity, and domain experts to be able to concentrate on their domain problem. Standardisation can allow software developers to create modelling systems for generic purposes, then domain experts customise this to model their domain. This methodology can be facilitated by
:- Modelling Tools - Building an end-user interface and extending the translation capabilities of UML and/or other modelling tools (Johnson [29]).
Spreadsheets - Improving the structuring and collaboration capabilities of spreadsheets, and enabling customisation of spreadsheet templates for particular domains and users.
Ontology Tools - Extending the modelling capabilities and equation calculations in ontology tools and providing an end-user interface.
Semantic Web/Web 2.0 - Extending the capabilities of Semantic Web and Web 2.0 development tools to allow collaborative modelling.
Figure 3. Methodology Diagram - Enabling User-Driven Modelling/Programming
6.2. System Developed
6.21. Translation Design
Bishop [30] explains current problems “The current practice is for GUIs to be specified by creating objects, calling methods to place them in the correct places in a window, and then linking them to code that will process any actions required. If hand-coded, such a process is tedious and error-prone; if a builder or designer program is used, hundreds of lines of code are generated and incorporated into one’s program, often labeled ‘do not touch’. Either approach violates the software engineering principles of efficiency and maintainability.” Bishop investigates, evaluates and advocates the use of platform independent programming languages, including the use of meta and declarative languages. Current practice leads to the problems of Maintenance, Extensibility Ease of Use and Sharing of Information explained in this research, as described in section 3.
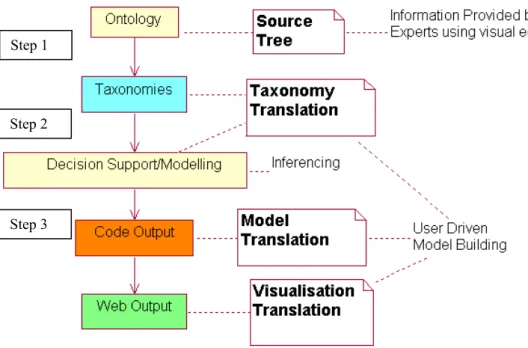
Figure 4. Translation Process Design
This involves a stepped translation from a source tree, through visualisation, interaction and model calculation, to a result tree, each are the model/program itself, processed, and visualised in different ways. The result tree can be code and/or Semantic Web output. The result tree/model is a more specific subset of the source tree/model. In all cases the semantics are constant, only the syntax changes, as necessary for the tool used to visualise this.
6.22. Translation Implementation
Steps 1, 2 and 3 are demonstrated with examples from the implementation in section 7.
The result model can be represented diagrammatically or as categorized and linked web pages. The translation is
:-Source Model (Human Friendly Representation) :-Source Model (Computer Friendly
Representation) Computer Program Result Model (Human Friendly Representation)
If users can define the source model, remain largely unaware of how the result model is produced, understand the result model, and it meet their expectations, the translation will be successful. Decisions a user makes can affect both the content and presentation style of the results received.
Step 2
The system created consists of applications combined in order to represent a layered architecture of
:-Ontology/Database Ontology Engine Ontology Visualiser Calculation Engine Inputs
Visualiser Results Visualiser
:-Figure 5. Automated Copying to new system
This recursion allows for mixing of different types of information in a result tree branch. If for example a component uses a process and a material, a branch will be created and recursed to represent this. The ‘uses’ link is represented by the presence of that process and material in the equation for that component rather than as a named relationship. A small section from an example of this recursive translation is shown in the section 7 - Implementation. It is not practical to show the whole tree, but the tree can be and is large for wingbox components. In general a product with say 10 components, using 10 processes each, and 10 materials for each, for example, creates a large tree due to that geometric growth.
The solution can be used by different model builders for diverse problems. As well as outputting programs the system can produce meta-code or Semantic Web language code, and this enables future research for translating the output meta-program into generic software.Sothis elaborator/de-abstractor outputs code, in various computer languages. This enables domain experts to develop structured models. These models can be translated from a high level representation to a computer language or a Meta-programming syntax such as MetaL (Lemos [31]). The elaborator needs only a few pieces of information. All information other than that dependant on user interaction, including names of each node and
to this ontology is required so model builders can maintain and extend it. The interface and model linking can follow a structure as used for web networks and RDF.
Each node (elaborator) needs to be provided with the following pieces of information
:-1) A trigger sent as a result of user action. This is a variable containing a list of value(s) dependant on decisions or requests made by the user. Each time the user makes a request or a decision; this causes the production of a tree or branch to represent it. This trigger variable is passed around the tree or branch. The interface to enable this is connected to and reads from the ontology (via the number codes).
2) Knowledge of the relationship between each node and its immediate siblings e.g. parents, children, attributes. So the elaborator knows which other elaborators to send information to, or receive from. (E.g. via the number codes).
3) Ability to read equations. These are mathematical descriptions of a calculation containing terms that are items in the ontology. Each equation is contained within an attribute of a class, e.g. the class ‘Material Cost’ has an attribute ‘Material Cost Calculation’ that holds an equation. The equations define the tree.
4) Rules of syntax for the language of code to be output.
The way the elaborator finds the information held in 2 and 3 is dependent on the action taken in 1. Thus, if a suitable ontology is created, the basis of rules of construction of the code to be created are defined 4, and the user has made choices, the user needs to take no further action and the necessary code will be output.
automatically created and dynamically write objects. This allows the wing definition to be translated to the decision support system for costing and then to other software for further processing and visualisation. An open standard semantic editor Protégé [34] was used to structure an ontology. This ontology holds the definitions of nodes representing information, and calculations to be performed. Sub
ontologies/taxonomies were created in Protégé for ‘Parts’, ‘Materials’, ‘Consumables’, ‘Processes’, ‘Rates’, and ‘Tooling’ for the prototype costing system. New categories can be produced as required. Domain experts would edit taxonomies and specify the relationships of classes and equations via a visual user interface. These relationships are evaluated and translated to produce code. Fig. 6. illustrates how code is produced from the semantic relationships.
Figure 6. Translation Process Implementation
The result model can be used as it is, or be a template/system translator for generation of further models (repeat of step 2). The translation uses Program Transformation, which enables writing in one
representation or language, and translating to another. Lieberman [23] advocates this approach to enable automation of software production; this is useful for language independent systematic information representation. He argues for program transformation in order that people can become end-user software engineers without even realizing it. Lieberman also argues that HCI experts have concentrated on ease of use and should examine ease of programming. The program transformation approach argued for by
Step 1
Step 2
Lieberman is used in this research to translate from a domain expert end-user programmer abstraction to models represented by Semantic Web languages, ontologies and code.
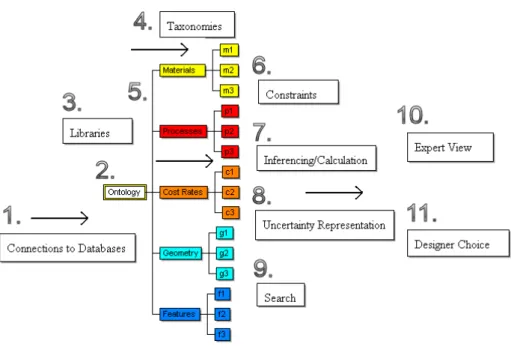
Use of Semantic Web technologies is a means for open standard representation of collaborative models, transformation into different representations as required, and for provision of a high-level interface for model visualisation and system creation. This enables application of distributed constructionism explained by Resnick [26], allowing people to learn from building and sharing models. The outputs are made available on the web (in step 3), as this is accessible and allows for distributed visualisation, interaction, and co-operation to enable new insights. The translator converts between representations of the problem appropriate to different people and subject matter, and is customisable by users. Translations are performed into programming and meta-programming languages and open standard information representation languages. Fig. 7. shows the methodology behind the Semantic Web modelling, and explains the prototyped Semantic modelling process, at all stages from ontology to results visualisation.
Figure 7. User-Driven Modelling/Programming UDM/P System
3. Libraries are created in partnership with domain experts.
4. Taxonomies are populated by model builders and used for their modelling problems. These are based on the libraries created in 3.
5. Taxonomies are colour coded for ease of understanding. A link is created between the ontology and a decision support and calculation tool, which reads information from the ontology tool.
6. Constraints can make it easier for users to build and adapt models, such as constraints on the way the ontology and models are built, and user interface constraints to reduce the scope for error.
7. Colour coding makes calculation clearer by showing which taxonomy/sub-ontology each node is from, this produces a multicoloured result tree/graph that represents the entire calculation history. User choices affect how items are related for the calculation; choices can be made manually or via a search.
8. Each node can also represent uncertainty for use in calculations.
9. The result tree can be represented on the web and in other programs; this enables further searching, processing and evaluation of results. Visualisation techniques and the use of searchable languages such as XML, and SVG (Scalable Vector Graphics) can assist in this.
10. and 11. Experts can interact with the ontology, model, and results, there is a two way feedback mechanism where experts can make changes at any stage, and this filters into changed results. This supports a cycle of results and rework.
Visualisation is important for transformation to the result model, enabling users to interact with the models and results of any calculations. The elaborator (de abstractor) needs to follow the ontology to establish how related concepts represented visually can be represented in equivalent code. The
visualisation can be as either colour coded tree or interactive SVG diagram of the component modelled. Letondal [35] researches this problem and makes similar conclusions about a graphical programming methodology for objects :-
“1. Their "content" may be defined by a formula,
3. Their graphical components are accessible as program objects
4. Graphical attributes may be defined to implement visualization functions”
6.3. Survey - Usability Evaluation
A survey of 97 people was conducted focused on the prototype implementations. This supplemented the feedback obtained from Airbus and Rolls-Royce. This survey was conducted in order to determine what kind of diagrammatic interface might be most appropriate. Extensive consultation with engineers at Airbus and Rolls-Royce helped establish the possible interfaces that needed evaluating, as these interfaces were useful to and understood by these engineers. These possible interfaces were taxonomy, CAD style diagrammatic, flow chart (or activity diagram), UML style (entity relationship). Which was preferred depended partly on the skills and type of work of the engineers, and others surveyed, and on the type of problem to be modelled/programmed
:-Which would you consider yourself to be?
answered question 93
skipped question 4
An End-User (anyone else, familiar with computers but not in categories below) - 29.0% - 27
An Experienced Developer - 28.0% - 26
A Researcher - 32.3% - 30
Other (please specify) - 10.8% - 10
Taxonomy (tree view) - 26.9% - 21
Diagrammatic - 37.2% - 29
Flow Chart - 37.2% - 29
Unified Modeling Language (UML) - 14.1% - 11
Other (please specify) - 12.8% - 10
Which example Program have you used?
answered question 81
skipped question 16
Taxonomy viewer - http://www.cems.uwe.ac.uk/~phale/ELearning/ELearningDemonstration1.htm
- 17.3% - 14
Diagrammatic Viewer - http://www.cems.uwe.ac.uk/~phale/ELearning/ELearningDemonstration2.htm
- 17.3% - 14
Neither - 43.2% - 35
Both - 22.2% - 18
Which example interface do you prefer?
answered question 75
skipped question 22
Diagrammatic Viewer - http://www.cems.uwe.ac.uk/~phale/ELearning/ELearningDemonstration2.htm
- 17.3% - 13
Neither - 9.3% - 7
Both - 13.3% - 10
No opinion - 33.3% - 25
As a result of all the feedback from engineers and others, the main problem needing to be tackled is provision of a system that moves this theoretical and prototyped work on to a fully fledged end-user modelling system, available and usable by a wide range of people.
7. Implementation
Section 7 describes the implementation of the User Driven Modelling/Programming theory outlined in section 1 where Semantic Web/Ontologies/End User Programming, and Modelling overlap, then developed in section 3, 4 and 5, and prototyped in section 6. This is in order to ease problems of Maintenance, Extensibility, Ease of Use, and Sharing of Information. The prototype was developed in order to provide a system that could be used for modelling a complex system that is liable to be changed. To develop and implement a User Driven Modelling/Programming approach an ontology was required, a way to visualise and edit this, and a translation so the model based on the ontology could be automatically updated in step with the ontology developed.
the spreadsheet and the alternative examples are based on representation of wing components. Spar and associated processes are shown; Ribs, Skins, and Stringers were also modelled.
7.1. Spreadsheet Example
A spreadsheet was first created to represent design and manufacture costs for these components. The approach of developing decision support models for design and costing, using a spreadsheet is evaluated. It is argued that this approach is insufficient for providing generic and reusable models.
Because of the difficulties applying parametric costing methods to new technologies, the ACCS (Aerospace Composite Costing System) project was undertaken to create software for the purpose of costing a product where parametric costing was not viable. Airbus specified that this should be a short project to enable costing the manufacture of a composite wingbox, and that a spreadsheet must be used for this because of the wide availability of this application within Airbus.
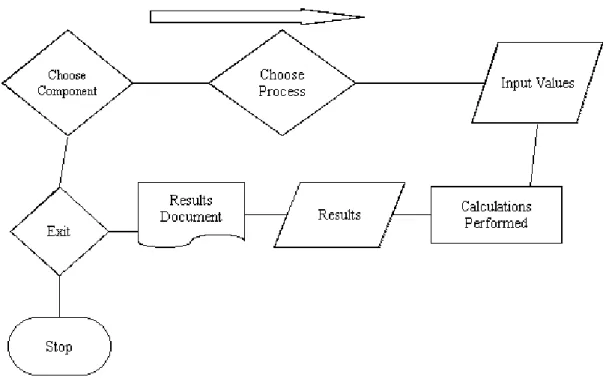
The ACCS spreadsheet model begins by providing the user with a choice of component to cost. Diagrams of generic wingbox components were provided to visualise the general shape and use of these
Figure 8. ACCS spreadsheet model navigation
The spreadsheet needed to be split into 3 related modules for overall navigation, component definition, and process definition. Each of these modules contained large amounts of code to respond to decisions and events. This reduced the overall size and complexity of the spreadsheet by ensuring values were entered only as necessary in the right place and in the right order to ensure the calculations made sense at all stages of the users’ interaction with the spreadsheet model. This certainly assisted with the
re-use rather than use, and difficulties with extensibility, and maintenance that limit spreadsheets for this complexity and variety of modelling problems.
7.11 Improving and Building On Information Structuring and
Visualisation
It is particularly important to target modelling that is too complex for use of spreadsheets, and to enable sharing of information via an ontology. To achieve this it is necessary to tackle difficulties in maintaining, extending, and reusing spreadsheet type models. This research examined possibilities for visual
modelling/programming extensions to spreadsheet type formulae based modelling. The research involved examining ways for improving the structuring and visualisation capabilities of spreadsheets to aid collaboration. So extensions were tested with examples for web based spreadsheet collaboration and other kinds of visualisation and collaboration. The examples shown next demonstrate building of a
collaborative system that visualise formula in each of 3 translation steps. This is an implementation of the methodology demonstrated in Fig. 3. in section 6.1. So the modelling capabilities of spreadsheets were provided by a decision support system that reads formulae from an ontology in order to aid
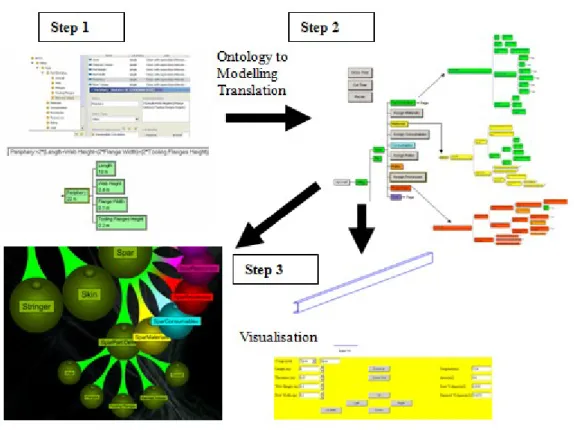
Therefore an alternative/improved approach was needed to address problems that resulted from building a complex costing system within a spreadsheet. Fig. 9. shows the translation process implementation for this alternative/improved approach.
Figure 9. Stepped Translation and Visualisation
7.2. Alternative 3 Step Translation Approach
7.21 Implementation Simple Example
This simple model explains all the implementation of translation steps. A movie demonstration of this is included on the journal website.
Figure10. Rectangle Definition in Ontology
Width is then defined as 2m.
In Fig. 11. another class is created for calculation of area.
Figure 11. Rectangle Area Attribute
In Fig. 11. ‘Area’ was assigned a value of ‘Length’ * ‘Width’. This is a simple equation that will be used to calculate the result. This illustrates how modelling calculations are performed. They are all defined by equations that relate attributes of the taxonomy/sub ontology. The taxonomy can be read by the decision support system in Step 2.
For Step 2 the decision support/modelling system reads the ontology, performs the calculation and deals with units giving the result for area as 8 metres squared. This is shown in Fig. 12.
Figure 12. Step 2 - Translation and Calculation
The modelling system can then output the results to web-based visualisations, or to program/meta-program code.
7.214 Step 3
As well as showing the model itself on the web it is possible to translate the model results into other representations and visualisations, so making it as widely accessible as practical. Fig. 13. shows the result model translated into XML and visualised as a tree view on the web. The automated menu provides for some of McGuinness [7] - 7 uses of simple ontologies
:-2. site organization and navigation support
The use and visualisation of Semantic Web languages at all stages in the translation process facilitates 6. ‘Search support’, and 7. ‘sense disambiguation support’; the structure of the ontology is visualised in order to enable users to determine the context of terms.
Figure 13. Results Output as Tree (XML based)
Figure 14. CAD type interface and User Interaction and Calculation
Section 7.4 explains the benefits of this translation process and how they are achieved.
7.3 Implementation - Cube Example
welding, or riveting, and different options for use of tooling, consumables, resources, and rates. From investigating different options, different trees are created to represent different paths/options, and from this the production cost tree is created with results and feedback on exactly what made up the
process/cost. Fig. 15. illustrates how the different sub ontologies/taxonomies are colour coded in order to ensure it is easier to read the meaning of the tree and the interrelationships between the different aspects of the model.
Figure 15. Cube model example - illustrates choice of process etc.
In this example, aluminium was chosen as the material, and riveting was chosen as the process. This example also illustrates how the Vanguard System modelling tool automatically combines units appropriately.
Figure 16. Translation to SVG Visualisation
Next the implementation of this research is illustrated with the more complex example of an aircraft wingbox, using the same approach.
need programming skills to edit the ontology (though web based ontology editing would enable wider participation).
Fig. 17. shows a Vanguard System reproduction of the part definition taxonomy (or sub-ontology) from the Protégé ontology. The Vanguard System software adds an extra functionality, which is to calculate, and store the results of equations. Code was added for this project in order to translate the Protégé tree and equations into Vanguard System to make use of this calculation facility. The equation is represented as text in the ‘Documentation’ field of the ‘Periphery’ attribute of ‘Derived Values’ as illustrated in Fig. 17. Below
:-.
Figure 17. Translation of Equation Representation from Protégé to Vanguard System
Software created by the authors within Vanguard System for Step 2 translates equations captured in the ontology to Vanguard System for calculation and display. The code to achieve this is recursive, the code recursively reads down the Protégé tree and copies each Protégé class and pastes this into Vanguard System as a Vanguard node complete with the relevant equation(s). When the node copies the equation(s) this triggers the production of the sub nodes used in the equation. Each time the code in Vanguard System reads a class it also reads the class type so that it can paste the node in the appropriate colour. Once this code finds a value rather than a replacement it moves onto the next sub-tree. Thus this code recursively moves from the root, copies each sub-tree in the appropriate colours, and repeats this until the whole tree is copied. This means the overhead of maintaining the ontology tree and all the rules is entirely within Protégé, which also manages the representation of the Semantic language such as OWL (Web Ontology Language). This Protégé to Vanguard System translation code is standardised to read for classes of design and manufacture such as parts, processes, materials, cost rates etc, and would need to be rewritten for a different type of process modelling tree such as for Business Process Modelling. The code would also need to be written differently for translation to a different modelling system, but the recursive structure of the code and the semantics would be the same for any modelling system that can model a tree, with only the syntax being different. This advantage is used in Stage 3 to translate the tree again for representation on the web in Semantic Web languages (displayed using stylesheets), or into programming languages such as Java for display as an applet. This is possible because the Protégé ontology is simply a tree that can be represented in Protégé without using the full features of OWL and thus can be translated as a tree into any language that can represent trees and equations. The equations are a standard mathematical representation so have a standard semantic representation, though the syntax needs translation to the target language.
(translations take seconds and page loads less), and is navigable. The trees created have thousands of nodes; Vanguard System visualises large trees by breaking them into individual ‘pages’ (screens), and indicating with a right arrow where further pages can be viewed. Also the similar code for further translations in step 3 enable visualisations in other ways that ease navigation of large trees such as the file manager type interaction in Fig. 19. and the hyperbolic tree illustrated in Figs 20. and 21.
7.42. Step 2 - System Translator Program
Figure 18. Spar branch automatically created from information source
The translator creates the models automatically and thousands of tree nodes per second. Vanguard System visualises these large trees by breaking them into individual pages, and indicating where further pages can be viewed. Different types of information indicated by colour coding may be combined in a calculation. Parts are coloured green, materials yellow, Rates orange, Processes red, and Costs purple, Resources (not shown here) violet. A multiple (faceted) classification is used so a child can have multiple parents, this means the tree is also a graph/network representation. A child is shown fully under its first parent and indicates with a right arrow that it has other parents. The colour coding demonstrates the way ontologies are linked into the overall ontology and each colour coded to differentiate between each
7.43. Step 3 - Interactive Visualisation
As for translation from the ontology to the decision support system, translation to other visualisations and program languages can be achieved by a translation program, which follows the tree structure and just substitutes the same semantic representation but with different code syntax for the output code.
Step 3 involved producing interactive visualisations that use different ways of visualising the same information. This was made possible by use of the ontology in Step 1 and interpretation of the ontology in Step 2. This also enabled use of colour coding to show different types of information. Colour coding could also indicate cost, time, or uncertainty (Bru et al. [36]). Sophisticated visualisation is needed as models such as the wing spreadsheet model deliver volumes of information, which cannot be easily absorbed and analysed in their textual form. Information for the visualisation is held in standard formats, thus allowing input from different systems. The information is then further translated to various formats including XML and SVG for web visualisation and information exchange. This is shown in Fig. 19. where XML is used to exchange information with a web model that colour codes this information, displays it and lets users interact with it.
Figure 19. Translated XML interactive web application
The automated translation provides an infrastructure of linked nodes and equations for web modelling. This enables Semantic Web Programming as advocated by Berners-Lee and Fischetti [19].Kuljis and Paul [37] and Miller and Baramidze [22] evaluate progress in web-based simulation; they argue the need for web-based simulations to be focussed on solving real-world problems in order to be successful. Fig. 20. demonstrates the ontology translated via Step 2 into XML for Step 3 visualisation in Flash (using visualisation by Rhodes et al. [38]). This creates a tree with a three dimensional look, colour and shading, and interactive repositioning of nodes to make it intuitive and assist in navigation. When a node is chosen, this is moved to the centre of the display and all other nodes are moved or rotated to position in relation to it.
Figure 21. Flash viewing of Spar Part Definition node
7.431. Step 3 - CAD Style Interactive Visualisation
If attributes are provided in Step 1 or 2 it is possible to translate the tree representation into a dynamic CAD type representation for Step 3. This information allows the system to draw lines to represent component attributes. These attributes can then be edited by users in interactive CAD type representations that enable visualisation of the component and its attributes. This capability can be used for enabling better understanding of a component’s attributes/properties and for modelling and calculation.
Figure 22. Interactive Spar Diagram (SVG)
7.44. Translation to Program/Meta-Program Code
Figure 23. Translation from modelling system into Java
This can also be created and visualised as a Java applet. A translation into Java based Cost Estimator System (Koonce [39]) was also created to show the system could translate readily for other applications; this is an example of translating for an external application. Translations were also made into Meta-Programming languages.
7.5. Analysis and Reflection
The User Driven Modelling based prototypes in section 7.2 to 7.4 is more effective in addressing the problems of maintenance, extensibility, ease of use, and sharing of information, than the purely spreadsheet based ACCS (Aerospace Composite Costing System) prototype of section 7.1, and so represent progress. The User Driven Modelling prototypes do satisfy the aims of improving software development through the interaction with diagrams without requiring people to learn computer languages. However, a further aim would then be to research how this could assist with collaboration in problem solving. To achieve that a new project would be required, and is proposed as future work, to amalgamate and unify the different technologies used, and develop them with others who have created high level software, Web 2.0, and Semantic Web tools. This would enable creation of a single user interface for the ontology, modelling, and web parts of the approach to simplify use of the system, and the maintenance, re-use, and extensibility of it, and enable sharing of information amongst a wider user base.
8. Discussion and Further Research
This section outlines future research on extending areas of application for UDM/P for other types of problem within engineering and for types of modelling.
8.1. Generic Modelling
necessary for creating a CAD type representation can be made available in the various categories and is necessary for production of the most accurate cost estimates. This made it possible to translate between a tree-based representation and a CAD style representation. A further advantage of this methodology was it allowed estimates at top level in the tree in early stage design, but early estimates can be developed at a later stage when more is known of the design and production processes. This makes it possible to add further detail to improve accuracy of cost modelling and/or other engineering modelling. Representing things other than engineering components merely requires different categories, so this methodology could be re-used for other modelling problems such as scientific modelling and economic modelling (except where feedback between items on either side of an equation disrupts the tree structure). This broadens to any problem that can be represented by linked equations, which can be visualised, especially if combined with Natural Language Programming (NLP) research, e.g. Mihalcea et al. [40]. Visualisation and management of information aids constructionist understanding of problems by modelling them. This methodology and approach ensures greater user involvement in model production and management. This greater user involvement is the main solution to maintenance, use, re-use and ease of understanding of large models.
User involvement is important in development of software but a domain expert does not necessarily possess expertise in software development, and a software developer cannot have expertise in every domain to which software might apply. So it is important to enable software to be created, using methods as close as possible to those which domain experts prefer. This research examined the need for and provision of the UDM/P methodology to enable computer literate engineers to model/program. Harnessing of computer literacy to allow domain experts to develop and share models increases
8.2. Ontology Development
It is important to explore how ontologies can be developed using a range of development tools and translated between each where necessary (Garcia-Castro and Gomez-Perez [32]). Creation of a formal ontology and applications to model problems such as early stage design and cost, and interactive modelling environments, will widen applicability of the research. This would enable further testing on ways ontologies can be used to solve problems, and be meaningful to people and searchable by computer software. Online tagging of this ontology could be enabled and editing of it by users to enable domain experts’ involvement in ontology construction. Richer semantic descriptions will also be used in the ontologies.
8.3. Ontology/Model Visualisation and Interaction
To encourage end-user interaction with Step 1 ontology creation it is important to make ontology editing easier. Protégé has OWL plug-ins to provide extra capabilities for representing and visualising
information (Ernst et al. [41]). Enabling web-based editing of ontologies would make ontology editing more accessible, current work includes creating an online ontology editor. Model development can be made more accessible by drag-and drop editing of nodes. Richer semantics could also simplify the editing process by reducing complexity in the user interface. SWRL (Semantic Web Rule Language combining OWL and RuleML) use in modelling will also be investigated. Miller and Baramidze [22] and Horrocks et al. [13] explain SWRL. This could allow formal construction of equations, and modelling rules and relationships and constraints between items represented in an equation. An editing facility to model these equations, and constraints so errors could be prevented, would improve usability of future visual
modelling systems.
8.4. Modelling and Simulation
syntactical representations of MathML. This should enable standardisation of representation of mathematical expressions that relate nodes and their values, expressions, and constraints. Miller and Baramidze's DEMO system uses OWL to define a simulation and modelling class hierarchy.
8.5. Meta-Programming and Rule Based Programming
Meta-Programming and Rule-based languages (Wallace [42]) could be used to develop an interface to an end-user programming environment. So far automated output of code in some languages has been provided and automated output of machine independent code such as in XML, RDF, and SVG format. Combining meta and rule-based automated interoperable code production to enable creation of modelling systems would enable models/programs to be developed and shared by domain experts more easily.
8.6. Visualisation and Taxonomy Management
Another application of these techniques is scientific visualisation and modelling based on taxonomies. In this research ontologies/taxonomies have been used to represent engineering structures. Future research could provide an interactive visual taxonomy management system for structuring, and management of complex scientific information for scientific collaboration.
8.7. Research Connectivity
This research could also be applied to E-Learning collaboration, and enabling wider participation in online communities. This is a practical application for a web-based Distributed Constructionist (Resnick [26]) approach to modelling and collaboration. Berners-Lee and Fischetti [19] also argue for collaborative interactivity, which they call ‘Intercreativity’.
Enabling people to program visually.
Creating design abstractions familiar to domain experts e.g. diagrams for engineers.
Ensuring interoperability using open standards.
Automating user to computer translation.
UDM/P was used to develop models and modelling capabilities as an alternative and/or improvement to spreadsheet development, used within an Airbus wing costing project. This alternative approach involved using open standard ontologies/taxonomies and a web interface for developing design and cost models. The stepped translation implemented and enabled structured modelling, and visualisation using interactive technologies. This translation solved problems of the spreadsheet approach as shown
:- Maintenance Improved by Structuring and Translation.
Extensibility Improved by Structuring and Visualisation.
Ease of Use Improved by Visualisation, Interaction, and Translation.
Sharing of Information Improved by Shared Ontology and Interoperability.
The 3 step translation process translates domain level modelling into open standard representation and software and vice versa.
9.11. Maintenance
ontology to models and visualisations ensures one change will affect all stages, so this makes maintenance easier.
9.12. Extensibility
The infrastructure for collaborative model building makes it quicker and easier to create further models because of facilities provided for model builders and end-users to customise the software in any one of the three step translation process. So progress was made in enabling non-programmers to build models. Use of open standards for information and models ensures a development path protected from changes in the software market and ensures the system can link with most environments. The translation and visualisation approach ensures new models can be added using the existing ontology, and design changes in the ontology and translation can enable modelling of different problems.
9.13. Ease of Use
Many are familiar with navigating on the web so translating into web applications and standardising navigation contributed to usability. Limiting functionality to only that required reduces user confusion. Web 2.0 interaction technologies have allowed production of a rich user interface for web programs in a similar way to single computer applications. This means information held in ontologies and translated through modelling tools is available as interactive applications for many users. Translation allowed the same structure of user interface to be provided in multiple tools and computer languages. Also this research showed it was possible to provide user interfaces and visualisation as appropriate according to the user, situation, or kind of information.
9.14. Sharing of Information
Structuring of information with standardised languages eased search and visualisation; thus ensuring interoperability was important for long term use of the modelling system.
9.2. Summary and Conclusion
The question examined was to what extent it was possible to improve user-driven collaborative software development through interaction with diagrams and without requiring people to learn computer
languages? The research enabled model creation with diagrammatic visualisation and formulae to avoid the need for code writing. This User-Driven Modelling/Programming (UDM/P) approach was applied to engineering modelling problems, and the test implementation proved it was usable for large models. Some work has already been completed on applying this to other problems. The main limitation was found to be its lack of applicability to problems that were not suitable to tree based representation. The approach involved a 3 step translation process, and this eased problems of maintenance, extensibility, ease of use, and sharing of information. Each step produced a diagrammatic representation for humans, and computer code.
The need for software developers to create software that enables users to solve problems was argued; this involved production of a system to create systems. This approach can widen programming participation by including computer literate non-programmers. This is a reaction to increased complexity of real world problems and software systems that make development, maintenance, and re-use of software solutions impractical without greater end-user/domain expert involvement. Enabling end-user customisation helps domain experts make changes to models as requirements change, and simplifies software development by avoiding the need to anticipate every future change.
ability to visualise, search and share information using structured languages and web applications enables creation of dynamic structured views and decision support models over the web.
This research was a test case for an approach of collaborative end-user programming by domain experts. The end-user programmers use a visual interface where the visualisation of the software matches the structure of the software, making translation between user and computer and vice versa practical. So, structured visualisations were preferred over web spreadsheets. Semantic Web languages are ideal for representing graphs and trees in an open standard way. The spatial, and tree/graph visualisations have the same underlying semantics, and therefore were translatable from and to computer languages. Semantic Web meta-languages could be used as standardised programming languages for such problems, as this would avoid the need to further translate into other programming languages, and systems. This was tested for representation of information, meta-programming, and translation to a visual display for users. This Semantic Web approach could enable users to perform high level programming, model the problem for which they are the experts, and enable collaboration to share results.
Work with industrial partners indicates that people like to develop models providing they are computer literate and confident they have domain knowledge that developers do not possess. This is true for software development in general, not just in the engineering domain. Research from others involved in end-user programming confirms this. This approach of visualising all information at all stages in translation is preferable to 'black box' solutions that hide information. This makes models more credible and manageable, and ensures wide applicability. There is scope for researchers to improve end-user programming for engineering modelling systems, and to expand this research into other areas where problems can be represented as trees/graphs.
References
[1] C.S. Peirce, Prolegomena to an Apology for Pragmaticism (1906) [online]. Available from:
http://www.existentialgraphs.com/peirceoneg/prolegomena.htm [Accessed 7th June 2012].
[2] A.W. Crapo , L.B. Waisel, W.A. Wallace, T.R. Willemain, Visualization and Modelling for Intelligent Systems, in: C. T. Leondes, (Ed.), Intelligent Systems: Technology and Applications, Volume I
Implementation Techniques, 2002 pp. 53-85.
[3] C. Scaffidi, M. Shaw, B. Myers, Estimating the Numbers of End Users and End User Programmers, in: IEEE Symposium on Visual Languages and Human-Centric Computing, (VL/HCC'05) Dallas, Texas. 2005, pp. 207-214.
[4] J. Scanlan, A. Rao, C. Bru, P. Hale, R. Marsh, DATUM Project: Cost Estimating Environment for Support of Aerospace Design Decision Making, Journal of Aircraft 43(4) (2006).
[5] M. Erwig, R. Abraham, I. Cooperstein, S. Kollmansberger, Automatic Generation and Maintenance of Correct Spreadsheets?, in: Proceedings of the 27th international conference on Software engineering, St. Louis, MO, USA, 2006 pp. 136-145.
[6] T.R. Gruber. Toward Principles for the Design of Ontologies Used for Knowledge Sharing, in: N. Guarino and R. Poli, (Ed.), Formal Ontology in conceptual Analysis and Knowledge Representation. Kluwer Academic Publishers, 1993.
[7] D.L. McGuinness, Ontologies Come of Age, in: D. Fensel, J. Hendler, H. Lieberman, W. Wahlster, (Ed.) Spinning the Semantic Web: Bringing the World Wide Web to Its Full Potential, MIT Press, 2003.
[8] T. Berners-Lee, Semantic Web on XML, (2000) [online]. Available from:
http://www.w3.org/2000/Talks/1206-xml2k-tbl/slide1-0.html [Accessed 7th June 2012].
[9] M. Uschold, Where are the semantics in the semantic web?, AI Magazine 24(3) (2003) pp. 25-36.
[11] I. Horrocks DAML+OIL: a Reason-able Web Ontology Language, in: proceedings of the Eighth Conference on Extending Database Technology (EDBT 2002) March 24-28 2002, Prague.
[12] N. Eng, F.A. Salustri "Rugplot" Visualization for Preliminary Design, in: CDEN 2006 3rd CDEN/RCCI International Design Conference University of Toronto, Ontario, Canada 2006.
[13] I. Horrocks, P.F. Patel-Schneider, F. van Harmelen, From SHIQ and RDF to OWL: The making of a web ontology language. Journal of Web Semantics 1(1) (2003) pp. 7-26.
[14] D.C. Sutton, What is knowledge and can it be managed?, European Journal of Information Systems, 10 (2001) pp. 72-79.
[15] W.M. Cheung, P.C. Matthews, J.X. Gao, P.G. Maropoulos, Advanced product development integration architecture: an out-of-box solution to support distributed production networks. International Journal of Production Research March (2007).
[16] A. Naeve, The Human Semantic Web – Shifting from Knowledge Push to Knowledge Pull. International Journal of Semantic Web and Information Systems (IJSWIS), Vol 1(3) (July-September 2005) pp 1-30.
[17] W. Zhao, J.K. Liu, OWL/SWRL representation methodology for EXPRESS-driven product information model Part I. Implementation methodology, Computers in Industry (2008) Article in Press, Corrected Proof [online]. Available from:
http://www.sciencedirect.com/science/article/pii/S0166361508000213 [Accessed 7th June 2012].
[18] D. Frankel, P. Hayes, E. Kendall, D. McGuinness, The Model Driven Semantic Web, in: 1st International Workshop on the Model-Driven Semantic Web (MDSW2004) Enabling Knowledge Representation and MDA® Technologies to Work Together, 2004.
[20] T. Kim, T. Lee, P. Fishwick, A Two Stage Modeling and Simulation Process for Web-Based Modeling and Simulation, ACM Transactions on Modeling and Computer Simulation 12(3) (2002) pp. 230-248.
[21] J.K. Nurminen, O. Karaonen, K. Hatonen, What makes expert systems survive over 10 years-empirical evaluation of several engineering applications, Expert Systems with Applications 24(2) (2003) pp. 199-211.
[22] J.A. Miller, G. Baramidze, Simulation and the Semantic Web, in: Proceedings of the 2005 Winter Simulation Conference 2005.
[23] H. Lieberman, End-User Software Engineering Position Paper, in: End-User Software Engineering
Dagstuhl Seminar 2007.
[24] F. Paternò, Model-based tools for pervasive usability, Interacting with Computers 17(3) (2005) pp. 291-315.
[25] M. Huhns, Interaction-Oriented Software Development, International Journal of Software Engineering and Knowledge Engineering 11 (2001) pp. 259-279.
[26] M. Resnick, Distributed Constructionism, in: Proceedings of the International Conference on the Learning Sciences Association for the Advancement of Computing in Education, Northwestern University 1996.
[27] G. Fischer, Meta-Design: A Conceptual Framework for User Software Engineering. in: End-User Software Engineering Dagstuhl Seminar 2007.
[28] A. Begel, End-user Programming for Scientists: Modeling Complex Systems. in: End-User Software Engineering Dagstuhl Seminar 2007.